Commodities Stocks-Status
Are commodities (especially metals ) starting a new wave on upside !
Let’s analyse:
1st US Markets :
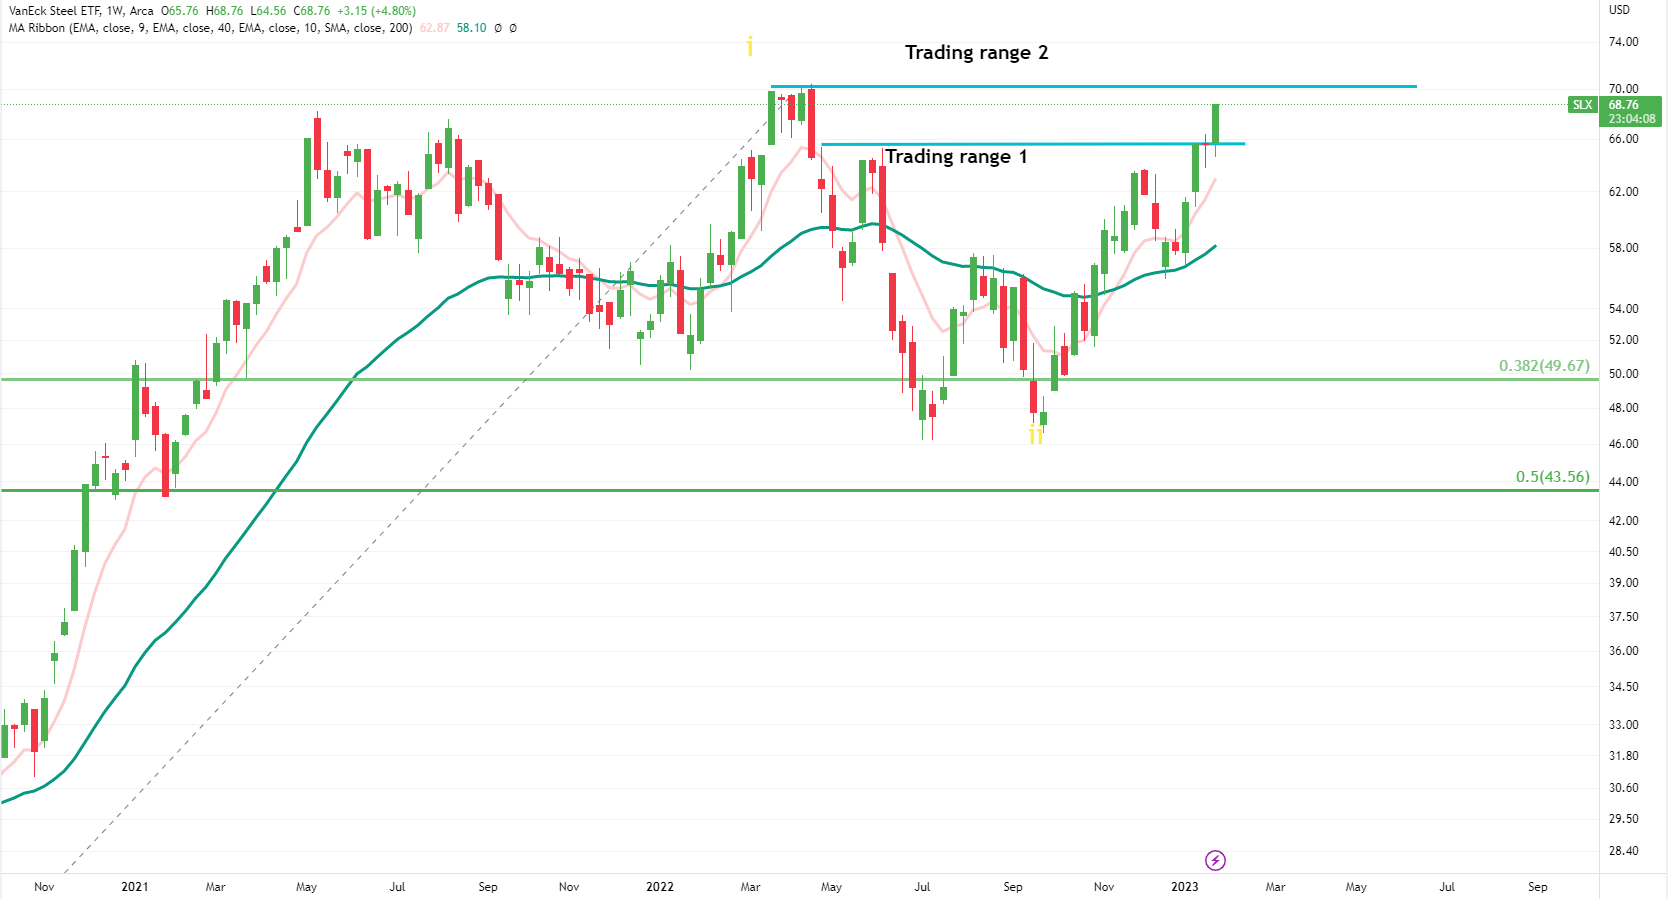
US Steel ETF -SLX
It is an ETF of major steel companies of US.
Seems to be in early stages of Stage 2 - is above 40 WEMA as well as above 9 WEMA -both are curving up and 9 WEMA crossed over 40 WEMA few weeks back.
Monthly/weekly /daily MACD in buy zone as well as RSI is above 60 in all time frames.
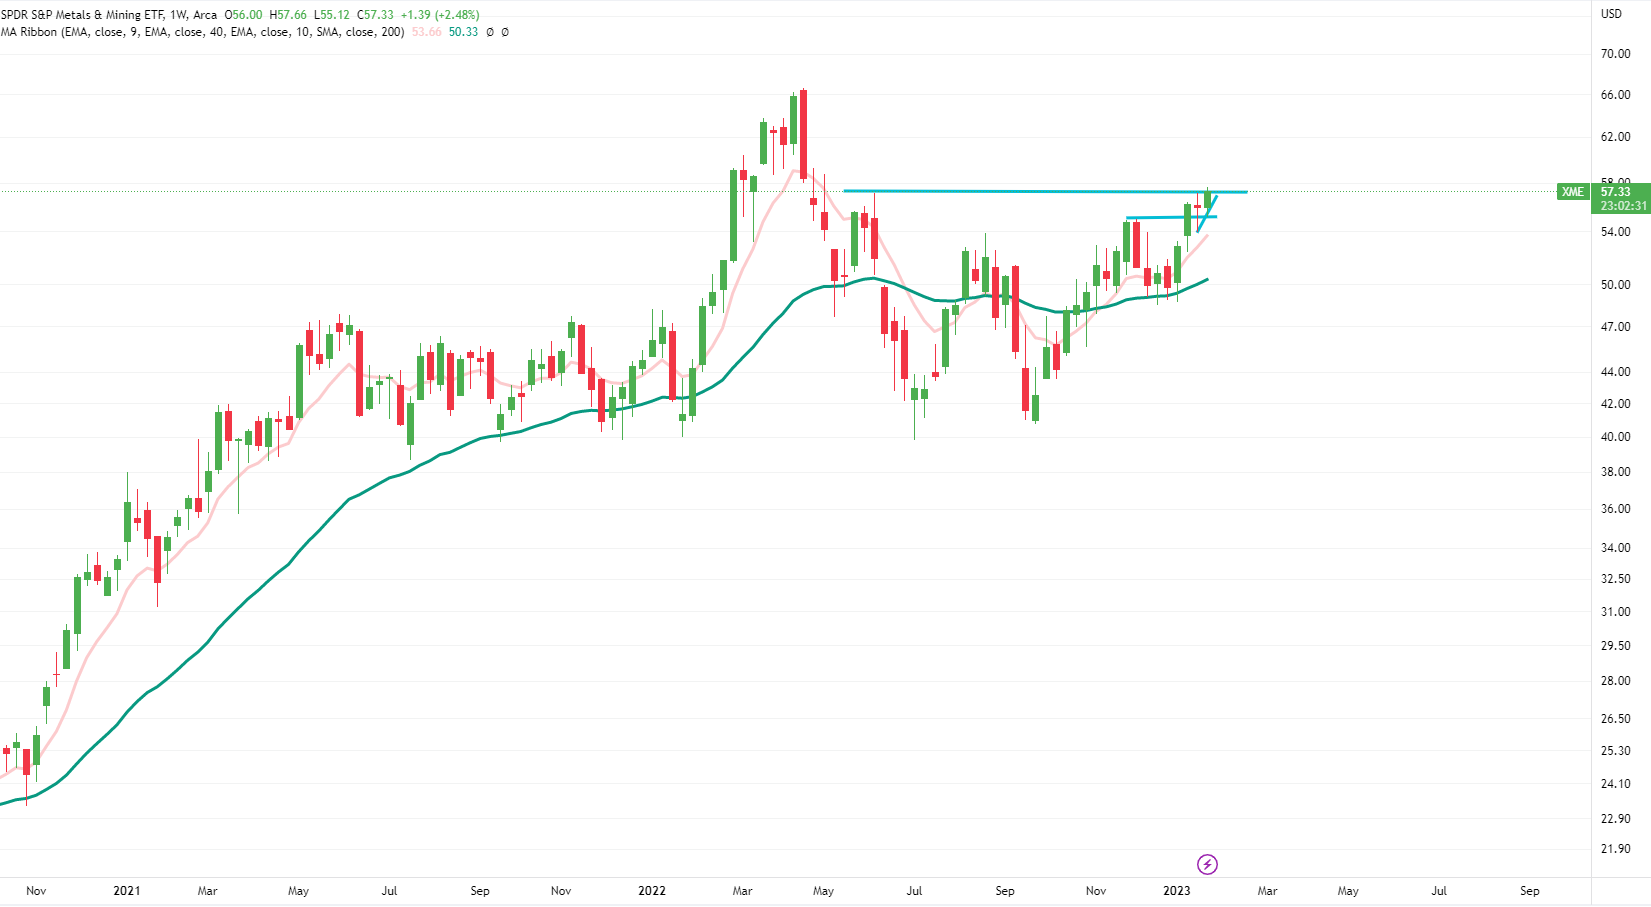
XME - Metals and Mining ETF
Again in early stage 2 , yesterday closed above first trading zone and obviously it is above 40 WEMA and 9 WEMA .
While MACD is in buy zone on daily/weekly time frame, it is yet to do on monthly.
RSI is above 60 on all key time -frames.
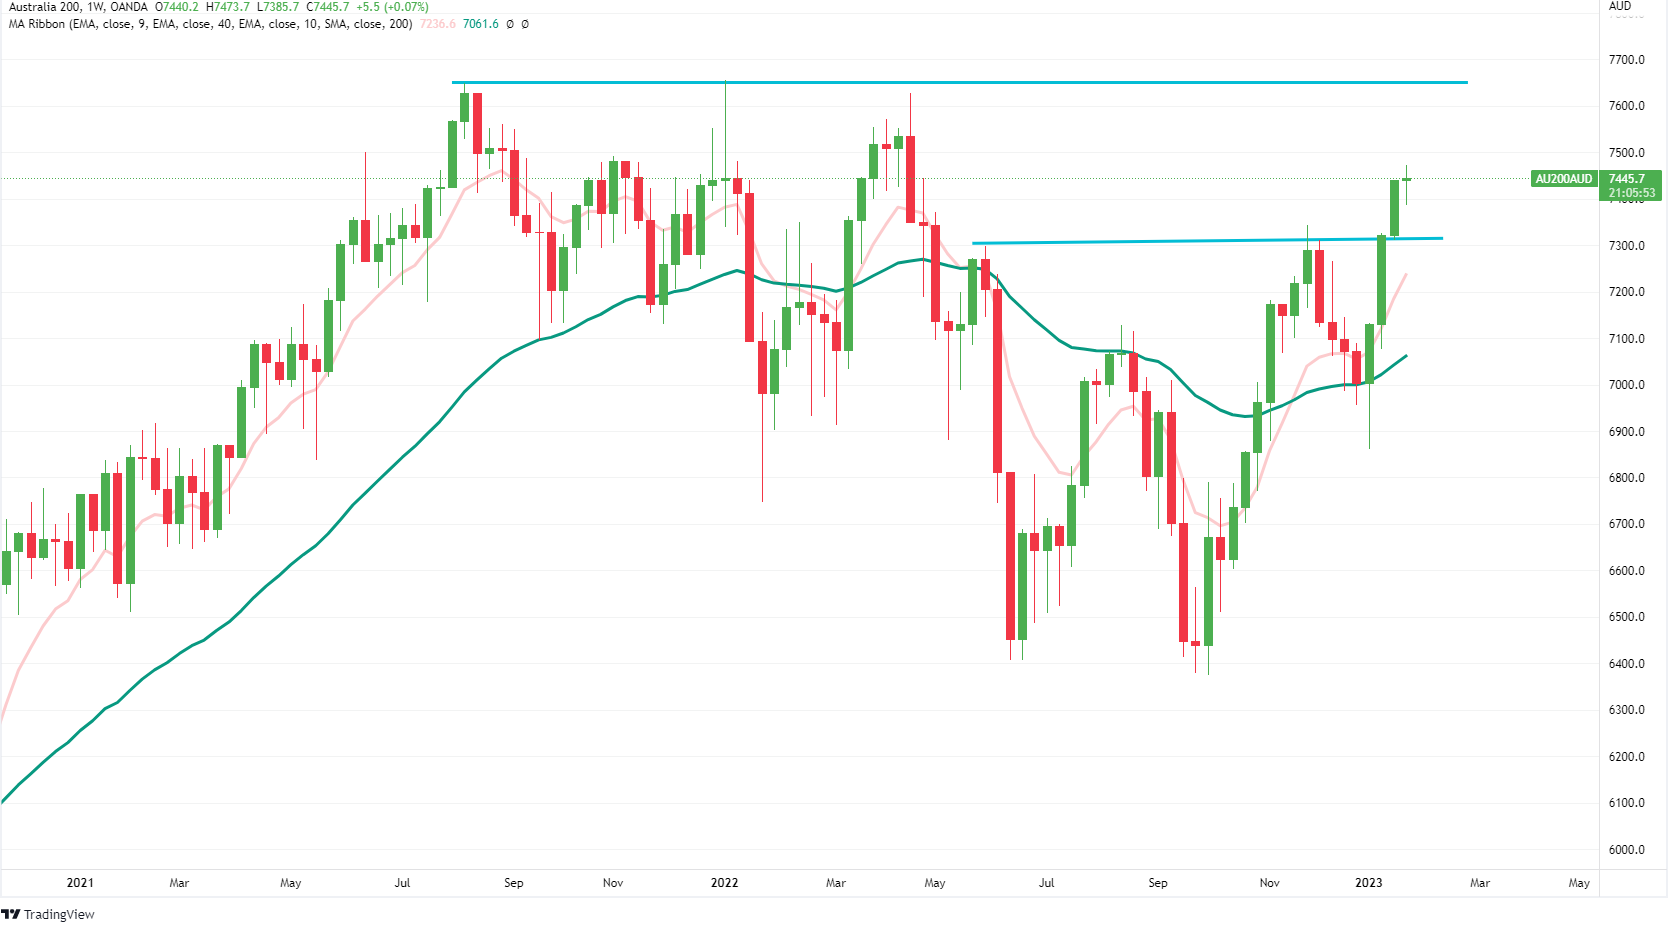
Key Commodity exporting countries
Australia is convincing trading above 1st trading zone in Stage 2.
It is just-2-3% away from all time highs - a kind of triple top - f that is taken out in coming weeks, that would be a strong signal that commodities are back in favor.
South Africa
It is showing very strong signs of Stage 2 .
MACD in buy zone on all time frames . RSI above 60 on all time frames.
It is now trading in blue-sky zone ie. no resistance on left hand side - well above all time highs.
As per EW theory, it is now wave 3.
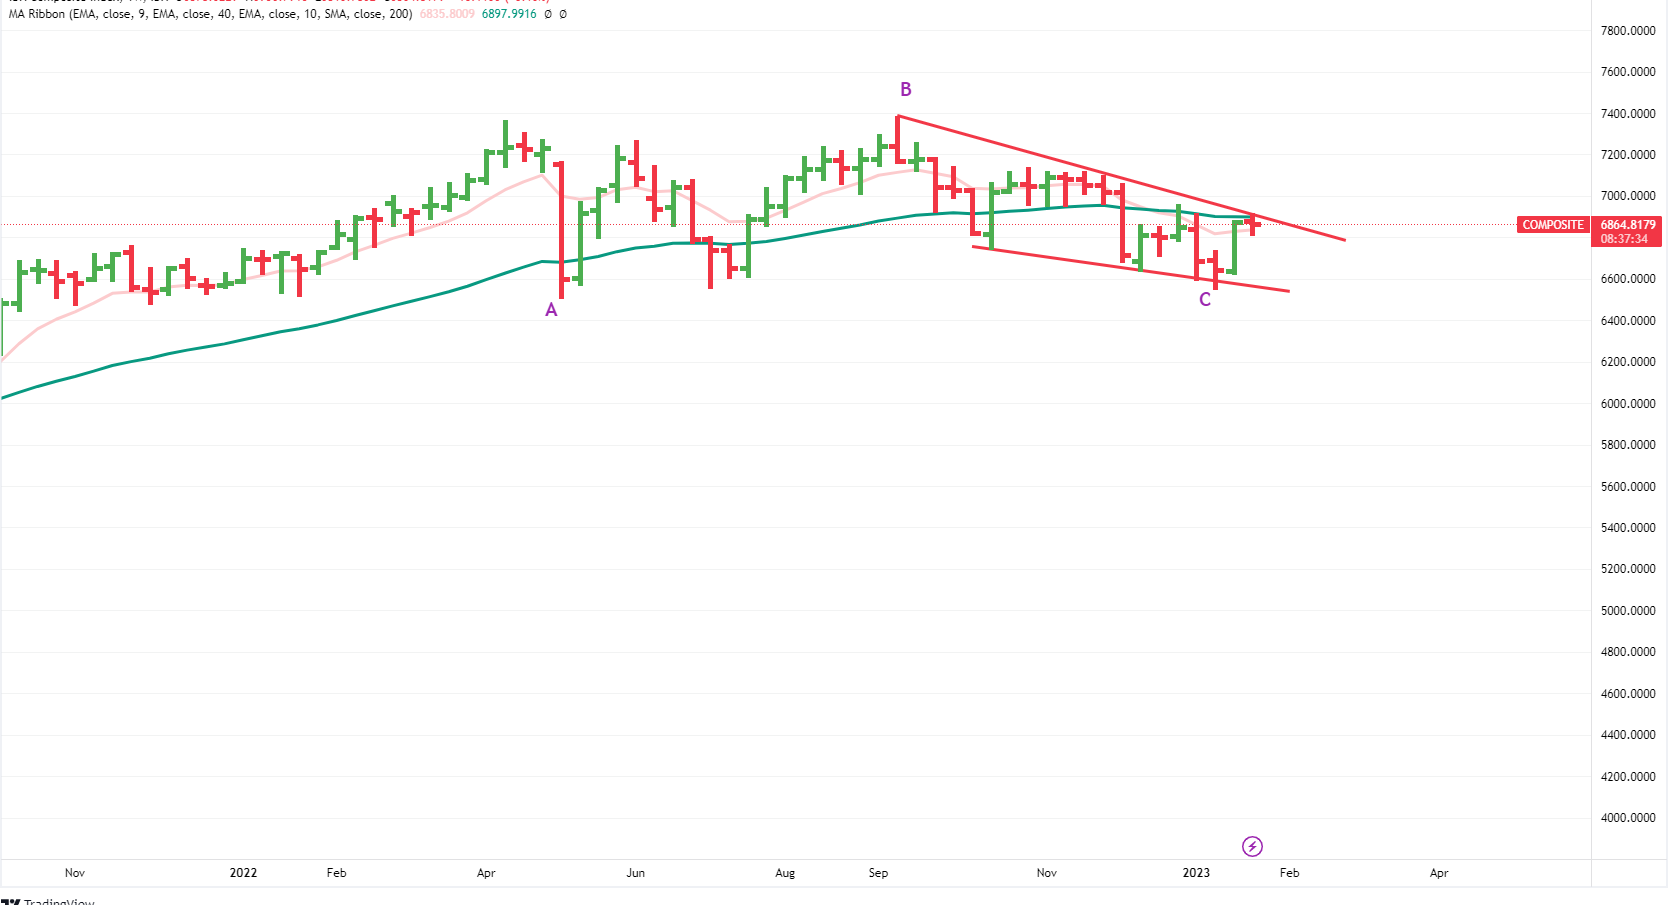
Indonesia
This is weakest among major commodity exporting countires.
Yet to cross over 40 WEMA ,although closing above curving -up 9WEMA . Although not showing much relative strength on all time-frames.
Although MACD is in buy zone on daily/monthly time-frames but still in sell zone in monthly.
May be the index here is impacted by internal inflation issues.
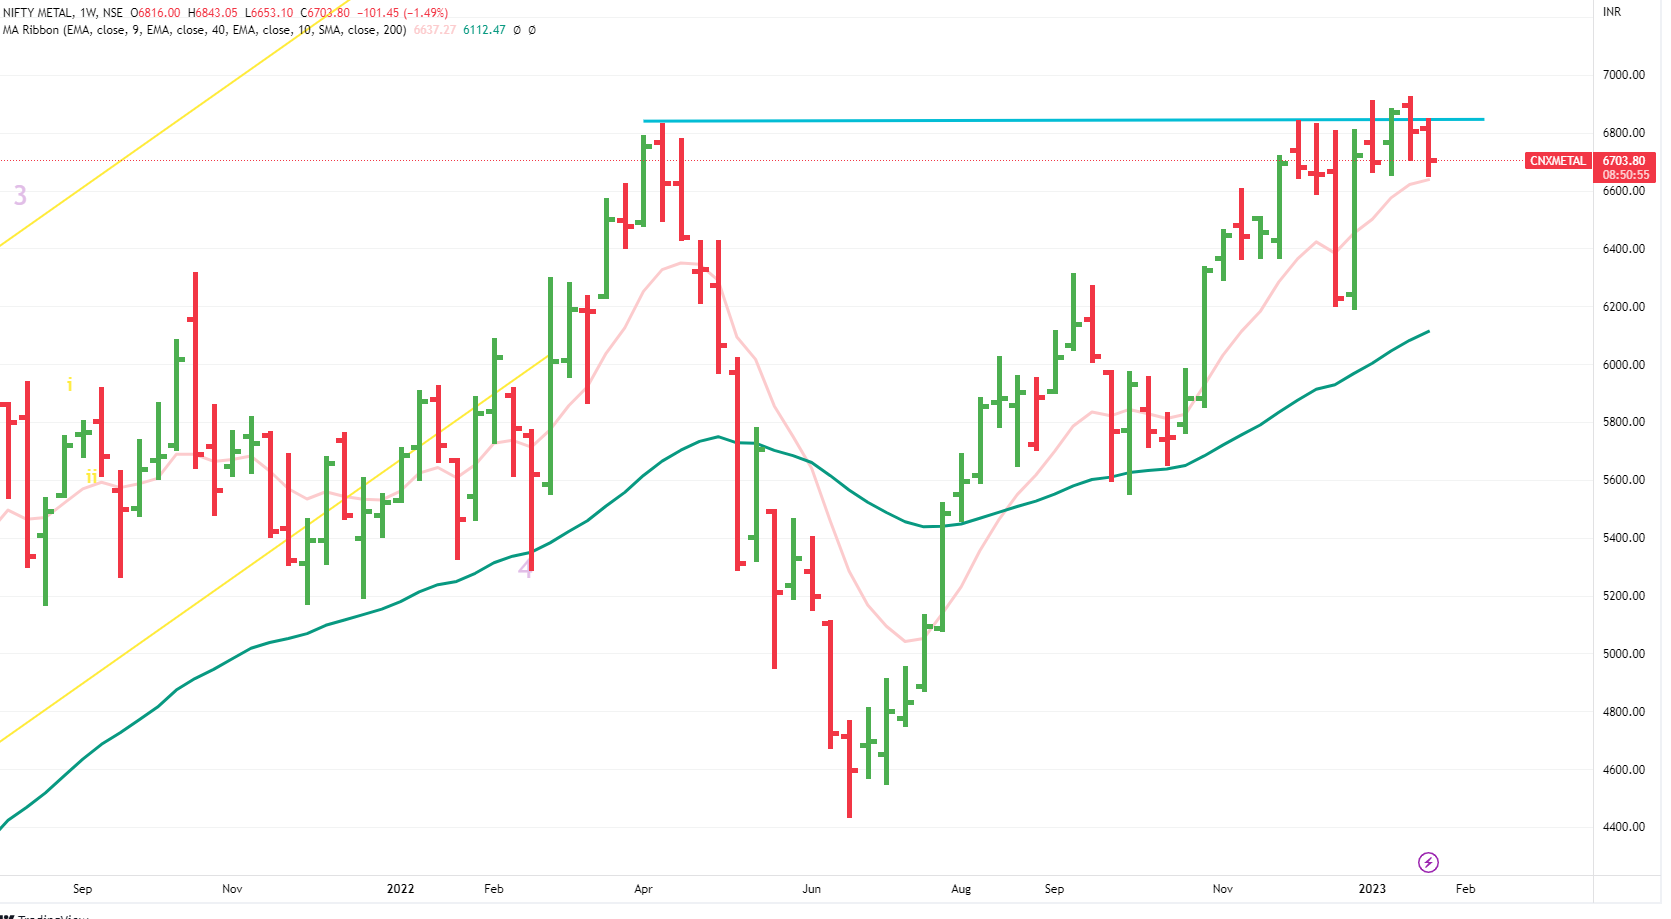
What about India ?
We track metals stocks from Nifty Metal index.
We’re back to all time high . Crossed APRIL 22 top few weeks back and now facing resistance there.
We are in early phase of Stage 2 but we’re yet to convincing close and cross above first trading zone ( shown by blue line) . Hence fingers are crossed.
Let’s keep a close watch on all of these key indices. If they work out , 3rd wave in metal-stocks can start . And as usual , 3rd waves are fast and furious.
Disclaimer :This post is just for learning few methods of price-patterns. Views are personal. No buy/sell recommendations. These are probability study methods and chances of success/failure depend upon various factors.