StageInvesting +Elliot Waves

KWEB

A US based ETF for Chinese Internet companies.

They say that there is always a bull market somewhere in world.You only need eyes to recognise it.

KWEB has risen 102% in last two and half months.It is at 34.7 , all time high was 104 in FEB 21.

Daily ,Weekly,MACD all are buy mode . It may face some resistance due to profit-booking but trend seems to be up.

Weekly Chart


Disclaimer :This post is just for learning few methods of price-patterns. Views are personal. No buy/sell recommendations. These are probability study methods and chances of success/failure depend upon various factors

3 Likes

Seems you were prescient. 2023 to be a difficult year. ??

Gautam Shah of Goldilocks also gives the same view. His track record seems good

how much can market correct by budget?

3 Likes

Gold
CMP 55743
With falling INR and rising gold prices at global level, it seems that we’re in a bull run for gold in India.

Prices are just few rupees away from all time highs.

RSI is >60 on all time frames (daily/weekly/monthly) as well as it is IN buy-zone on daily/weekly/monthly MACD .

Let’s see how it goes !

Weekly Chart -GOLD MCX

Disclaimer :This post is just for learning few methods of price-patterns. Views are personal. No buy/sell recommendations. These are probability study methods and chances of success/failure depend upon various factors

5 Likes

A Temporary Rally across global markets

Macros support some relief for investors.

DXY is falling.

US 10 Year yields also falling .

Expecting a short term rally across the global markets.
Disclaimer :This post is just for learning few methods of price-patterns. Views are personal. No buy/sell recommendations. These are probability study methods and chances of success/failure depend upon various factors.

4 Likes

China rally still going on rampant pace.

FTSE CHINA A 50 has broken the falling channel as well as monthly MACD has also gone into buy mode (daily,weekly MACD were in buy zones already)
Weekly Chart

1 Like

Bear Market Rallies

Many investors ignore the overall market cycles.

Markets movement is divided into 2 cycles - bull phase and bear phase.

A bull phase is when everything goes up and even mistakes are rewarded. Everything becomes overvalued. DCF assumptions become aggressive on positive growth expectations . Every news is a good news.
When the tide goes up , even stones start floating.

A bear phase is when stock prices start struggling. The upmoves don’t last long. Every good news is discounted . Every news is treated as a bad news. Valuations become cheap and even cheap becomes cheaper. Very few selective stocks can give outsized returns but 80-90% stocks underperform the markets.

The point to notice is that in a bear market, the fall is not in straight line. There are ups and downs. Here many people get confused. They treat bear-market rallies like a bull run has started.

Effort should be on identifying the overall trend - whether it is a bull cycle or bear cycle . It can help in deciding the allocation of one’s funds in different asset classes.

Here is a recent example of bear market rallies in Nasdaq. Till date we’ve seen 14 bear market rallies (>5% upmove in Index) in last 15 months .Every upmove was followed by a down-move.Not a good time to allocate higher amount of funds.

Here is another example from 2000 - the tech bubble.

The fall was not in straight line- many bear market rallis came before it started the bull run.

Stage investing method can help here - to identify the right trend , the right cycle.

13 Likes

Great thread. How do you see the reversal of this bear market from time spent in bear market this time. Appreciate your thoughts on that aspect vis a vis length of time spent in earlier bear markets.

CDSL: a giant head n shoulder top.

Disclosure: No recommendation, not invested.

2 Likes

Bear Markets Duration -Indian Markets

Major bear markets have lasted for 12- 18 months in last 2 decades in Indian bourses.
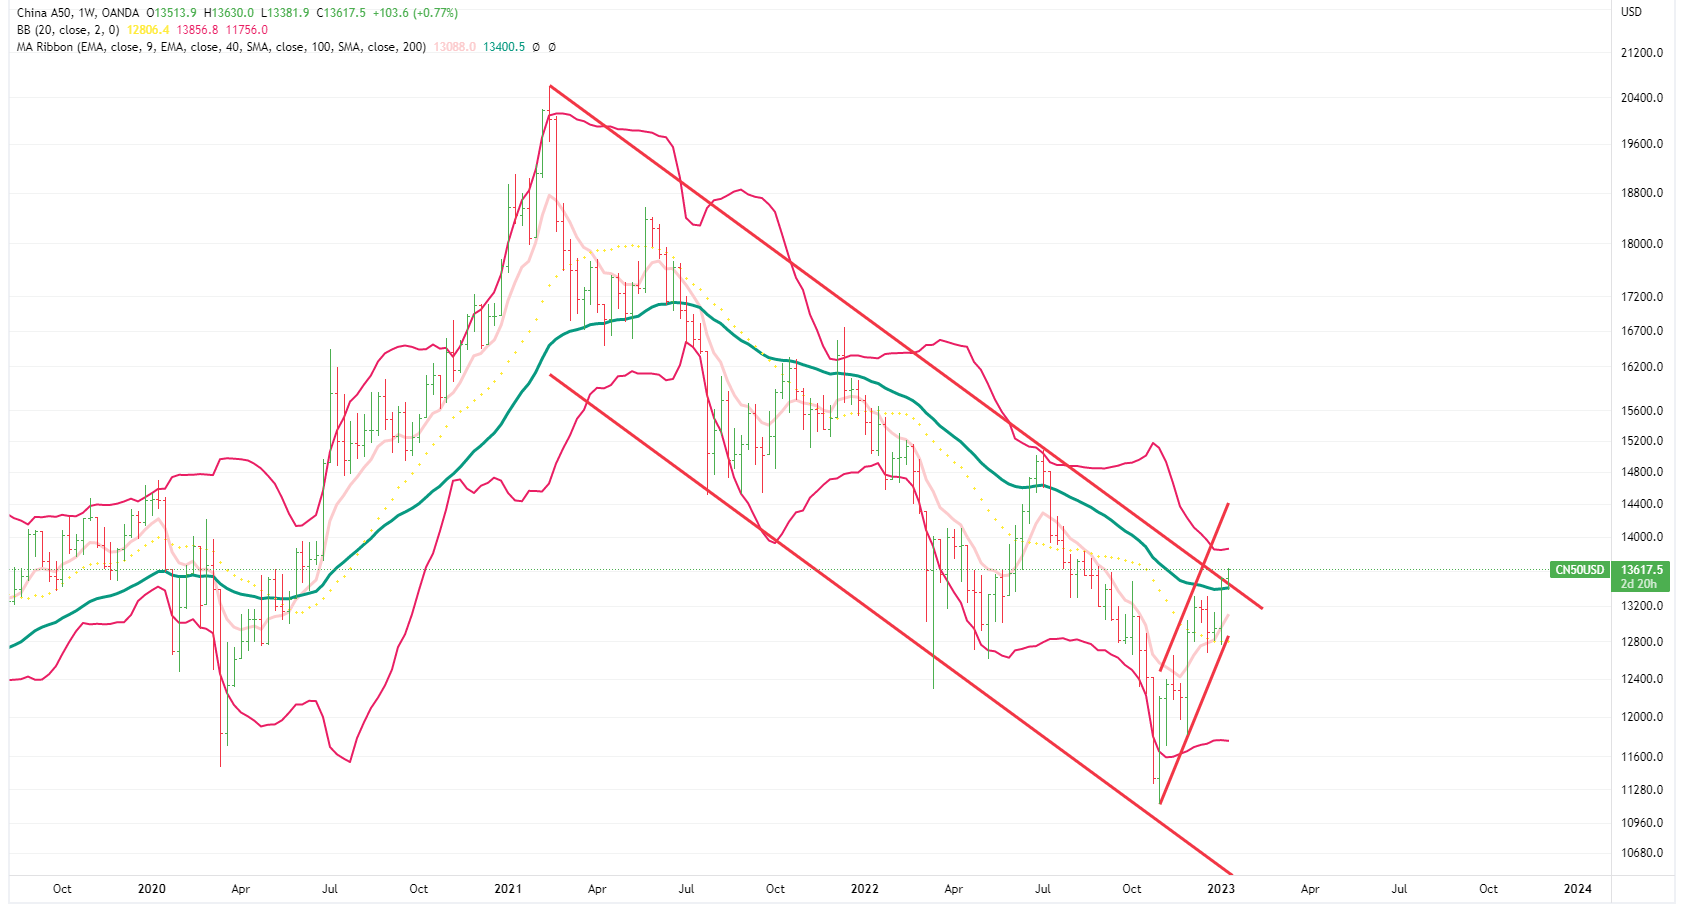
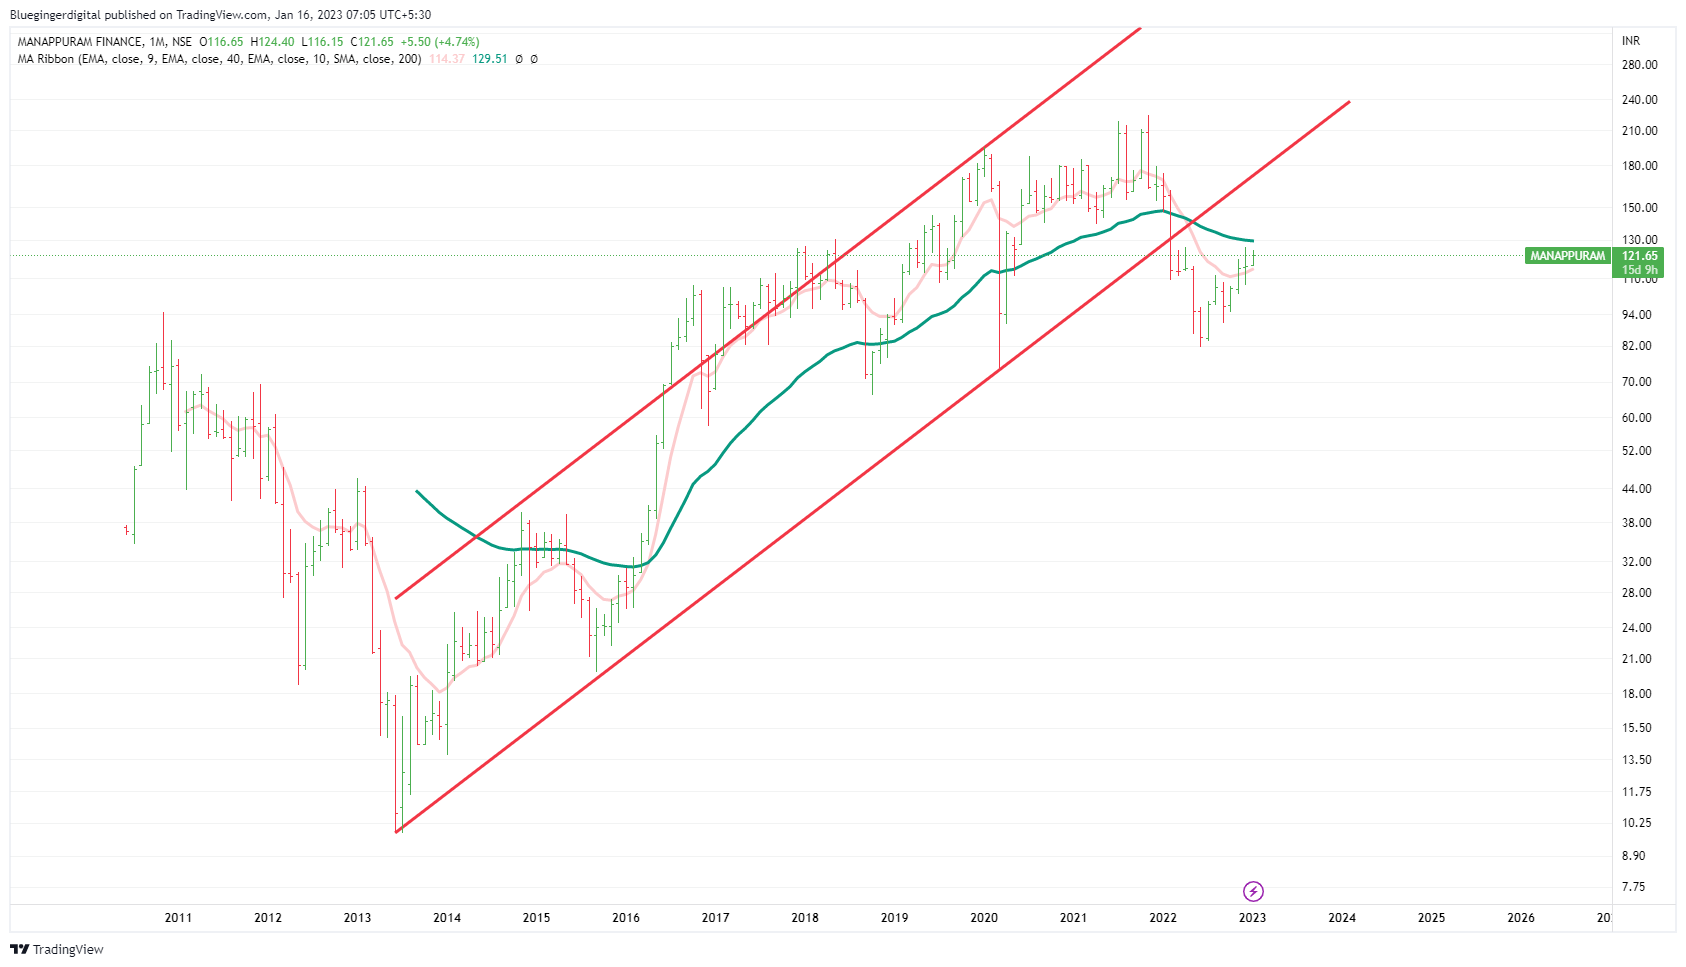
Historical Chart

Now what should be starting point for calculating the time for current bear market - Nov 2021 or April 2022 ?

Sensex is moving in a narrow range in all these months but there has been lot of damage in the prices of several sectors across the sectors ( e.g. IT, Chemicals ,Realty etc, etc.)

Based on the past patterns, we might keep correcting or reamin sideways till March /April 23 or June/July 2023.

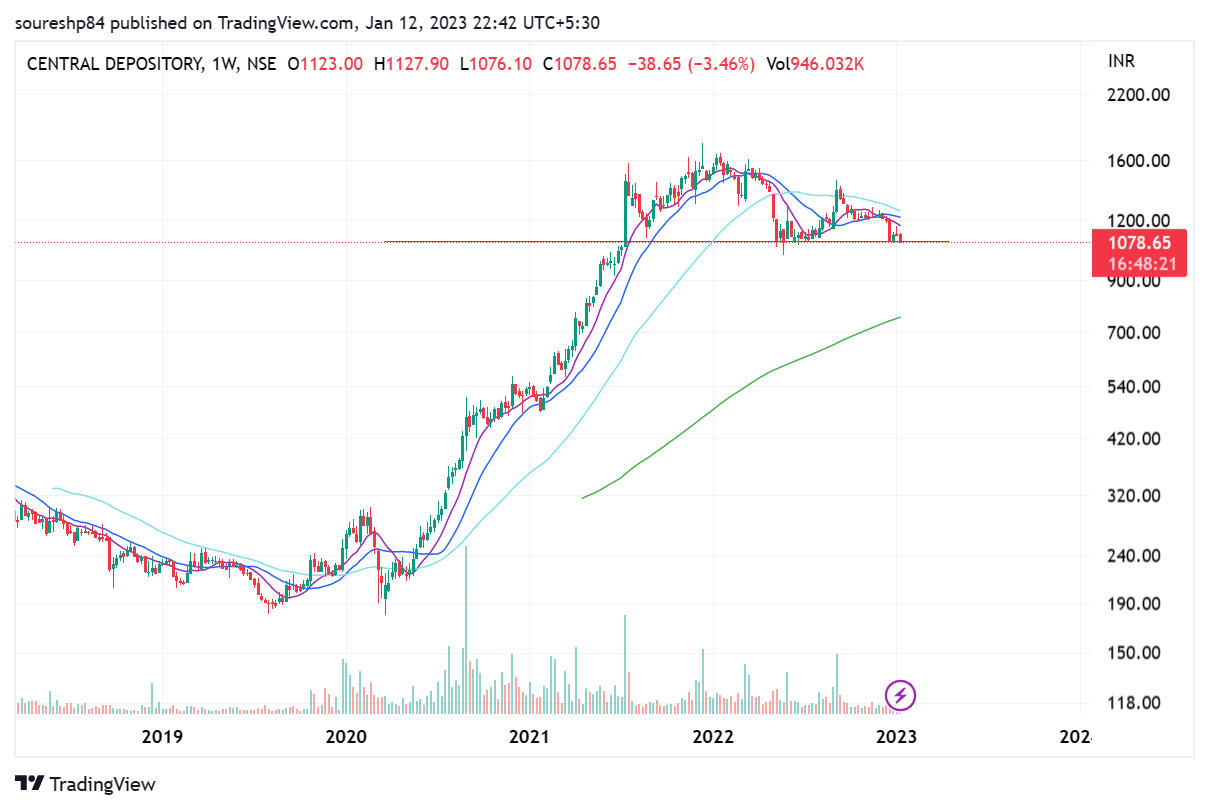
Also please keep in consideration that the correction happens in two ways :

i) Price correction - prices come down to match the intrinsic value of the companies or they fall to much lower levels ( market is irrational )

ii) Time correction - Prices don’t fall much , they keep moving in a range for months and years till the earnings catch up the valuations level.

And many a times, they do the both.

Given below is the quarterly-chart of Hindustan Unilever that depicts its price -journey in last 25 years in Indian markets . We’ve tried to highlight the period where the stock was doing price as well as time correction.

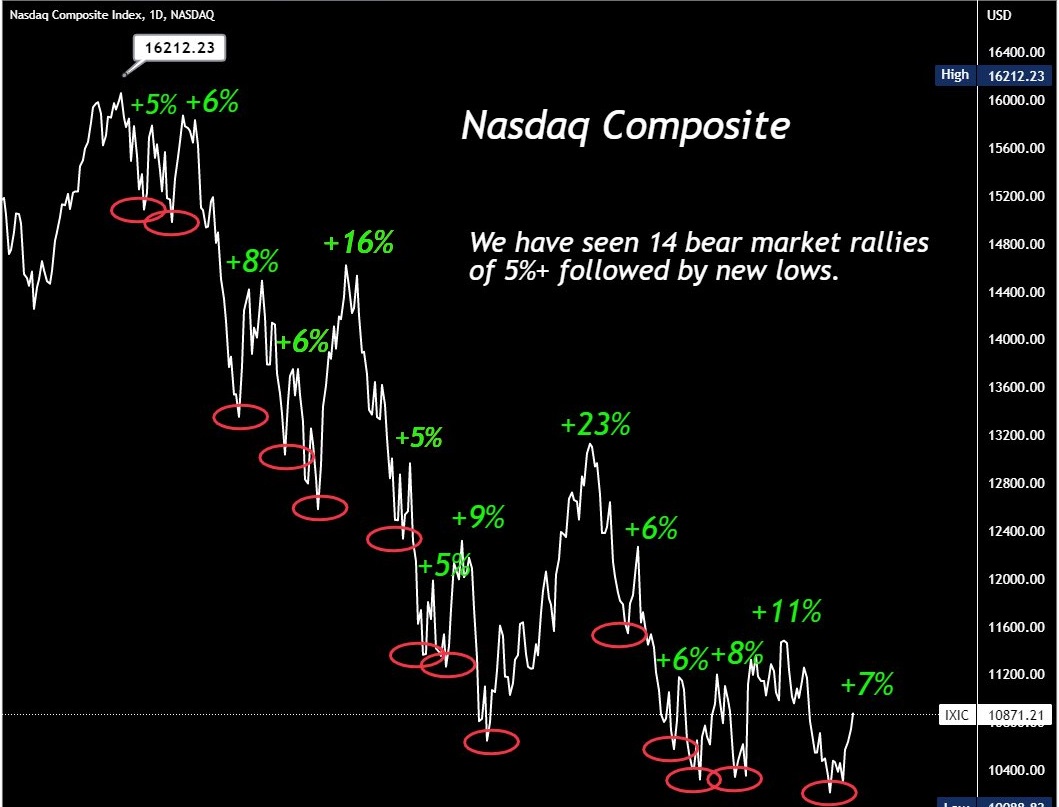
Other point to highlight is that in bear markets the prices don’t fall in a straight line.
There are periods of short-term recoveries (bounces ). Hence one needs to have clear view of short/medium/long term horizons.

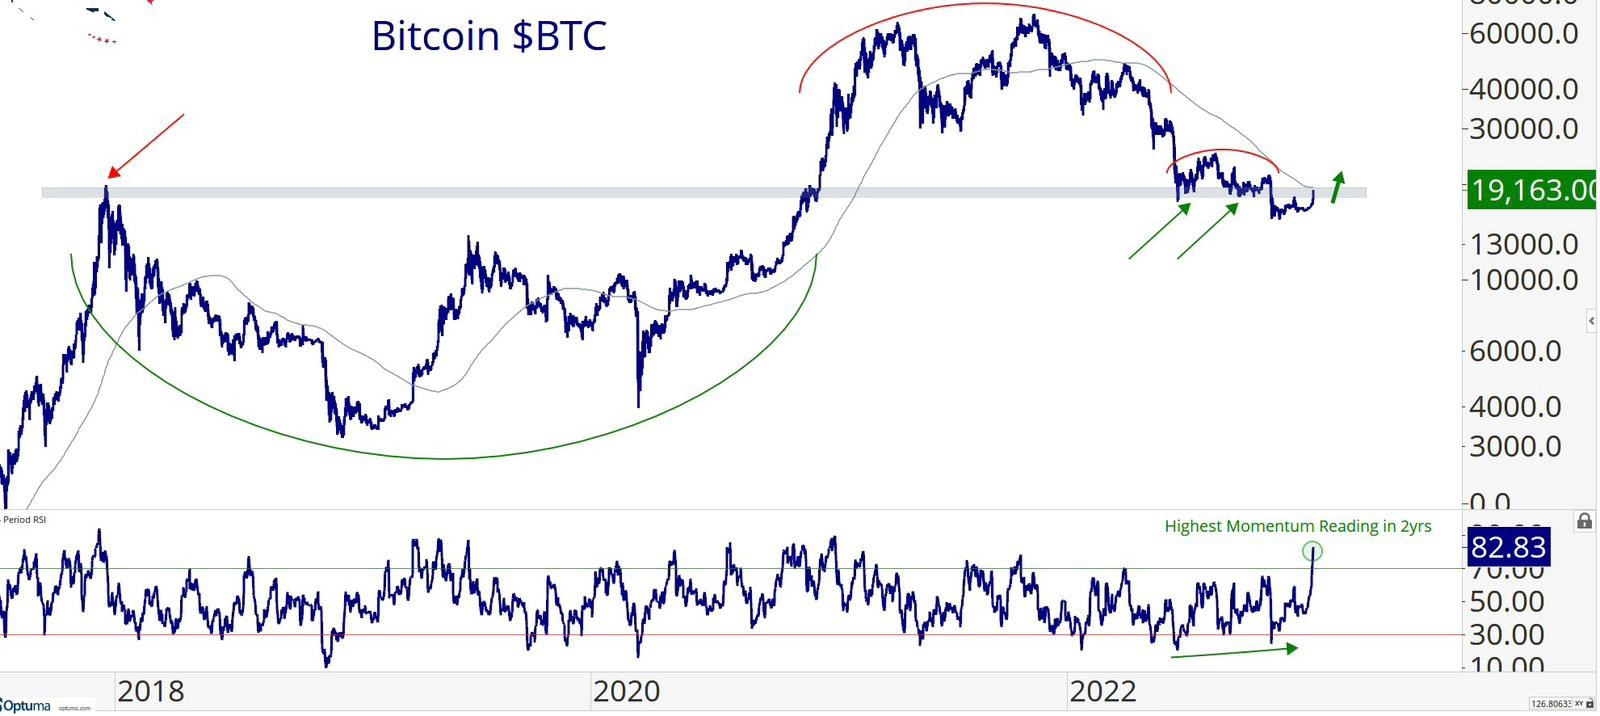
For example, we are of the view that in very short term ( 2-3 weeks) , we might go up a bit till budget.

And in medium term (3-6 months) , we might keep falling or in a range.

From longer term prespective ( 4-5 years) , India is in a bull market.

Hope it helps.

14 Likes

2 Hours - On This Weekend

If you love stocks and you love numbers , you might like to know the bigger picture.

So get your popcorns and get ready.

We’re sure that it would change the way you think about the asset-prices.

A caution - it is a talk about big macro long term trends ,don’t get scared in short term.

Nothing happens overnight, you will get lot of chances and time to position yourself for coming decades.

Happy Viewing.

3 Likes

Another sign of a relief rally can be gauged from the price movements of Bitcoin.

Bitcoin has risen 37% in last few days (Nov 21st onwards).

Bitcoin is an indicator of global liquidity conditions.

As the liquidity dries , Bitcoin price goes down and vice -versa.

Similarly all other risk-on asset prices go up as soon as liquidity eases.

It seems central banks realized that something big is about to break due to their last 6 months actions and to avoid that they released some liquidity in the system without talking about it .

That’s why all risky assets prices are going up ( equity , crypto etc )

Bitcoin can go up to 30 K in next 2-3 months ( at the top of the previous cycle )

Now need to keep a close watch on how many weeks/months this rally can continue in global markets ! Or we have made the final bottom !

2 Likes

@StageInvesting, What are your short and long term views on Lux Industries and Alembic Pharma?

Alembic Pharma , Lux Industries

Both the stocks chosen by you are showing similar signs:
a) Both have retraced close 80% of their last leg of rally- they may be near to their bottoms
b) Both are retatively weaker wrt iither stocks of their own sectors as well as in context of index- a sign of great weakness.
c) There seems to be small divergence on RSI . That means they’re cose to bottom.
d) In case of Alembic pharma,keep a watch at 542 (recent low), if it breaks that then it can go more lower.
e) For any upside ride, we would first wait that these first close above 20 WMA as well as let dialy and weekly MACD give buy signal. We would increase out position size we if keep geeting positive signals like closing above 20 DMA, 40 DMA, 20 WMA,40 WMA , MACD buy signals on different time-frames etc etc.

Alembic Pharma-Weekly Chart

Lux Industries -Weekly Chart

We can’t predict anything on long term as we don’t track the fundamentals of these companies. But looking at charts, deep corrections - it seems that something is wrong.
Disclaimer :This post is just for learning few methods of price-patterns. Views are personal. No buy/sell recommendations. These are probability study methods and chances of success/failure depend upon various factors.

2 Likes

@StageInvesting With gold prices increasing, how do you see Muthoot Finance and Manappuram Finance on the charts?

Any thoughts on Intellect design and KPR Mill?

Muthoot Finance
CMP 1062

Although gold has crossed its all time high (ATH), Muthoot finance is 30% lower than its ATH.
Is that a hint that there is no longer a direct correlartion with gold prices . May be it is due to competition from other NBFCs and Banks in this sector due to high OPMs of the past.
Loans against gold are the most secure ones , so every loan-giving company would like to enter in this field.

Let’s look at the charts .

Long term Monthly Chart

It is at the lower end of its long term channel (9 years ) and is below its 40 MMA.

Generally stocks having a good future- growth trajectory tend to bounce back from these lower-end of these longer term channels.
But here we need to wait as it is lingering there for last 405 months.

How to judge whether it is turning around ?

Weekly Charts - here we need to use the Stage Analysis method.

That means the stock should start closing above the 40 weeks moving average and 20 weeks moving average should be looping upwards.

In this case, the price is well below 40 WMA and is hovering near 20 WMA.

It has clear resitance near 1120-1140 range . Crossing and closing above these levels for 1-2 weeks would be the first sign that stock has some upside potential.

Even on daily charts, it is below 20 DMA and 40 DMA.

Daily, Weekly,Monthly MACD are in sell -mode.

Stock is reletively week wrt other NBFCs (laggard in sector )as well as market index.

In short- as of now, it is not showing any indication except that
a) It is near lower end of longer term channel.
b) there is some positive divergence in monthly RSI
.

But for anything related to monthly chart take weeks and months to play out.
Disclaimer :This post is just for learning few methods of price-patterns. Views are personal. No buy/sell recommendations. These are probability study methods and chances of success/failure depend upon various factors.

Manappuram Finance
CMP 121.65
Lot of things mentioned about Muthoot Fin in the above post also apply to this stock. although chart is little different .

Monthly Chart
It broke the long term channel long back and is still below 40 % below its ATH.
It is still below 40 WMA moving average.
In last few months , it trying to move up and has recovered a bit.

On weekly charts, it looks better than Muthoot as it is trading above 40 WMA. It is in buy zone on all time frame from MACD prespective but we will not rush (technical reason given below)

Strong Resistance Ahead
a) It is yet to cross the trading zone on weekly chart - it has strong resistance in the range of 126-133.
b) On monthly chart,40 MMA and 20 MMA may also act like resitances - that is the range of 130-135 .

So unless the stock does not cross 135 level with volume and close above these levels on month-end, we won’t look at this for long term investment.
Disclaimer :This post is just for learning few methods of price-patterns. Views are personal. No buy/sell recommendations. These are probability study methods and chances of success/failure depend upon various factors.

1 Like

Intellect Design
423

It is very difficult to decide whether a stock has reached its bottom , but let’s try.

This stock has corrected 61.8 % (Fib number ) and is formaing a base near that for last 3 months.
Generally good stocks tend to recover from these levels (off course market and sector conditions should also rhyme)
Monthly chart

On weekly chart , we can see some hidden divergence on RSI as well as C=A .
It indicates that may be we’re near the bottom ( but we can’t depend upon only on this single indicator !)

So we’ve three things that might suggest that we’re near the bottom - 61.8 % retracement of last few years rally , A=C are equal now and a positive RSI divergence on weekly charts.
This only helps us that it should be in our watch list.

But here are few more positive signals that are yet to come :
a) It is in sell mode on daily,weekly,monthly MACD
b) It is still trading below 20 DMA,40 DMA,20 WMA,40 WMA.
c) We are yet to see volumes , big hands should show some inclination to buy.

Even if it starts showing some more postive signs, we would not go all in at once . As market index ,sector as well as stock should show overall positive sentiments.

So if we plan to ride this, we would to take some position when it closes above 20 dma, has buy signal on daily MACD and then we would keep on adding as it crosses and closes above 40 DMA, 20 WMA, 40 WMA with buy signals on weekly.
But major position would be added if it crosses and close above 500-510 with volumes as that is big gap zone on daily.
Disclaimer :This post is just for learning few methods of price-patterns. Views are personal. No buy/sell recommendations. These are probability study methods and chances of success/failure depend upon various factors.

8 Likes

KPR Mills
524

On charts ,from longer term prespective ,there is nothing to suggest that the correction is over.

Monthly Chart


Weekly Chart

As per stage analysis method, we can see that it is either in S1 or S4. Is trading below 20 WMA as well as 40 WMA. Till the time it does not cross and closes above these fore few weeks , we can assume that it is either in downtrend or would remain sideways.


Disclaimer :This post is just for learning few methods of price-patterns. Views are personal. No buy/sell recommendations. These are probability study methods and chances of success/failure depend upon various factors.

3 Likes

Please give your recommendation for gujarat fluorochem, krbl and wabag