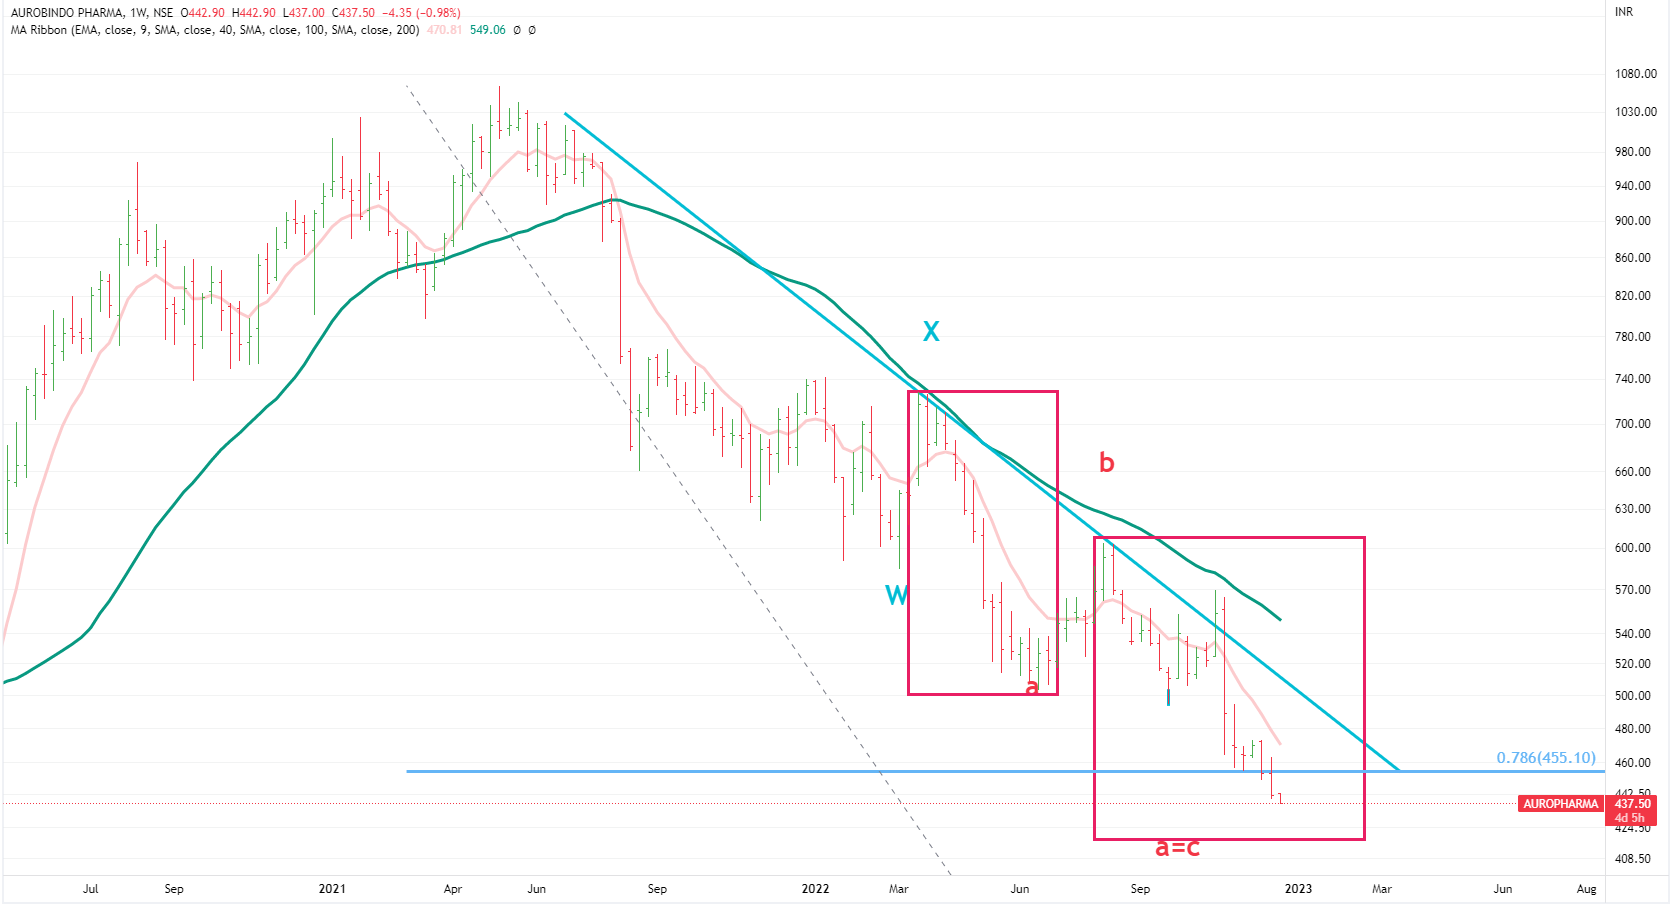
Auro Pharma -Follow-up
CMP-437
A silent mover…silently moving towards its projected targets (Oct 16TH post)
Auro Pharma -Follow-up
CMP-437
A silent mover…silently moving towards its projected targets (Oct 16TH post)
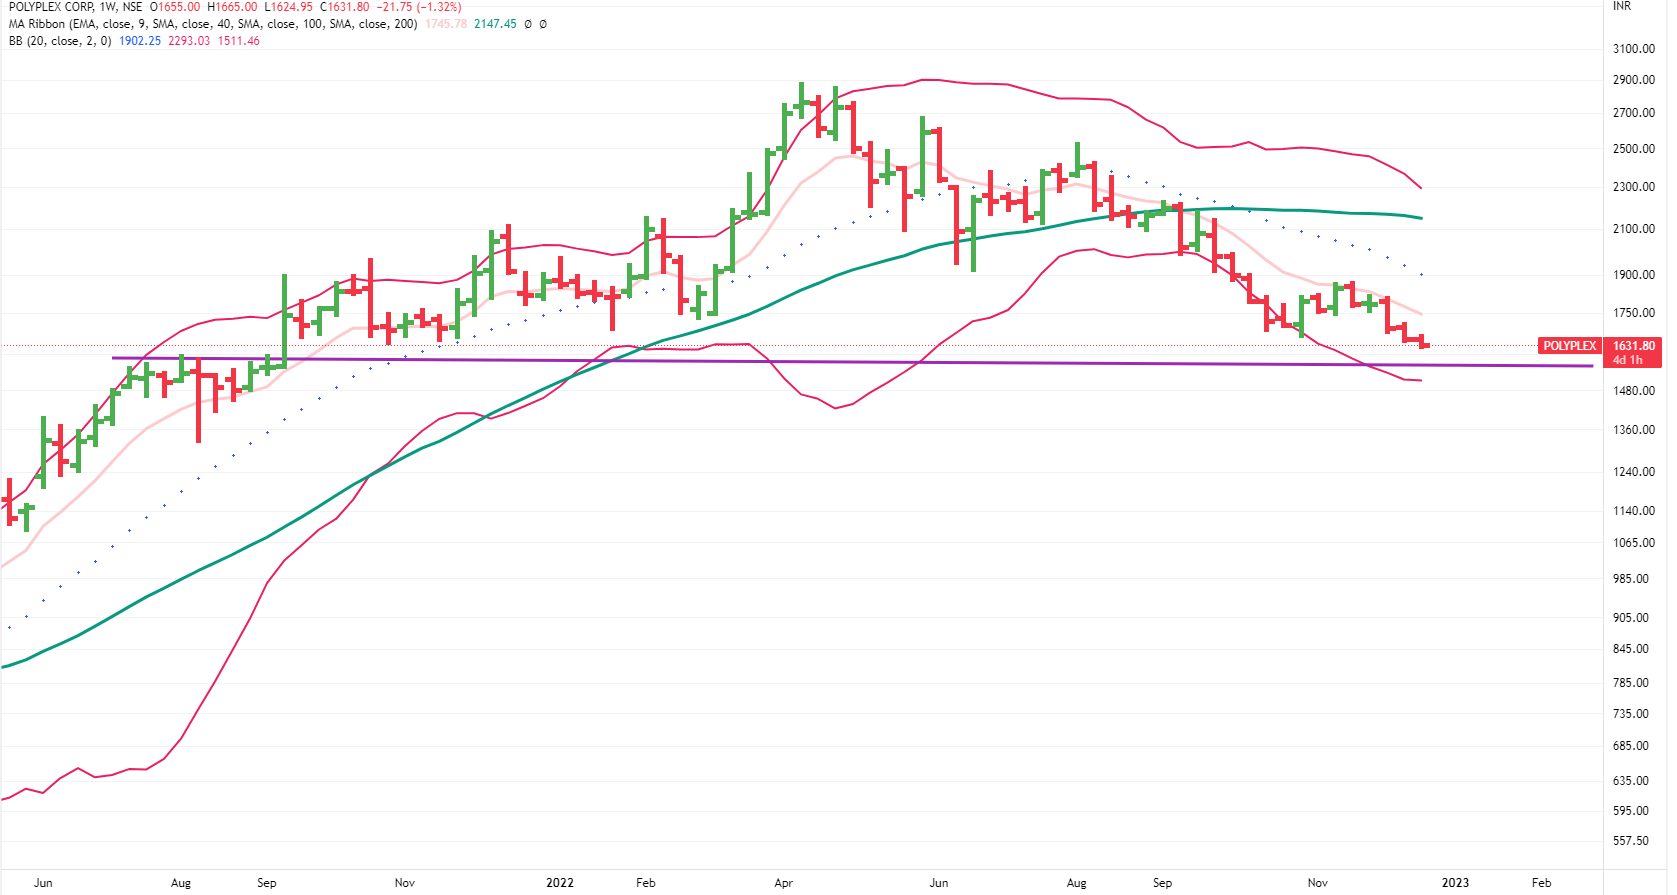
is polyplex in break down stage?
PolyPlex
CMP -1631
You’re asking very late. It broke down months ago.
Next support is between 1550-1500 (lower Bollinger Band at weekly). If it does not stop there, then we can see the levels of 1250 in cming months.
Weekly Chart
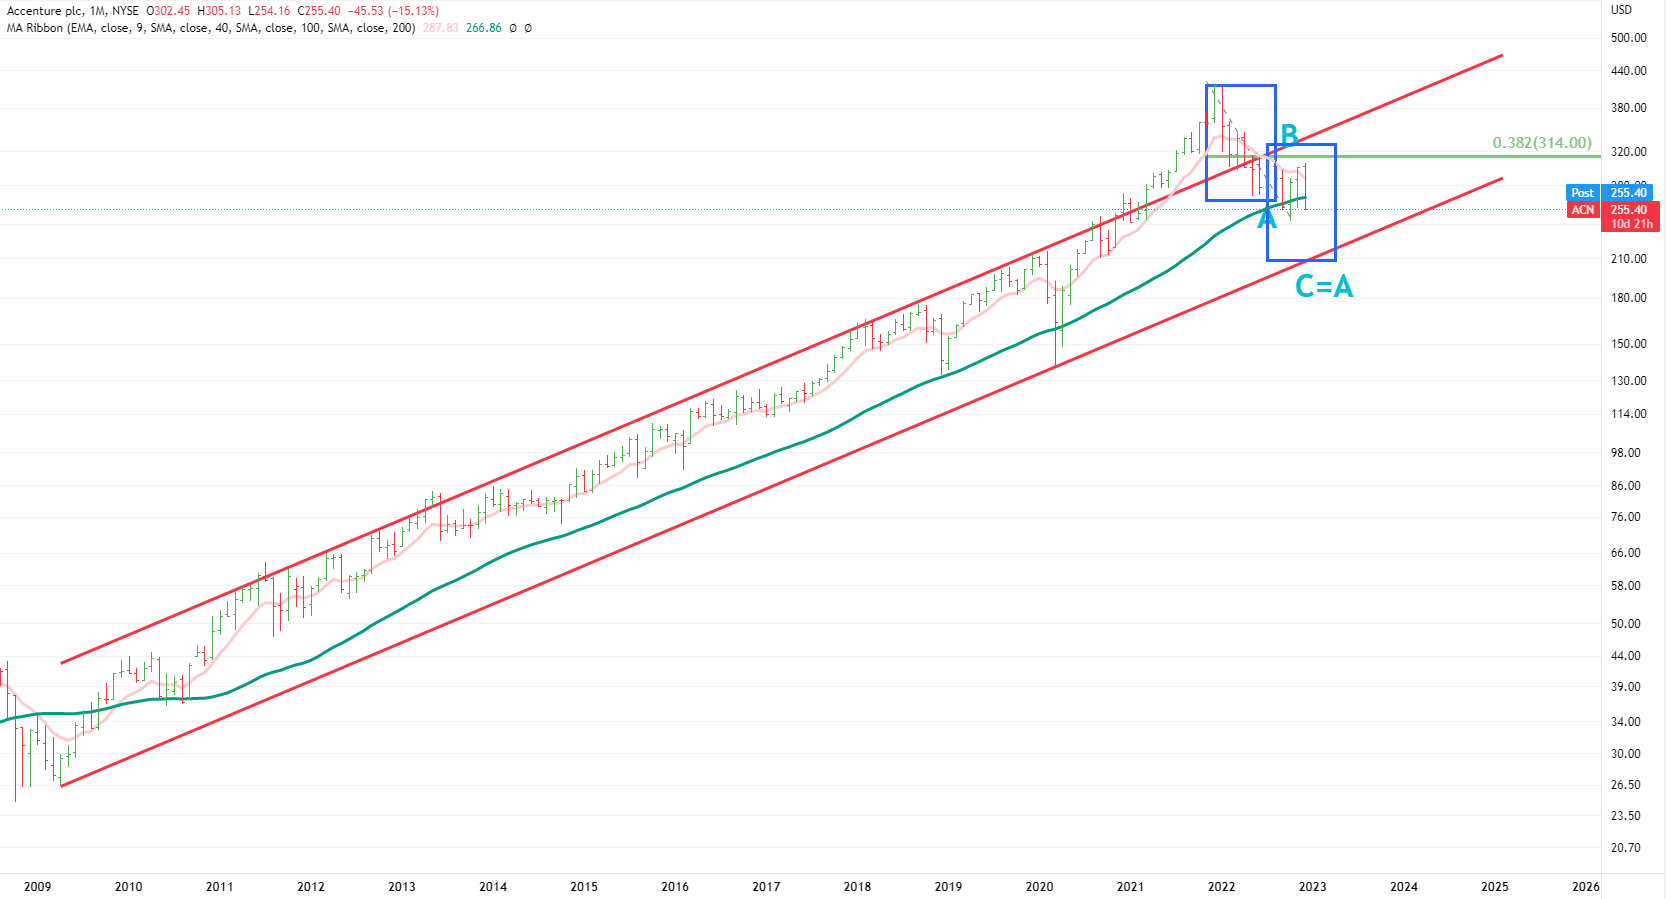
ACCENTURE
CMP 255
To keep track on where Indian IT stocks can bottom, keep an eye on Accenture.
Accenture as a company is having lot of advantages but is trading at cheaper price than many leading IT companies .
It seems that it would close below 40 MMA this month . And as per the chart, it can go down much deeper.
Lower end of long term channel (from 2009) is near 210 and it also coincides with where C=A. So at aleast 15% correction is balance as per this chart.
Keep track of it , and one can get sense of where Indian IT pack can go.
Monthly Chart
Keep in consideration that it is a monthly chart, hence it might take few months for this scenario to play out (if it plays out)
Disclaimer :This post is just for learning few methods of price-patterns. Views are personal. No buy/sell recommendations. These are probability study methods and chances of success/failure depend upon various factors
Just a friendly reminder. Take care please.
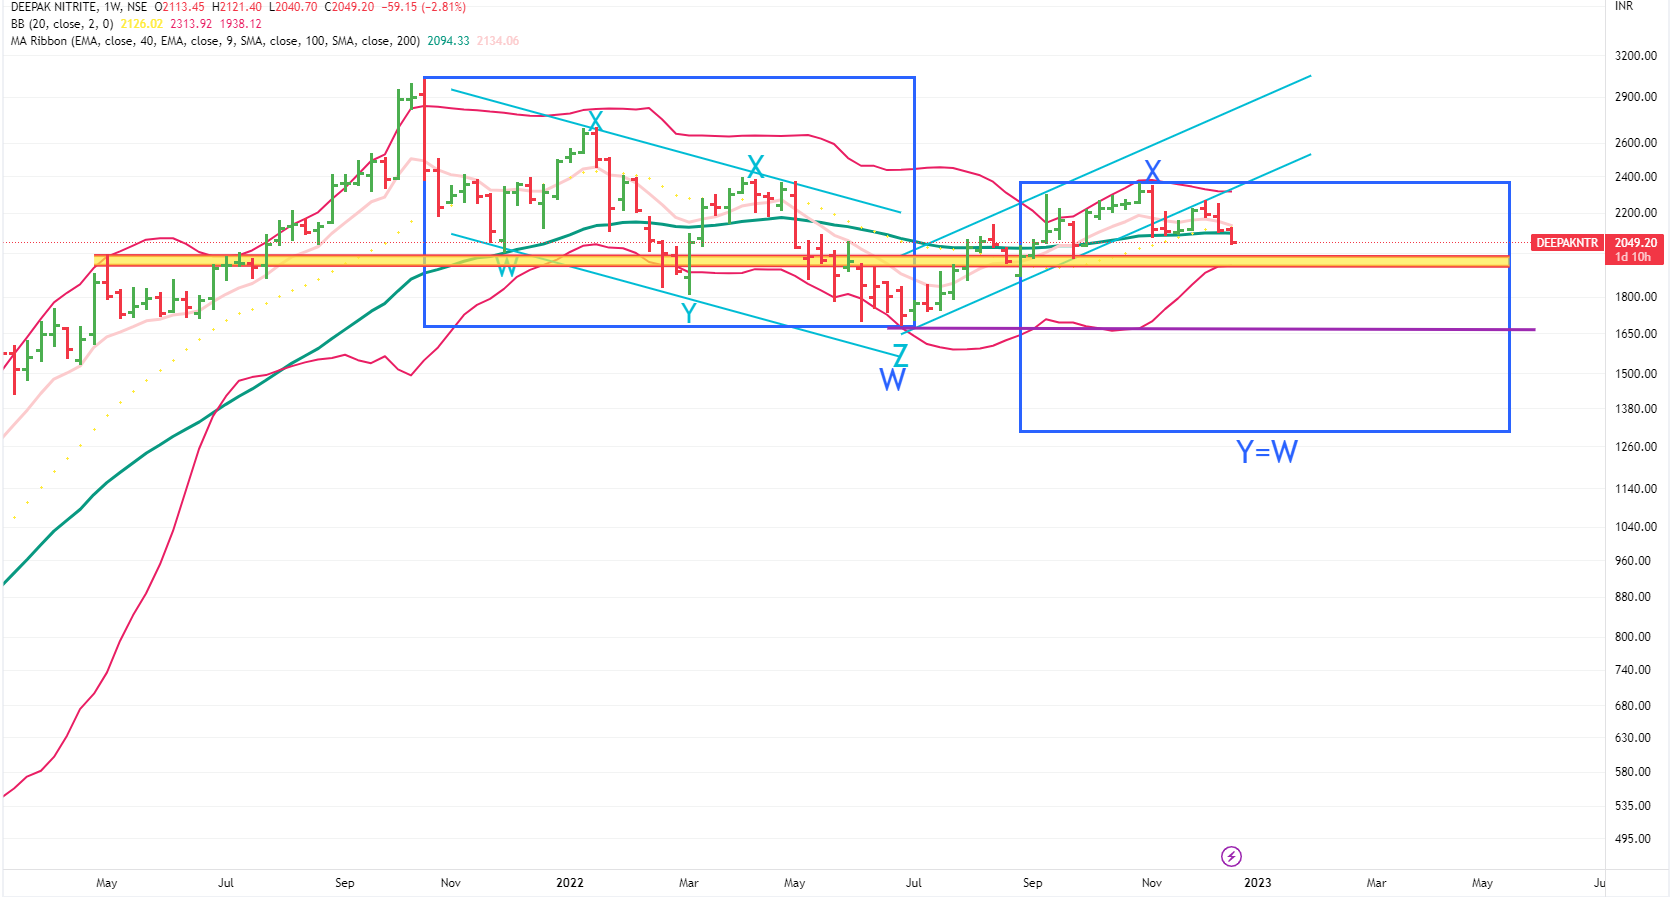
DeePak Nitrite
CMP 2050
It seems that it has entered Stage 4- has broken 40 WEMA very convincingly but let’s wait for the close below it on weekend ( expecting a small bounce in very short term)
Daily.Weekly,Monthly -All MACD is sell zones and <60 RSI signifies the weakness in the chart.
Next support levels are in yellow -zone ie between 1988-1940 (lower end of weekly BB).
Once that breaks, it might go to June lows of 1681. After that 40MMA can be the support ie near 1580 as of now.
And if the market sentiments remain week, we might achieve Y=W.
In short, lot of levels to track.
Weekly Chart
Keep in consideration that it is a weekly chart. It might take weeks and months for the projections to play out (if they play out)
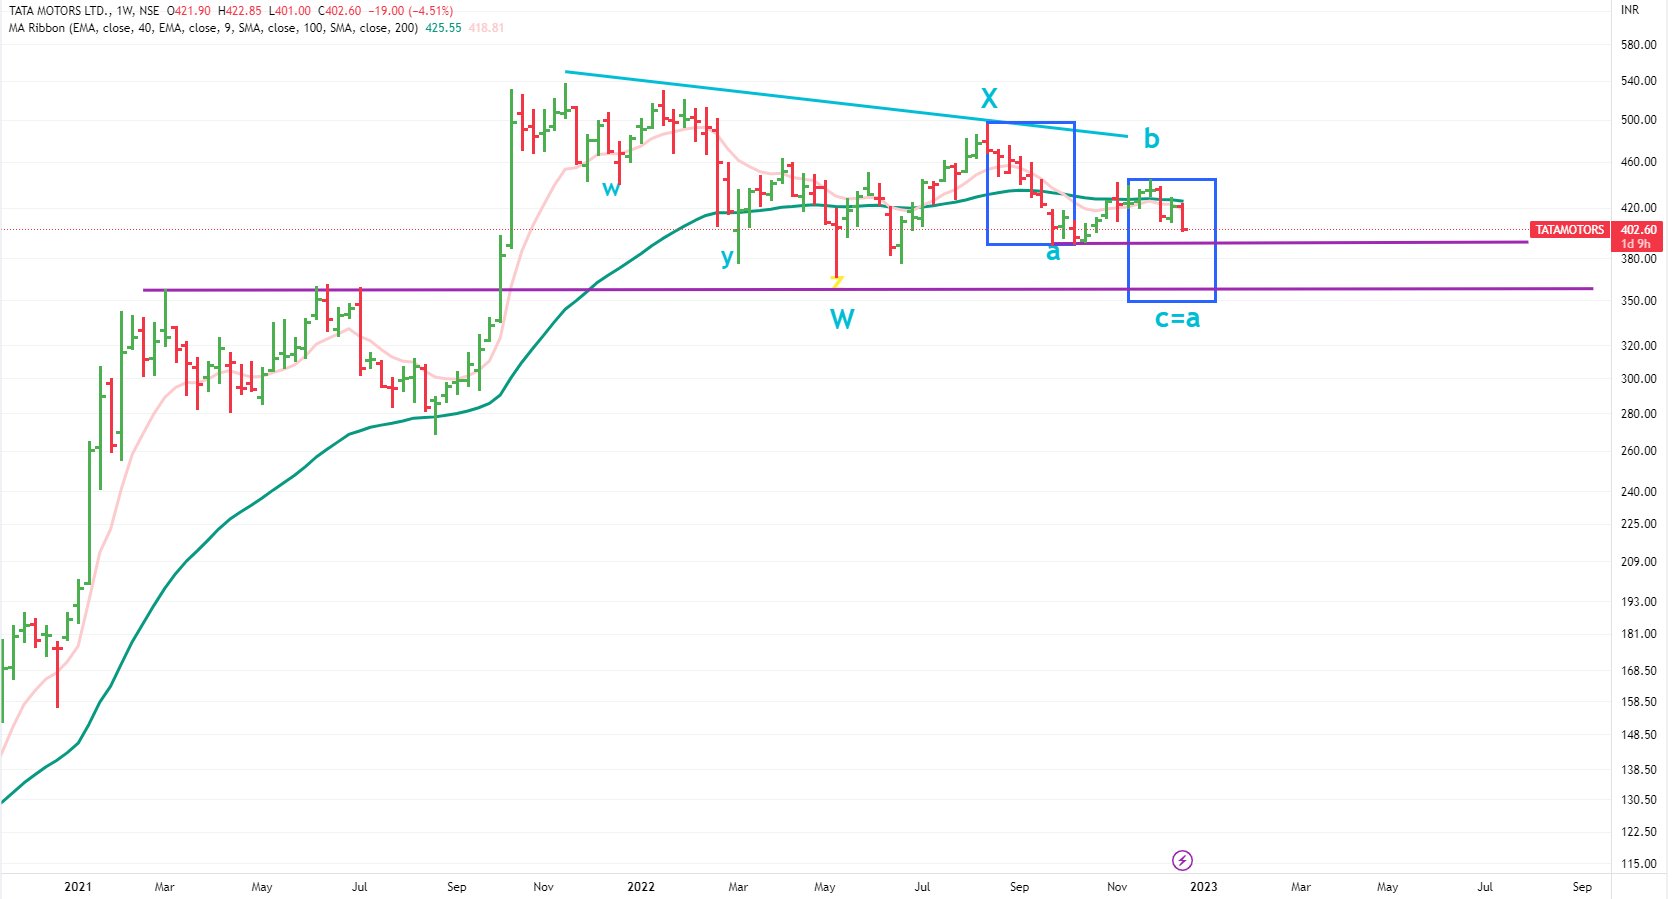
Tata Motors
CMP -403
It seems that it has entered Stage 4- has broken 40 WEMA very convincingly but let’s wait for the close below it on weekend ( expecting a small bounce in very very short term)
Daily.Weekly,Monthly -All MACD is sell zones and <60 RSI signifies the weakness in the chart.
If it goes on the projected journey as shown in the chart ,the following are the stop/support points and these need to be broken going forward :
a) 391 -October lows
b) 381-Lower weekly BB
c)366 -May low
d) C=A and that also coincides with 40 MMA.
And this possibility remains till it does not cross 428 on upside. If it crosses the same, time to review again.
Weekly Chart
Keep in consideration that it is a weekly chart. It might take weeks and months for the projections to play out (if they play out)
Market Update : We might get a temproary relief-rally today.
As per overall view, we feel that the market remains sell-on-rise till it is not able to cross/closes above 18697.
Disclaimer : These are personal views based on technical studies , can go very much wrong. No buy /sell recommendations.
No Follow-up Posts Now Onwards
As we had given lot of downward prices projections for several stocks, we won’t be putting any follow-up posts now ( no bragging ) as most of those projection levels are excpected to come in coming months.
Disclaimer : These are personal views based on technical studies , can go very much wrong. No buy /sell recommendations.
3rd Factor !
Success of many stock-market millionaires/billionaires of US can be attributed to -
What investors think :-
In reality, these 3 factors are:
Now interest rates are rising and all of so-called geniuses are losing money .
3rd factor is external , beyond anyone’s control .
Like luck , one can’t take it guaranteed
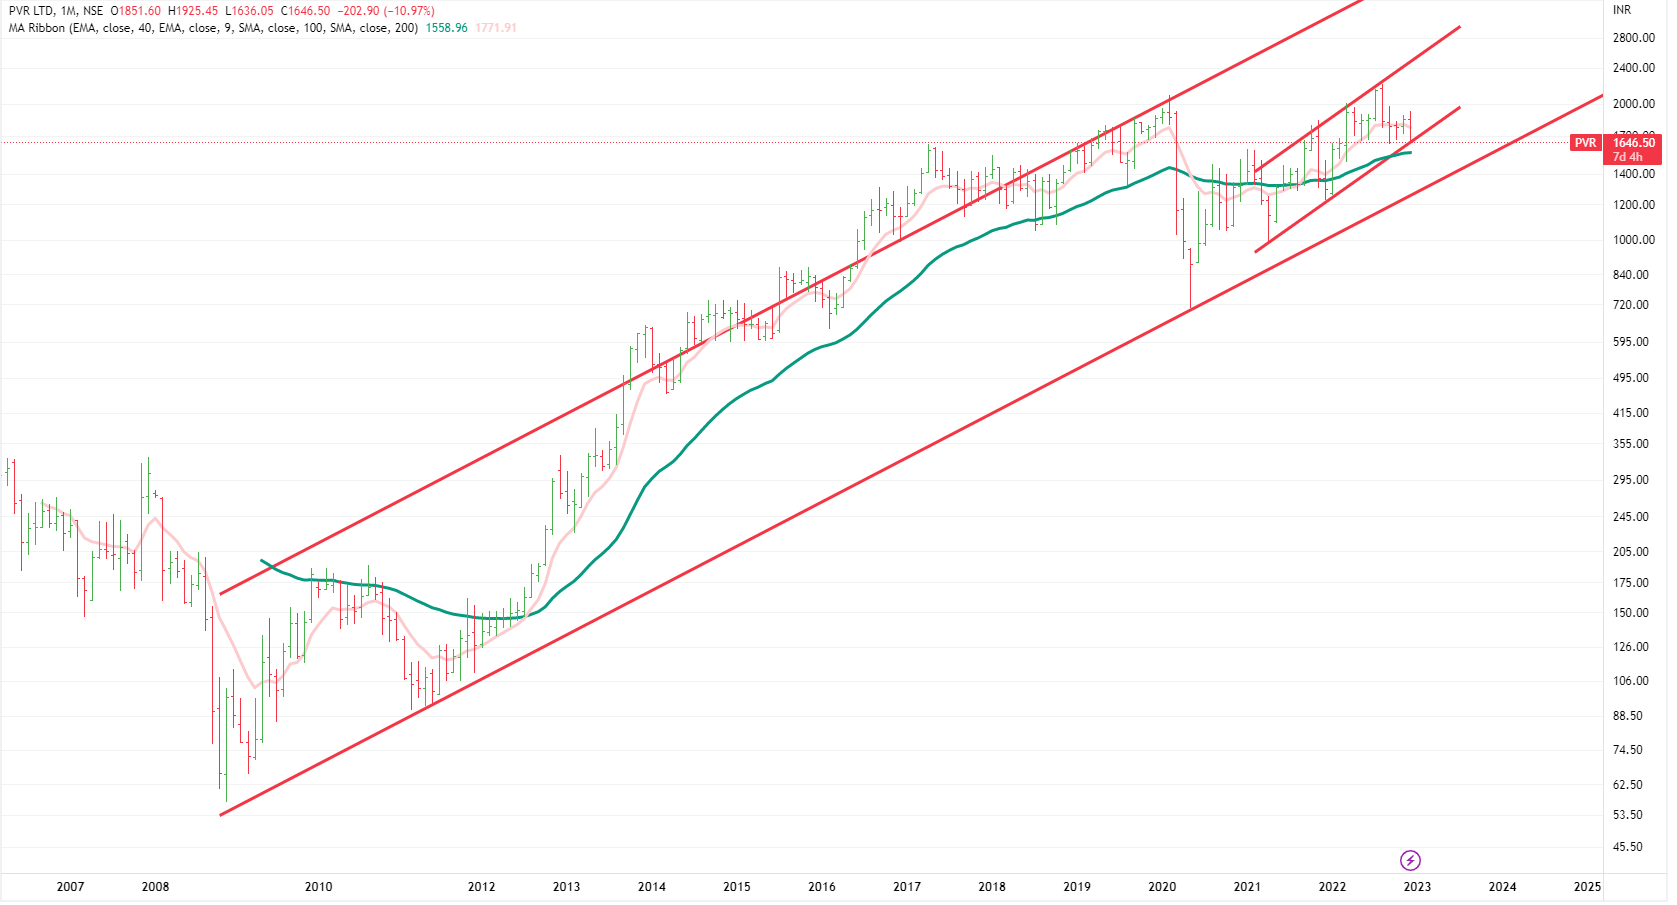
PVR
CMP 1650
Is the long term bull run is over !
Is it entering S4 ?
Today it is likely to close below 40 WMA ( today’s weekend ) and also broken a rising diagonal ( drawn from April lows).Has taken the support lower BB on weekly.
Let’s keep a close watch.
Daily,weekly, montly MACD are in sell mode.
Next support is 40 MMA at 1558, then comes the support of rising channel (near 1440-1450)that has been drawn from 2008.
Monthly Chart
Keep in consideration that montly chart projection takes an year or two to play out.(a short term bounce might happen in near term)
Let’s keep a track.
Disclaimer :This post is just for learning few methods of price-patterns. Views are personal. No buy/sell recommendations. These are probability study methods and chances of success/failure depend upon various factors
Tesla
CMP 109
It has achieved all the projected targets of the earlier posts. Now what ?
We started coverting it at 293. And in our worst case scenario , it should have stopped at 110. But it has now breached the same today.
Next levels to watch out for are 95 and 62.
Hello stage investing, views on equitas small finance bank and iifl finance?
Please check our 23 days old message.
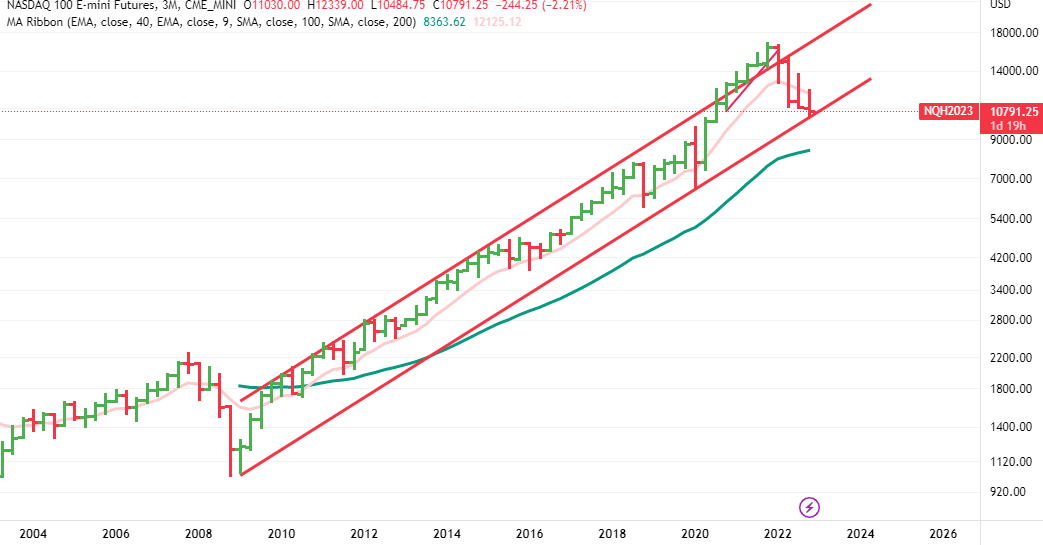
Nasdaq & FAANG Stocks
FAANG stocks have been the leaders in last few years rally in USA .
With 13 years bull run ending in tech-stocks,while all other FAANG stocks have corrected significantly, APPLE was holding its fort.
Nasdaq -Quarterly Chart
13 years bull run trend line is about to break.
But now we can see the cracks .Is it the turn for APPLE now ?
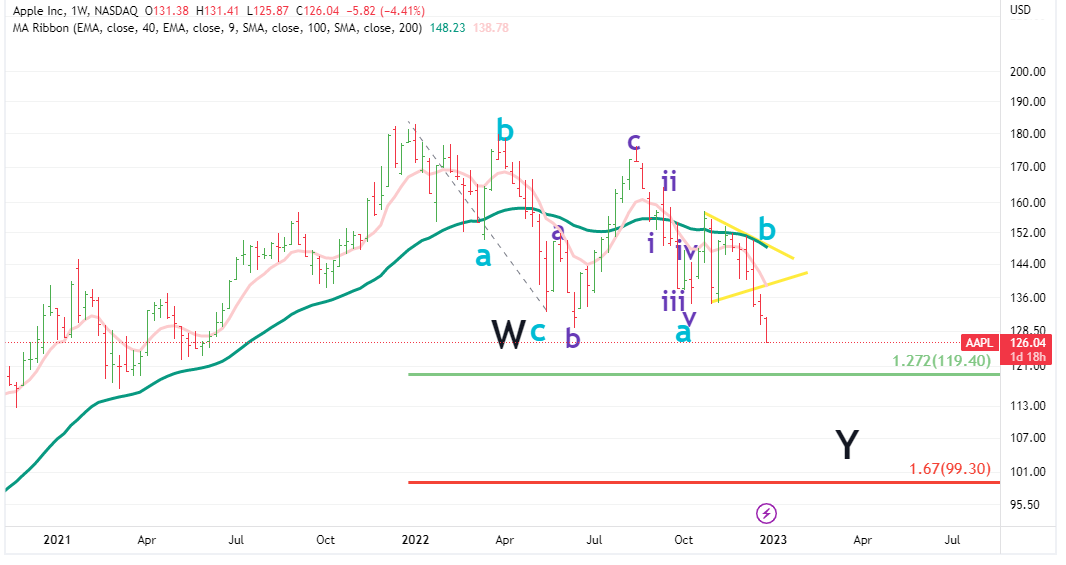
Apple
CMP 126
It has broken its October lows and there is not nearby support is visible.And it is already in S4 stage for months.
As per the weekly chart and EW ,next level can be 119 and if it does not stop there, we can see 100 on the tape.
Weekly Chart
Keep in consideration that weekly chart projection takes weeks/months to play out.
Disclaimer :This post is just for learning few methods of price-patterns. Views are personal. No buy/sell recommendations. These are probability study methods and chances of success/failure depend upon various factors.
Market Update
Indian markets have been resilient as compared to global markets despite all the macro tailwinds.
January may surprise us with some positive trend in the markets because of the following 3 factors
a) Budget expectations - this is a local event but expectations are always built up
b) China re-opening - while it might result in more worries about Covid-spread but opening up of China -economy may temporarily work as anti-dote to global recession-worries as unlocked public may lead to demand spurt as it was witnessed in other countries.
c) Global markets sell-off of December may pause a bit .Thus stable global sentiments may result in smooth sailing of the makets.
Looking at the above factors, it seems that we might have a 1000 points rally from here onwards ( we still believe that it would be a bear -market rally)
Disclaimer :We have all the rights to go wrong as no-one can predict the future exactly.
Appreciate your views.
We all come from different backgrounds and everyone looks at the data in different ways.Hence it is difficult to say who is wrong or who is right. That can be done only in hidsight. And even when we do results -analysis after the event is over, the results never tell whether the result came due to a good decision-making process or it was pure luck of events.
Let’s do where our conviction lies.
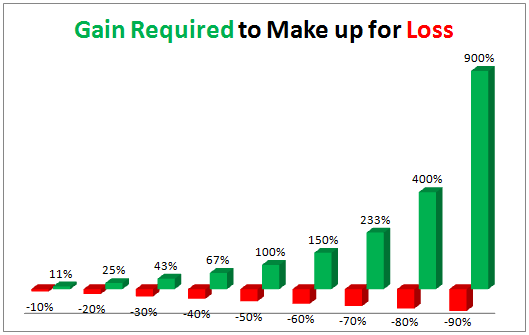
A good illustration of how much a stock has to recover after a loss to get back to even.
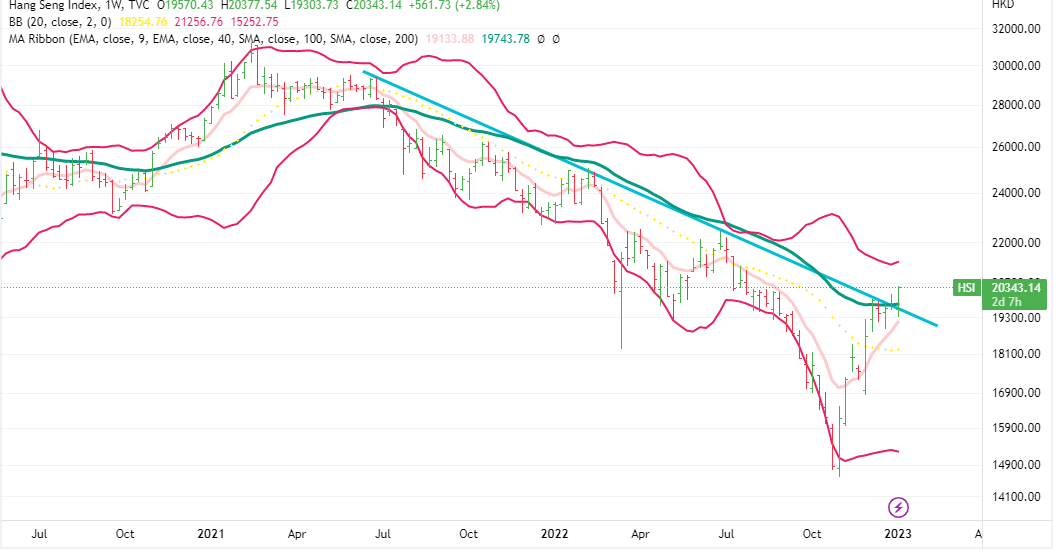
HanSeng Index
It has rallied close to 40% in last one month. Whereas Brazil, Japan ,Korea indices have lost >10% in last one month.
Hang Seng Index -Is it China re-opening trade ?
But Shanghai Composite Index not giving clear signals of a bull run.
It seems that Hang Seng index mainly consists of China tech compnies and that have lost most of the value in last few months and now some recovery is happening.
Weekly Chart
HSI has crossed over 40 WMA as well as has broken out of last 10 months falling trend-line.
Daily,Weekly, Monthly MACD are in buy zones .
It is important to keep a close watch on China. While US and Europe are near recession zones, China re-opening can help the global demand to remain in positive zone .
Seems that Nifty is struggling …only hope is budget. Otherwise big downtrend is on.