
Dear Sir,
Request you to please provide your study on Welspun Corp and Canara bank please
Karnatka Bank
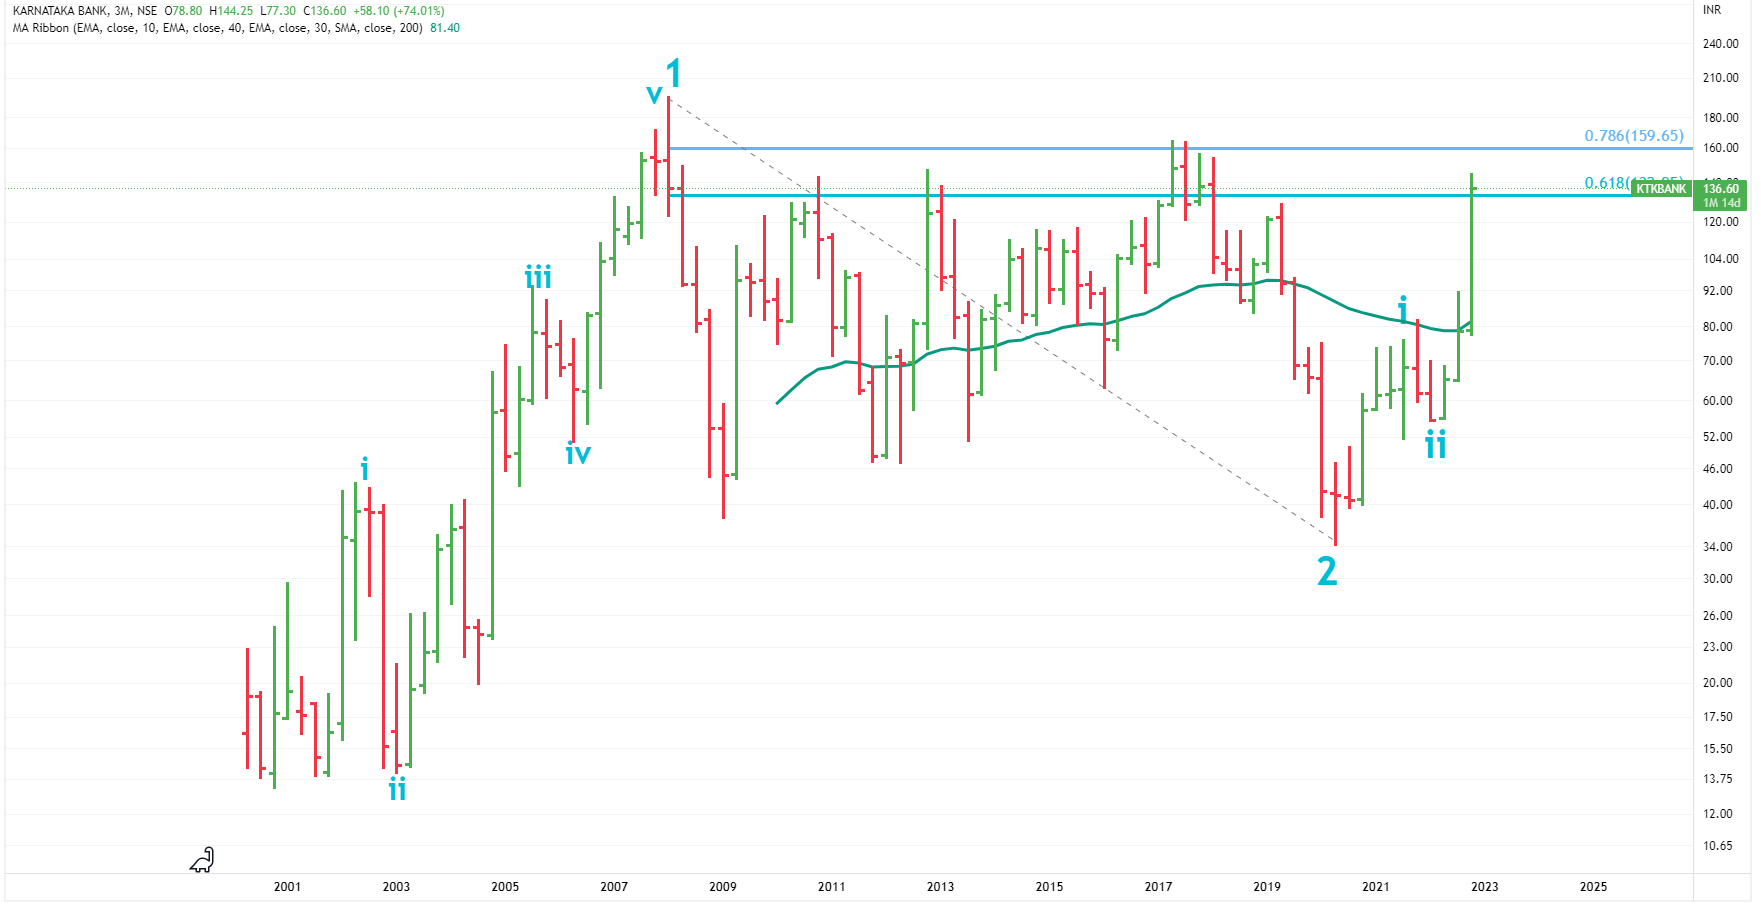
As you seem to be a very long term investor, we looked at the quarterly charts.Monthly and quarterly charts are for very long term investors who can hld for years and decades and stories of these charts play out on a very large time-frame.
Stock seems to be in wave 3 on a larger scale and a long way to go.It was in correction zone for many years (2008 onwards)
You might see some correction in shorter term, then at 160/180/210 levels.
120-125 should act as strong support.
Quarterly Chart
On monthly charts , it seems to be iii of minor 3rd wave. Seems to be little extended, may give some correction in coming weeks.But overall story remians intact.
Monthly Chart

Happy holding.
Disclaimer :This post is just for learning few methods of price-patterns. Views are personal. No buy/sell recommendations. These are probability study methods and chances of success/failure depend upon various factors
2 Likes
Canara Bank
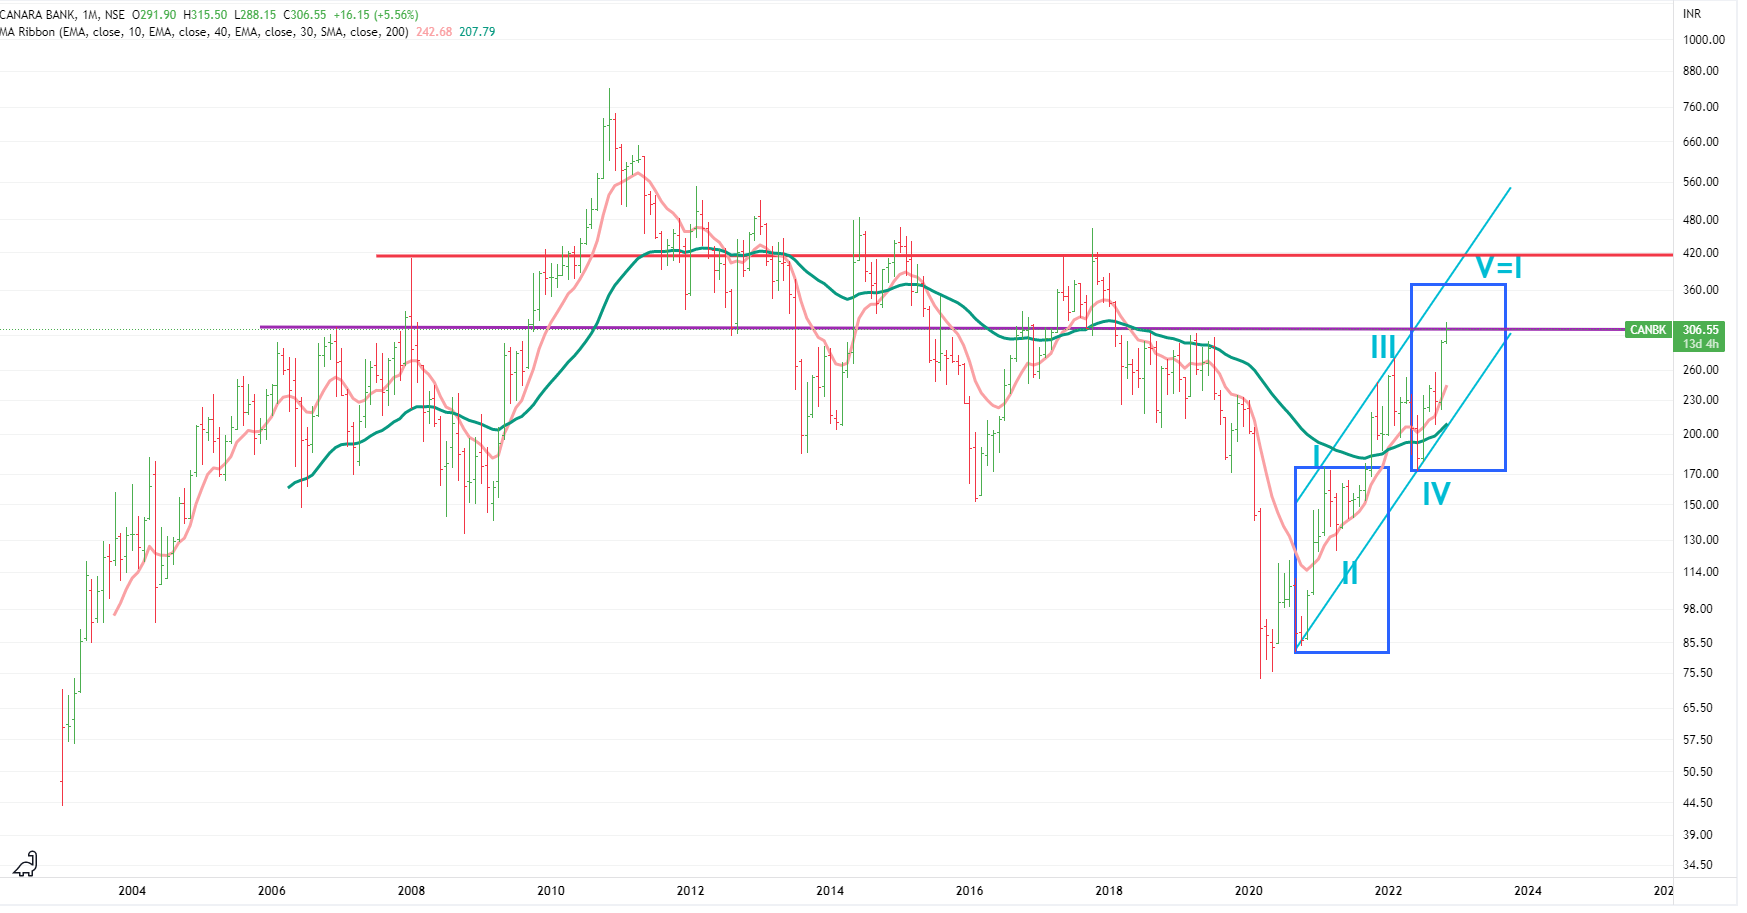
Currently we’re in Vth wave of fresh impulse that started in May of 2020.
Let’s first look at the bigger,longer time-frame picture from the monthly chart .
As per EW ,two waves out of three upside waves (1st, 3rd and 5 th) are supposed to be same length.
In this case, it seems that wave I and wave III were of same length. So wave Vth can extend i.e. it can be bigger than Ist and IIIrd wave.
If we take I and V equal ,the target comes near 360-370. But if consider extension, it can go upto 400-410 . That also happens to be near the upper end of the rising channel as well as a storng resistance can be seen near those levels (red line ).
Once it completes this comple wave then bigger correction would set-in.
Monthly Chart
In short term-
We happen to be in a congestion zone between 290 to 315 (purple line ). If the overall market starts correcting ,then it can linger in this range . Also stock has moved very fast in recent past, hence it needs to take a pause (time-correction) before it starts its next leg.
Welspun Corp -we already shared it in the past. Please check the thread.
Disclaimer :This post is just for learning few methods of price-patterns. Views are personal. No buy/sell recommendations. These are probability study methods and chances of success/failure depend upon various factors
2 Likes
Any update on Union Bank of India please
Like all other PSU bank stocks, this one also has moved .
Can keep moving higher in medium ot longer term Near term resistance on upside are 85-87/ 100-110 and on downside ,support is 53-55.
But we don’t like the structure here and if we were you, we would shift to some other bank-stock if we want to remain in this sector.
1 Like
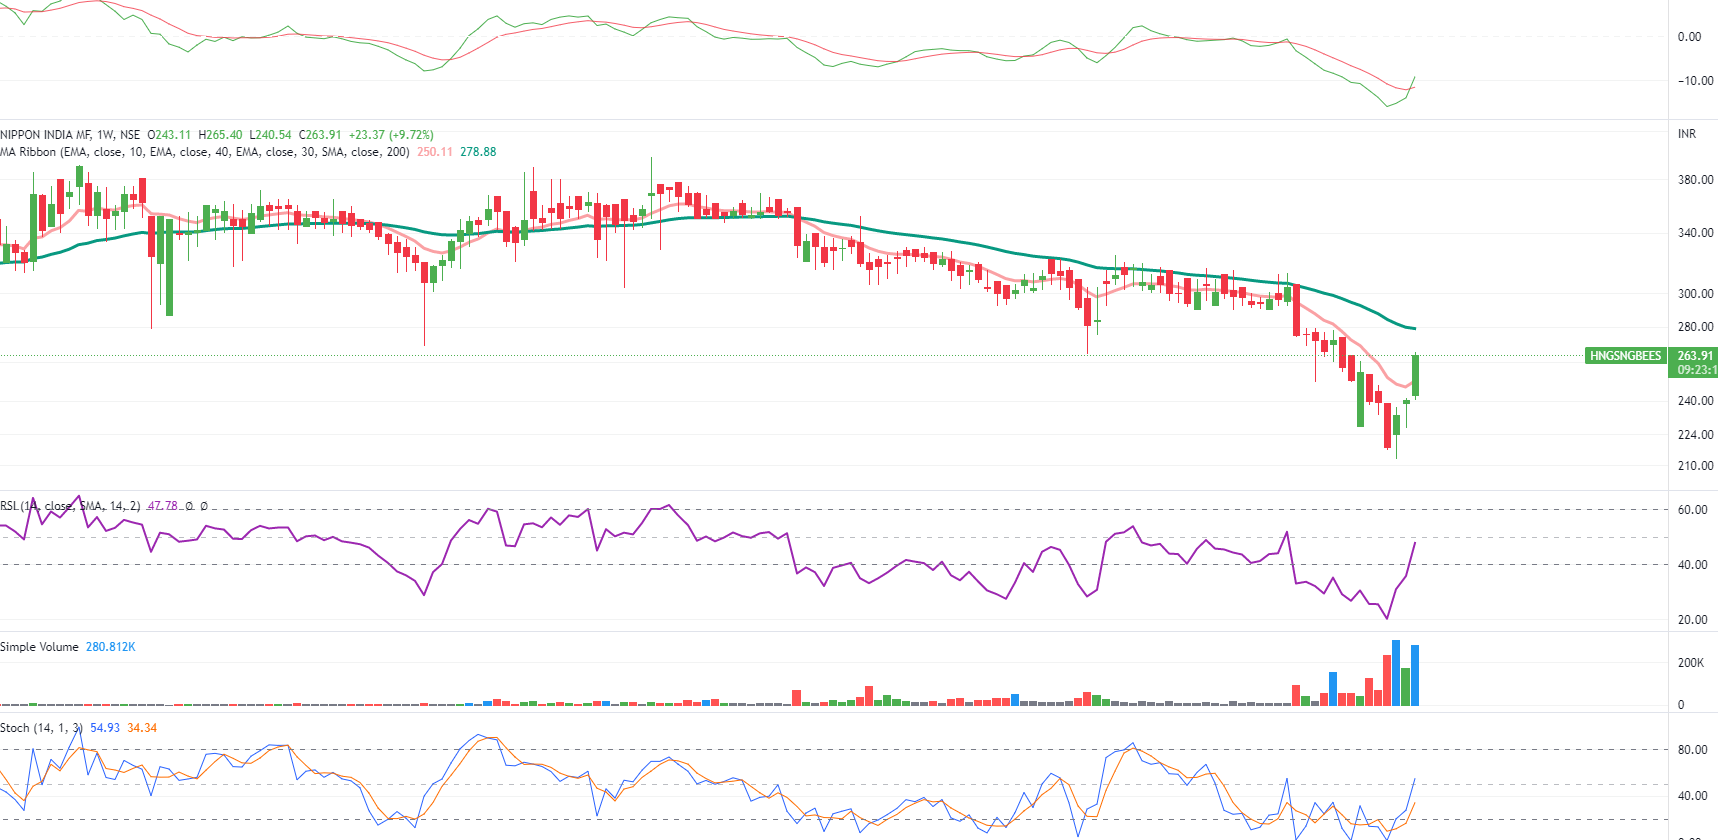
Nippon India Hangseng Bees
CMP 263
An ETF for Chinese stocks.
It is up 25% in last 3 weeks.
Next resistance is near 279. If it closes above that for few weeks, this would another confirmation.Need to be very sure for anything Chinese ![]()
Like they say, there’s always a bull market somewhere.
Weekly Chart.
Disclaimer : Charts are for study purpose only. No recommendations.
2 Likes
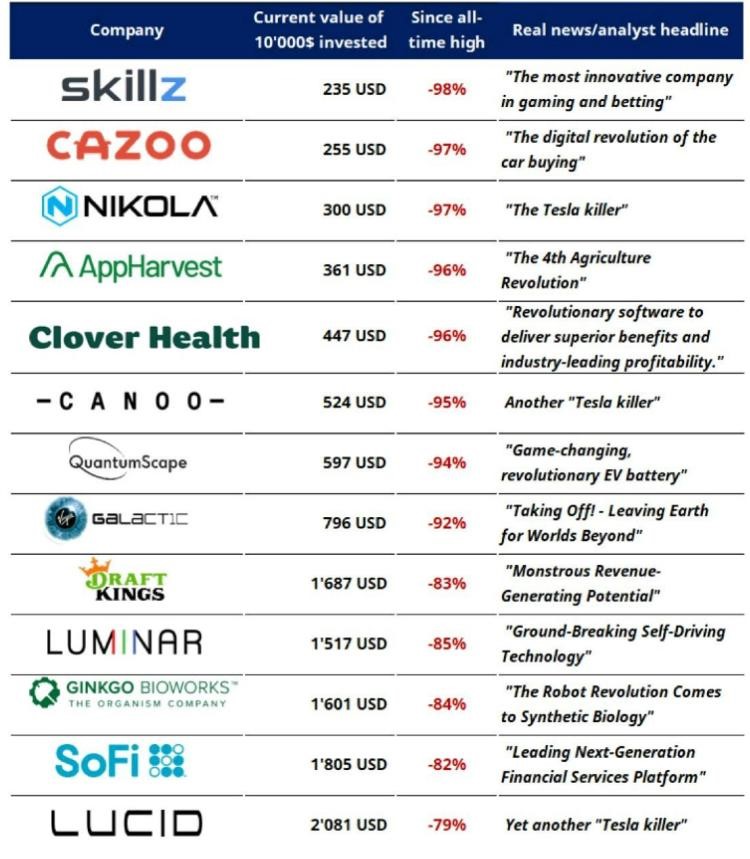
Importance of Stories
Like we say that stock price is a combination of various elements - stories are one of these elements.
Stories drive sentiments and sentiments drive the prices up as well as down.

Here is a re-cap of few stories that were built-up in 2021 bull run in US and the investors who belived in these stories are paying badly .
Anther lesson here is on averaging -down. Try to avoid averaging -down if you’re stuck in a stock, you don’t know the bottom.
6 Likes
Hello
This rally in Mahindra CIE fizzle out, now its hovering around 50DMA. Any thoughts ?
Need to extra careful as overall market is correcting .But stock still seems ok. Took support at 20 WMA and now it might close above 20 DMA today.
But be careful , market sentiments need to imporve for it to move.
For a decent progress in stages , the following are key elements :
a) Market sentimets
b)Sector sentiments
c)Volumes
d) Lesser left side resistance on the chart
3 Likes
As per structure, it does not give confidence.
Short term ,it can move up .
But for long term , we would like till it closes above 290/315 for few days.
As far as the rollback is concerned, it might not affect the margins as currently international prices are lower than domestic prices.
1 Like
Dear Sir,
Request you to please provide your study on Tata power and Federal bank please
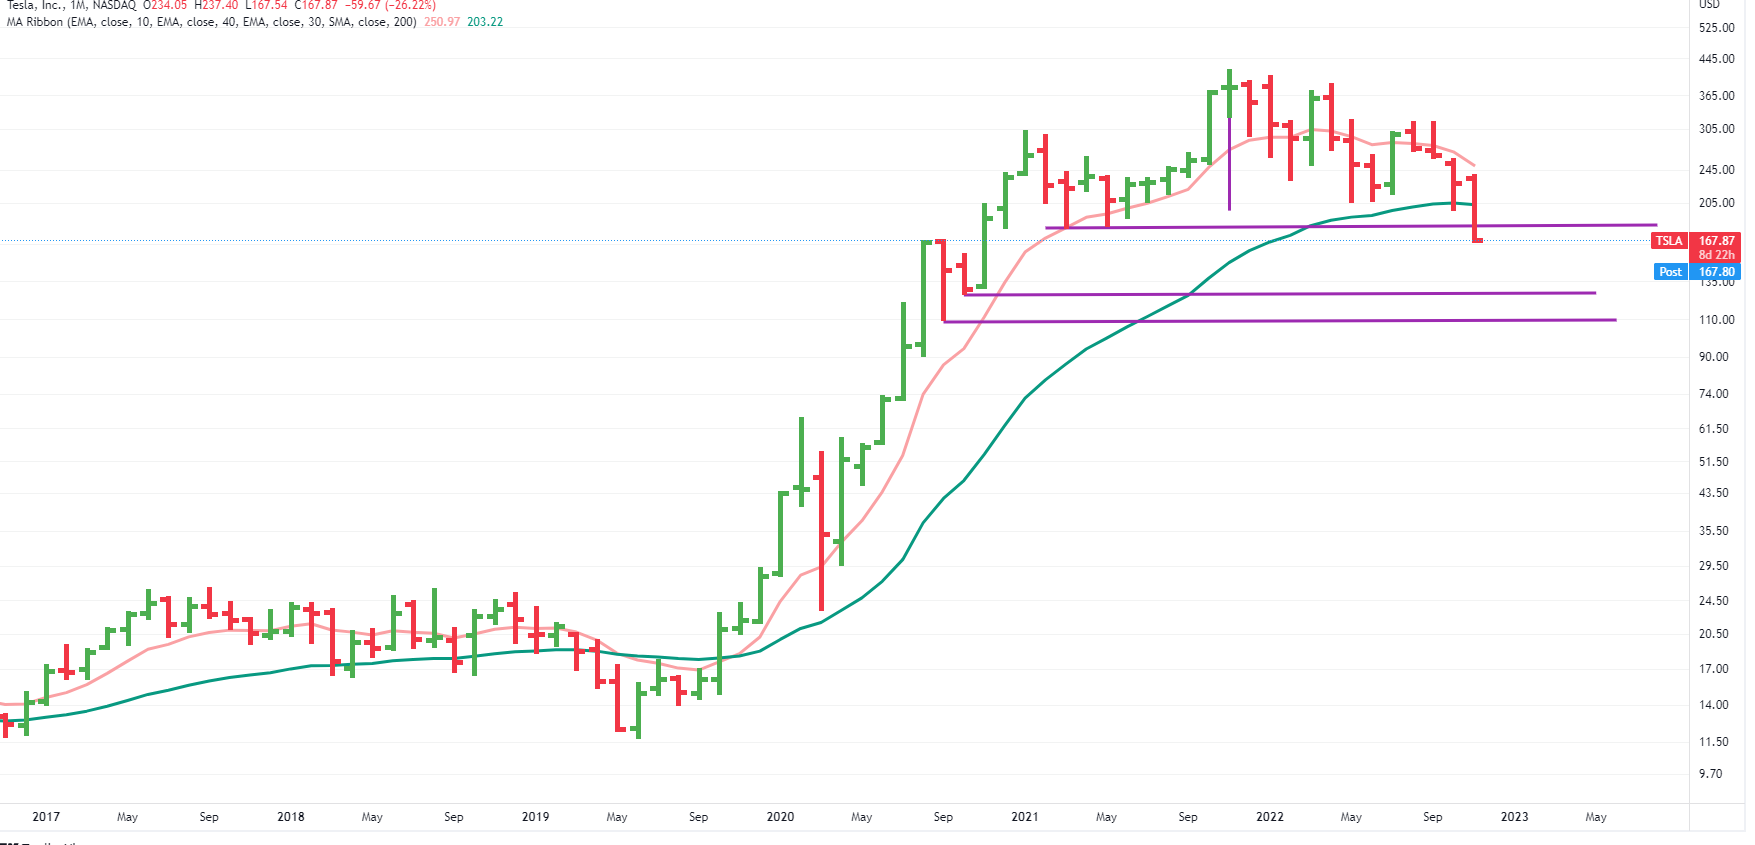
Tesla -Follow-up
CMP-167
We statrted covering this from 293 levels.
It is beautifully meeting all the targets.
It seems that the drawdown may continue.
If this continues, what is the next target ?
Well, sanely speaking -first stop can be near 127-130. And if it is still in mood, it can go 110.
Monthly Chart
Insanely speaking - it has a Head and Shoulders pattern on monthly!
As per this, it go below 50 .
Currently it seems like a stupid impagination. But lt there’s no fees or loss in imagining things, that’s why mentioning it.
Monthly Chart
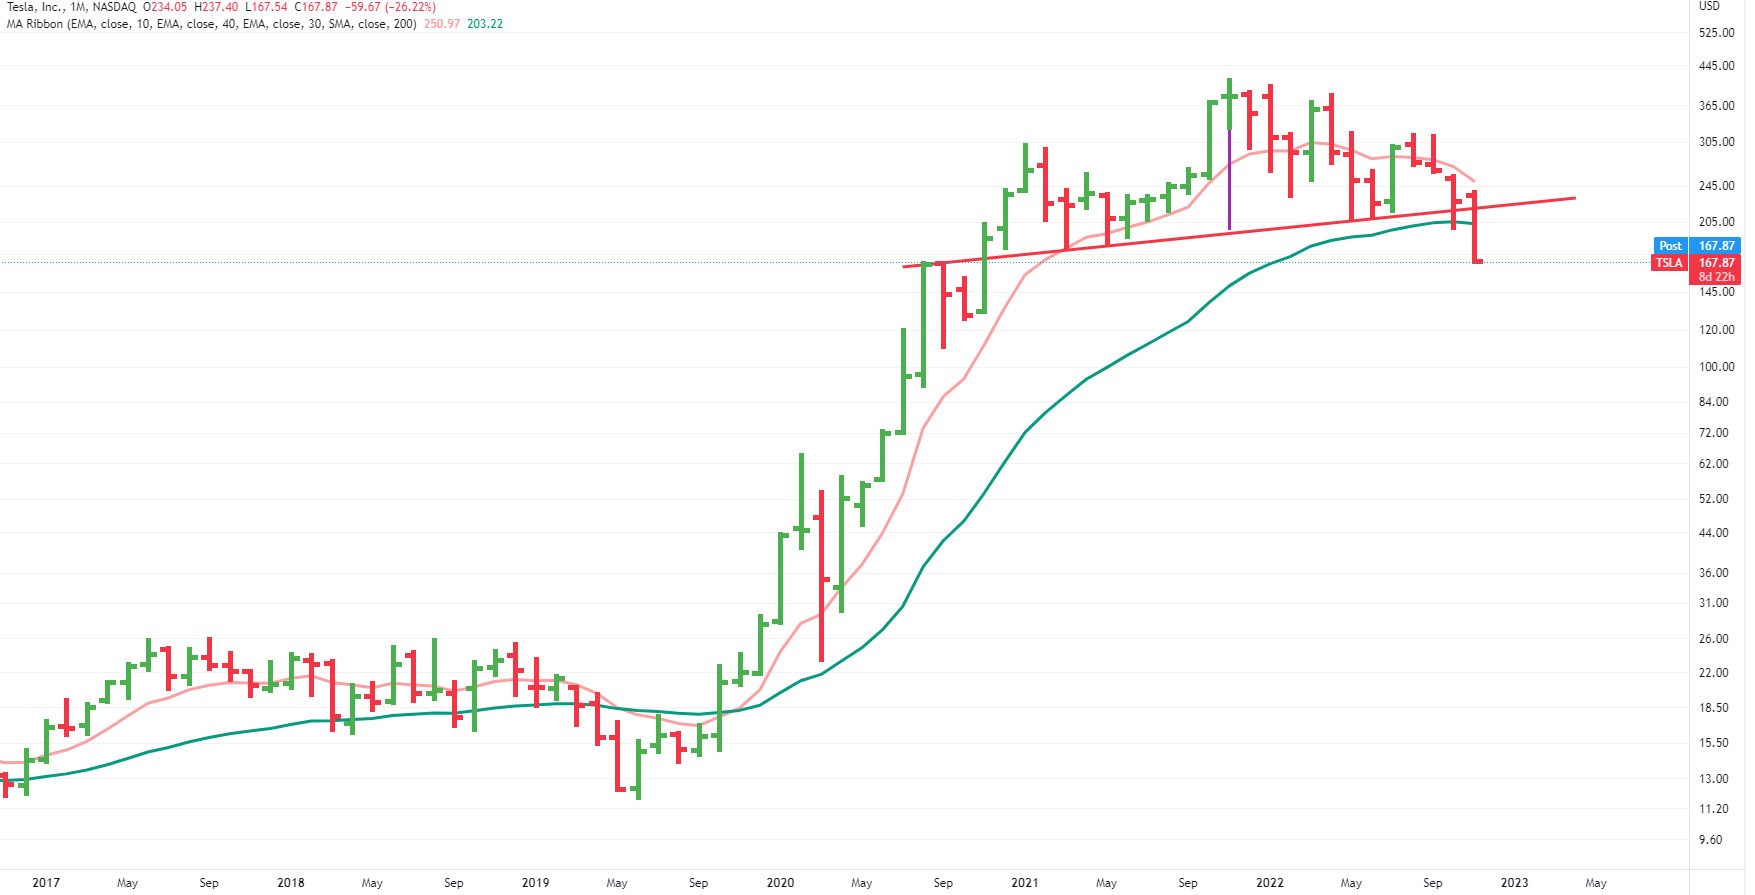
Keep in consideration that it is monthly chart, the things play out in months and year.
Disclaimer :This post is just a for learning a method. Views are personal. No buy/sell recommendations. These are probability study methods and chances of success depend upon various factors.
1 Like
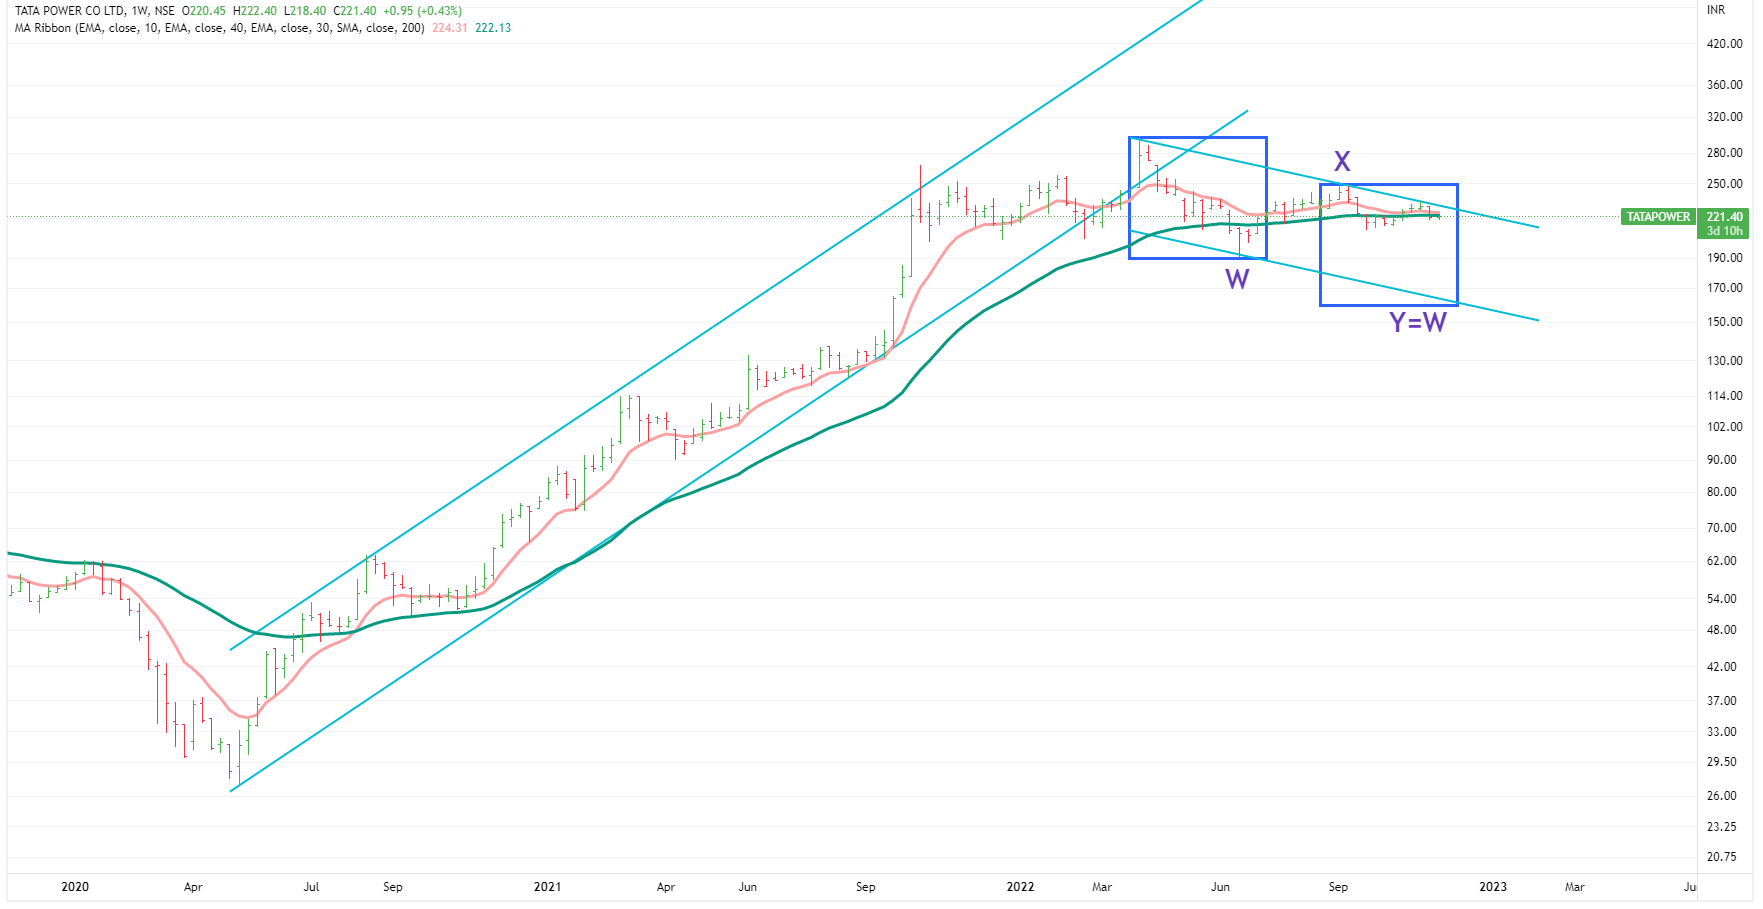
Tata Power
CMP- 221
Well this came out of consolidation after 12 years ( from 2008 to 2020 it was in a correction zone ) . It sarted new wave in March 2020 ( wave 1 of fresh wave) and became > 10 X in less than 2 years.
Now it is doing its price and time -correction since January 2022 in wave 2.
Long run it is bullish as when wave 3rd will start ,then it would move very fast and can again become a multibagger.
But we plan to enter fresh, we need to wait for the end of wave 2 and that wait can go for many weeks and months.
One of the likely scenario if the market conditions remain choppy.
Weekly Chart
It might be now in wave Y . If this is true ,then it may go near 160 in coming months.
At 160 level , Y=W and it is also the lower end of the falling channel.
On monthly chart, MACD is in sell mode and 40 week moving average is also near 160 (40 MMA ) and that can act as strong support .
Apart from that, 161 is also the level of 50% FIB retracement of the whole rise since March 2020 . Strong stock tend to stop at that level.
Montly Chart
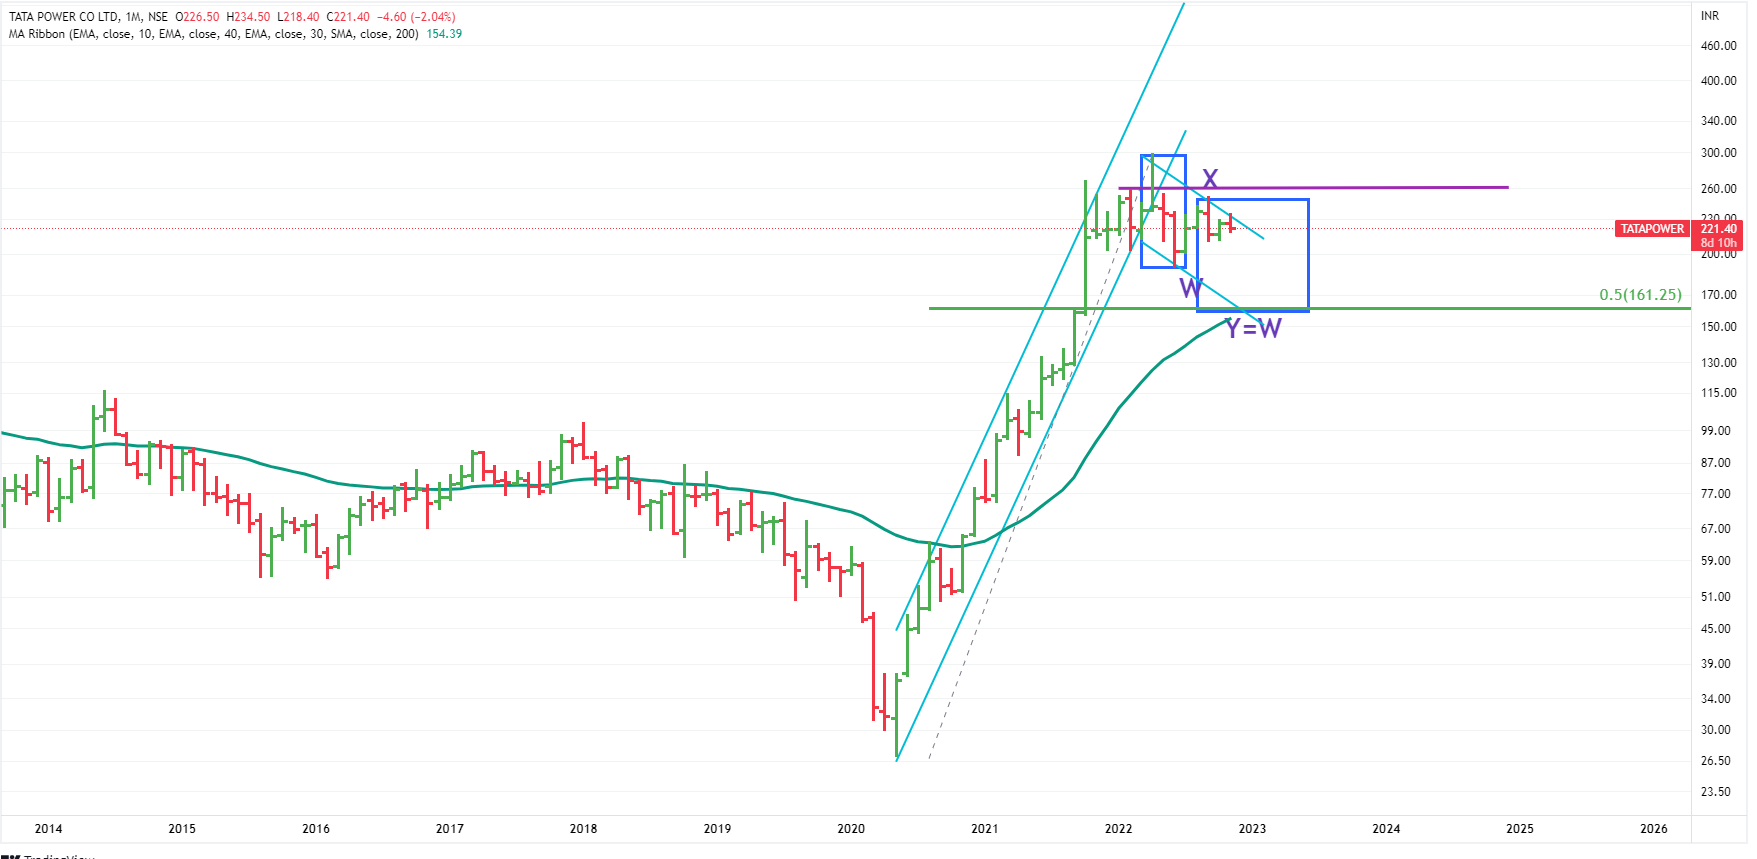
The above mentioned scenario would get cancelled if the stock and market turns around towards upside and the price closes above 260 for few weeks.
Keep in consideration, these are weekly/montly charts, the likely scenario would take months to play out.
Disclaimer :This post is just for learning one of the few methods of price-patterns. Views are personal. No buy/sell recommendations. These are probability study methods and chances of success/failure depend upon various factors
1 Like
Federal Bank
CMP 132
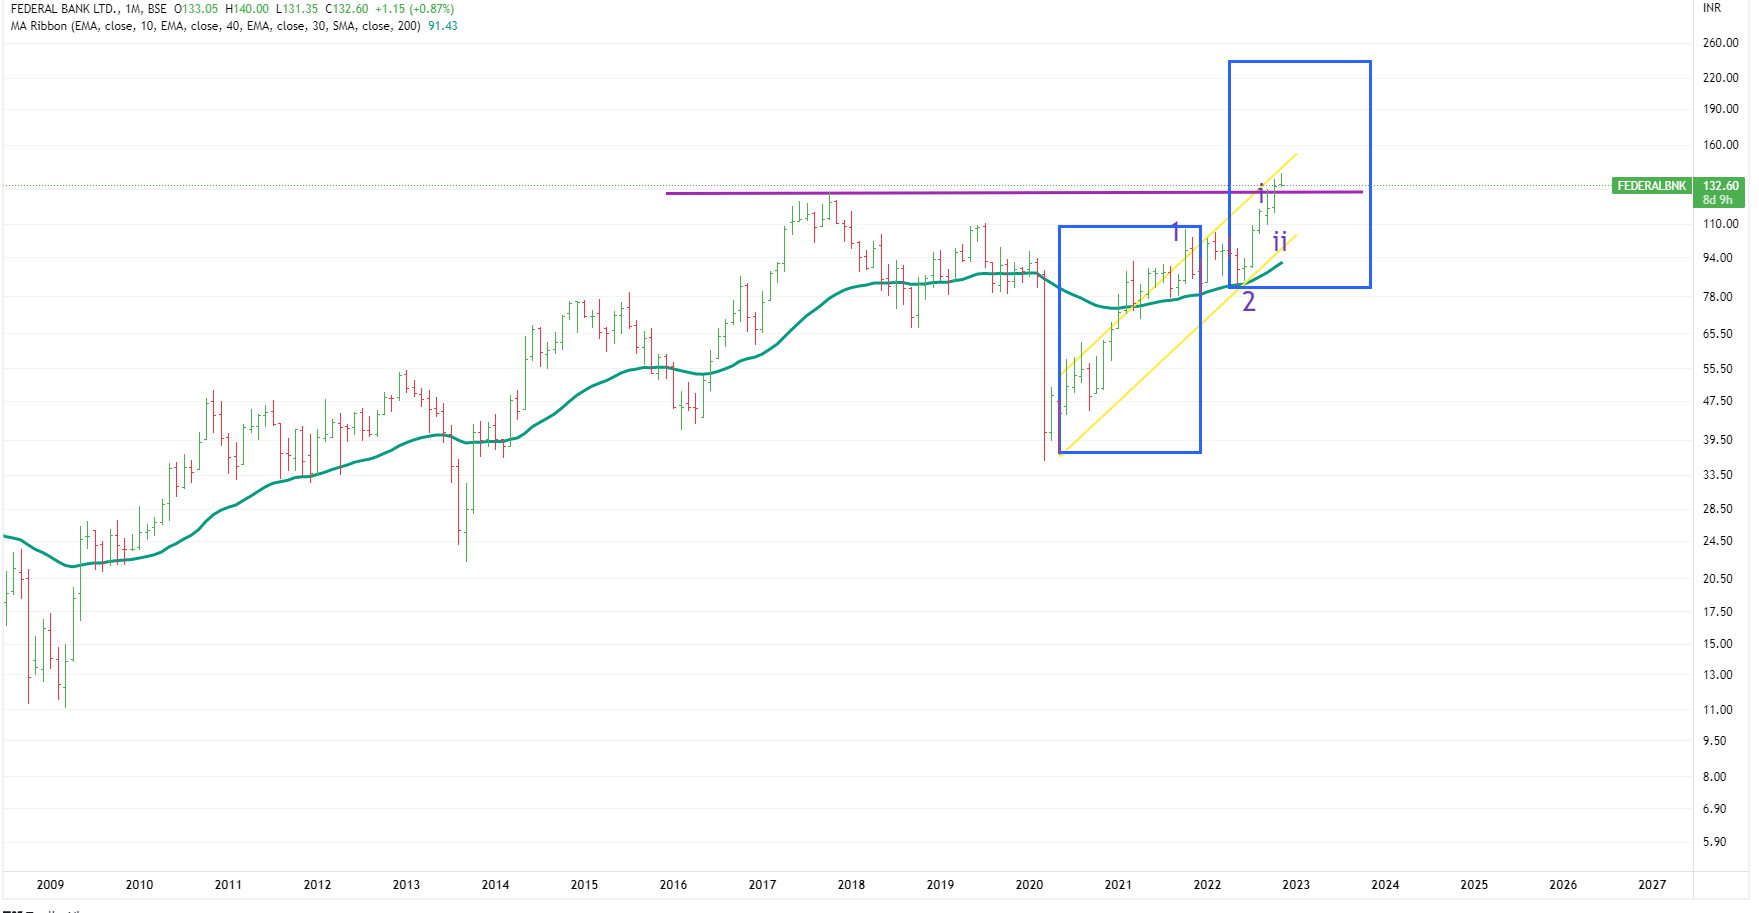
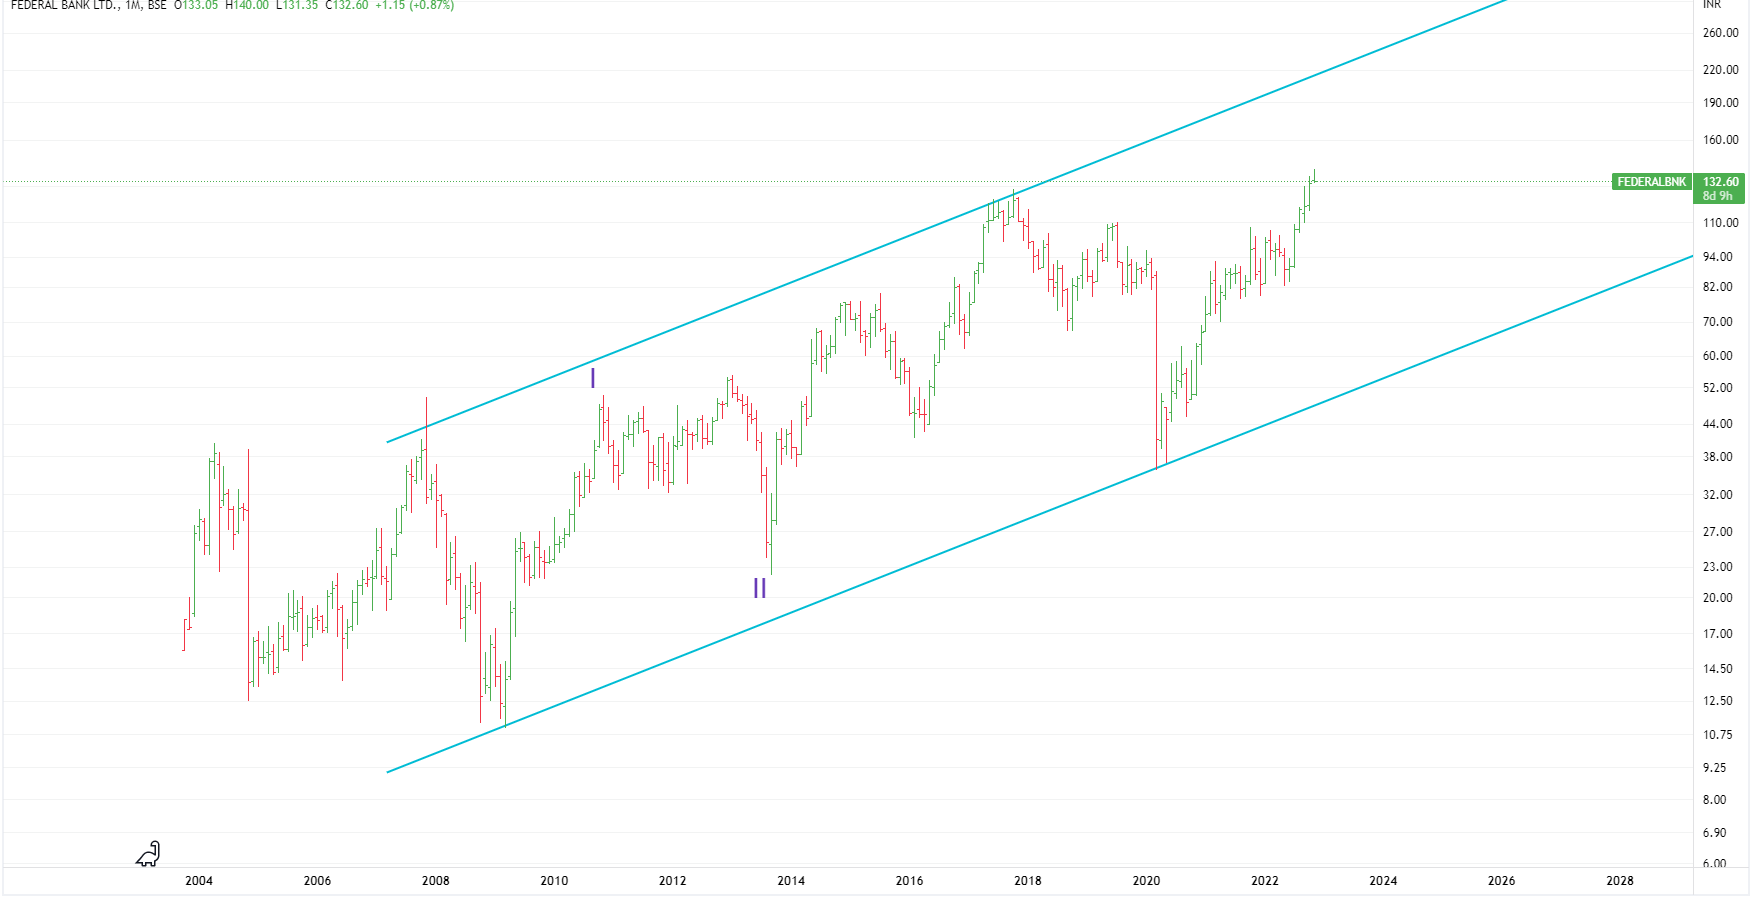
It seems buliish in longer term - 1-2 years like many of other banking stocks. Monthly MACD is in buy area.
It started a fresh wave in March 2020 and now it seems to be in 3rd wave of this fresh beginning since 2020.
Medium to term target seems to be in the zone of 220 -240. That is the level of equality of wave 1 and wave 3 and that is also upper end of the rising channel.
Monthly charts
In shorter time frame, if seems weaker than others and is correcting a bit. Daily and Weekly MACD are in sell zone.
It has a support in between at 130 area . But if overall market becomes weak, it can correct somewhere upto 110-120 zone.
Weekly Chart
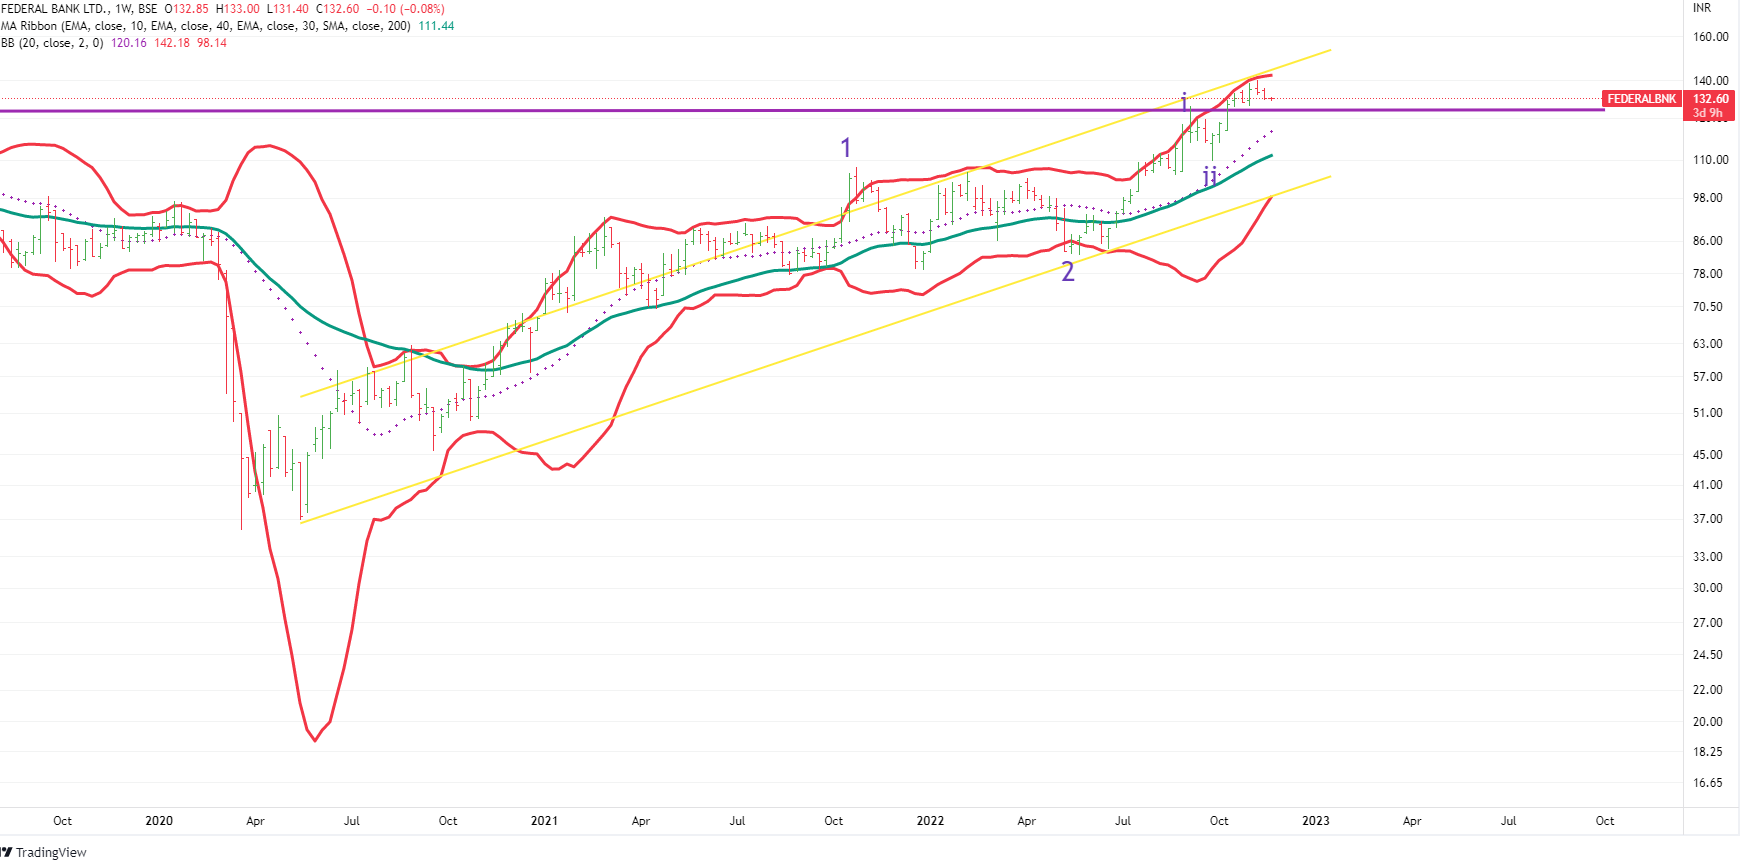
If it goes and closes above 140 , then correction levels would change.
Keep in consideration, these are weekly/montly charts, the likely scenario would take months to play out.
Disclaimer :This post is just for learning one of the few methods of price-patterns. Views are personal. No buy/sell recommendations. These are probability study methods and chances of success/failure depend upon various factors
2 Likes
Thanks for your views Sir.
Can you provide what do technicals say about future courses for medium/long term. Unable to understand the charts as it’s trying to break the WMA but the time period in the stages was very short.
Also, any views on Mindtree charts too would be helpful. Thanks again.
Sir Can you look at Lincoln Pharma Limited? for short term and medium perspective view. I am accumulating it from April onwards. Investing for the next 5 to 7 years though
Dear Sir,
Thanks for your views
Request you to please provide your study on Shree Digvijay cement and NMDC please
LTI
Please check the said comments 8 days back in the related post.
The condition is that it should not break the lower purple line ie near 4900-5000. (in very short term, we might need to be extra watchful)
It broke these levls in next 2 days and is now on a downward journey.
Have a look at the weekly chart .
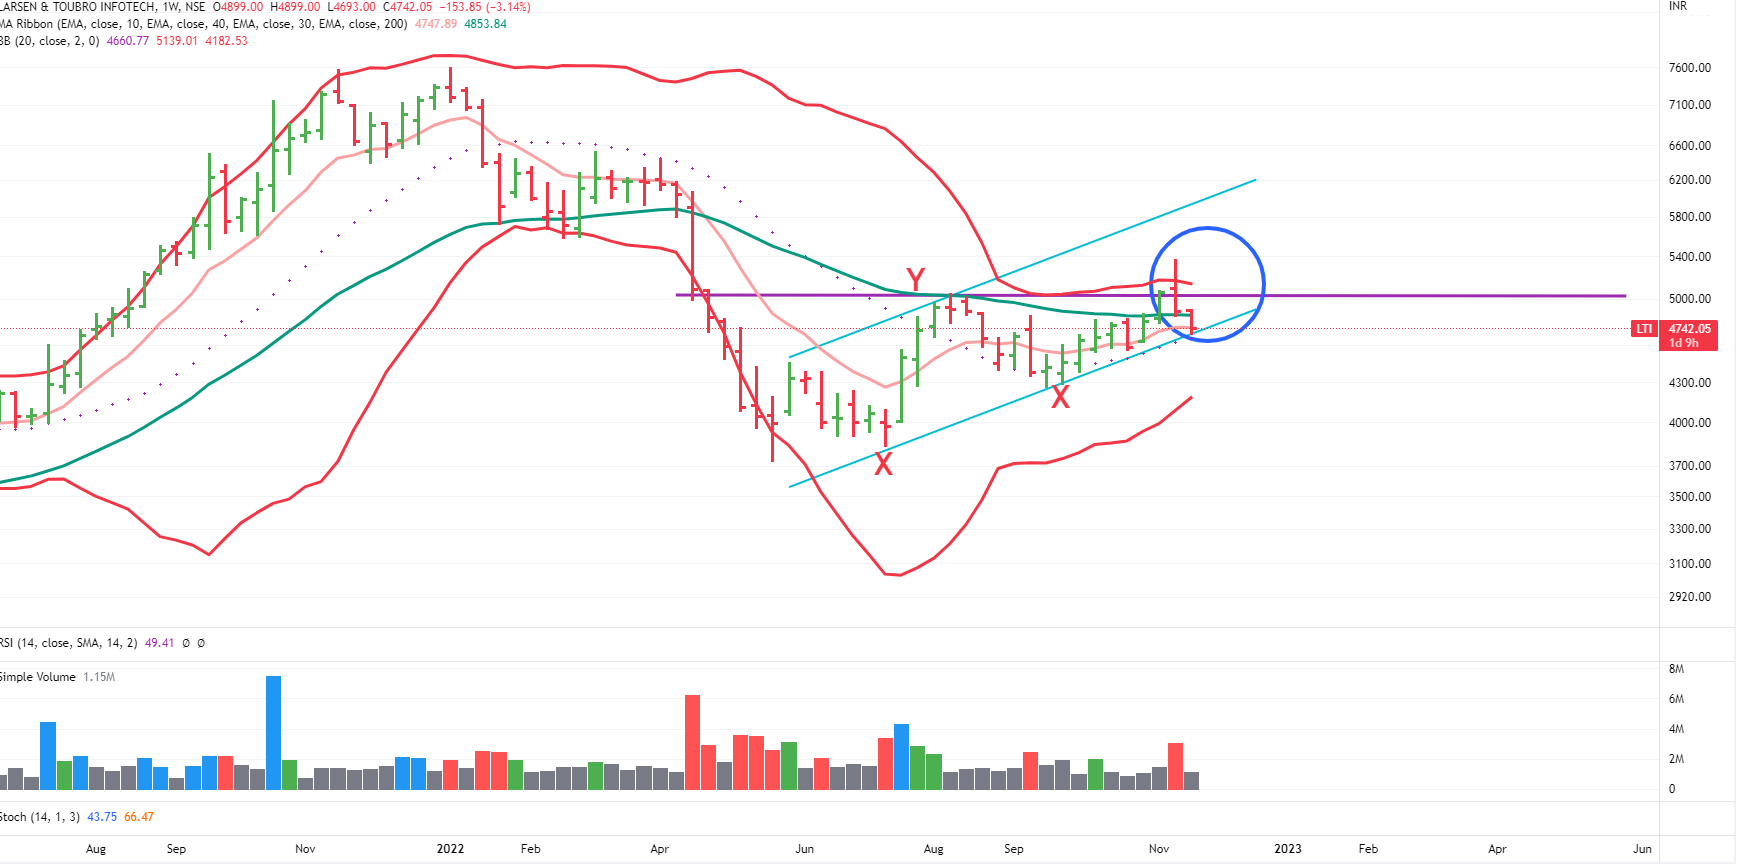
The candles in blue circle are very discouraging candles. These are known as effort-to-move -down bars. Now untill the price crossess and closes above the top of these bars, it would not go up i.e. 4910 and 5360 are very big resitance points on the upside.
But let’s not think about the upside now as charts don’t indicate nay significant upside (except a temporay bounce near 4820-4850 in best case)
On downside, we’re very near the lower side of rising channel as well as 20 WMA (4660) . If we break and close below these levels - then we can see a breakdown .
The levels can be any depending on the market situation.In short, if we were at your place,we would currently stay away from this stock till the time it does not cross at least 40 WMA and then top of the effort-to-move-down bar with volumes.
Disclaimer :This post is just for learning few methods of price-patterns. Views are personal. No buy/sell recommendations. These are probability study methods and chances of success/failure depend upon various factors
3 Likes
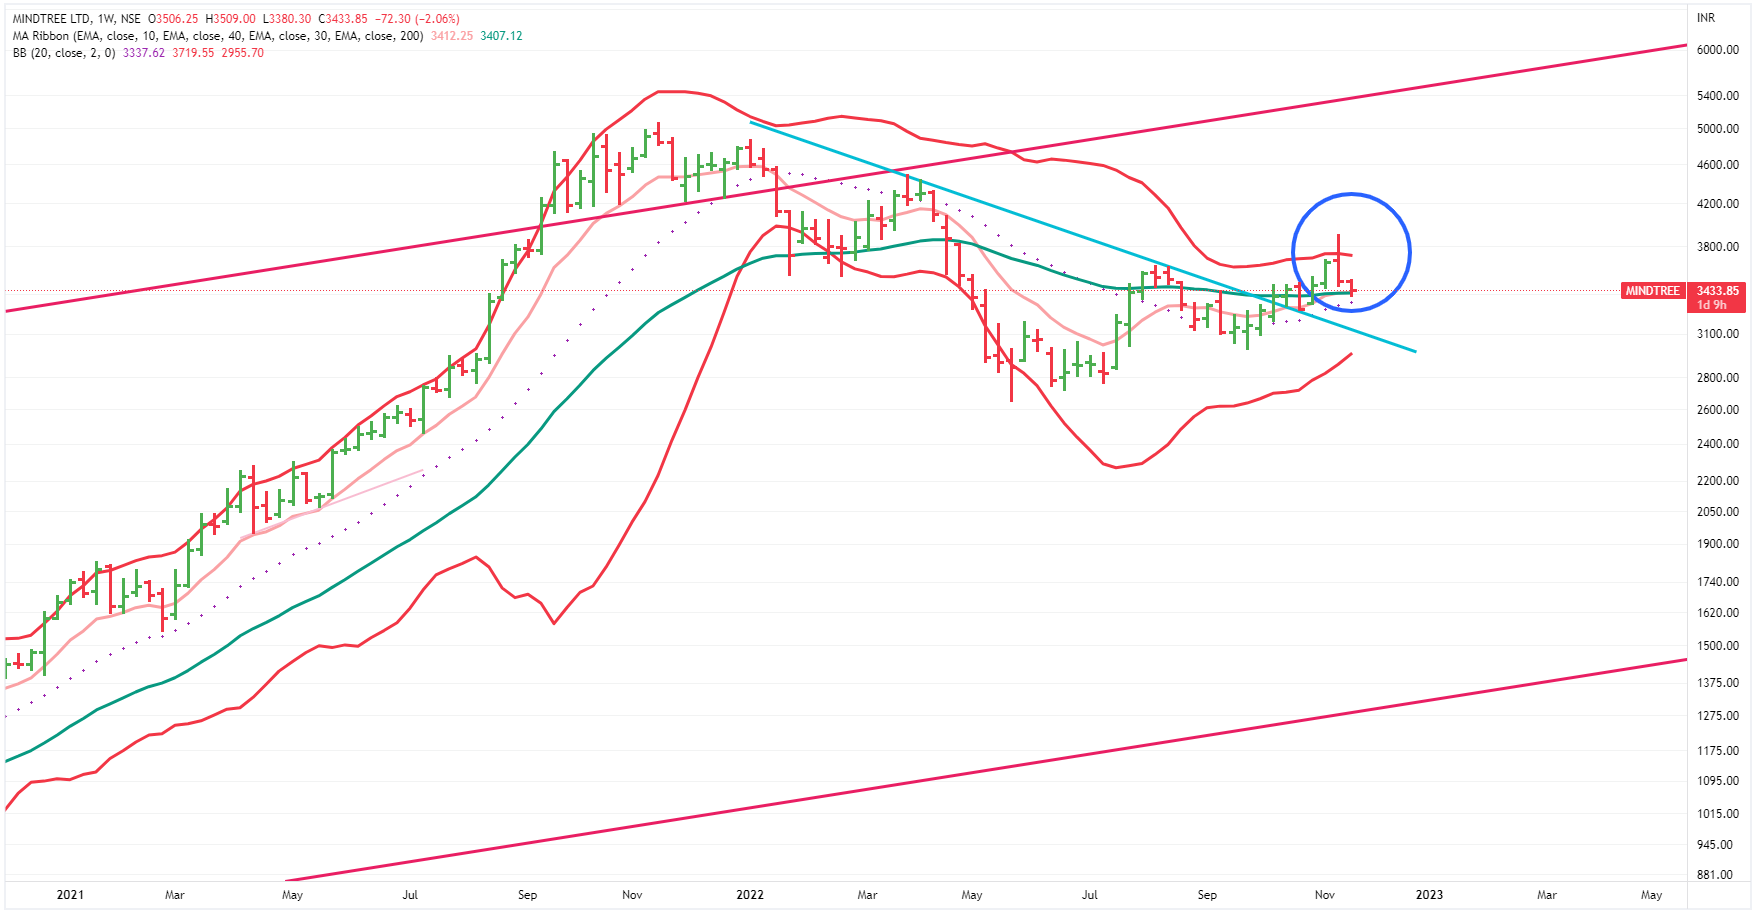
Mindtree
CMP -3500
Although we like the valuation for the same but technically it still remains week.
Similar to LTI , it has made a really bad bar last week ( in blue circle) and that too with heavy volume. Hence top of this bar becomes a major resistance in coming weeks ( i.e. 3900)
A small bounce back can be expected but may be limited upto 3525/3625.
Currently is just sitting on the verge of 20 WMA and 40 WMA.
After a small bounce, it is expected to go to 3275 in coming weeks and if it breaks the same ,let’s expect it to go to 3000 and 2700 depending upon the market conditions.
In short, if we were at your place - as an investor we would like to stay away from this till it gives a clear break of trading range in Stage 2.
Weekly Chart
Disclaimer :This post is just for learning few methods of price-patterns. Views are personal. No buy/sell recommendations. These are probability study methods and chances of success/failure depend upon various factors
2 Likes
NMDC
We like the stock from valuation prespective .
But due to demerger, we are treating it as a new company hence can’t comment much on the chart ( for chart reading, one needs good history ) .
Only one thing we can say that in short time frame, it has a strong resistance at 124.
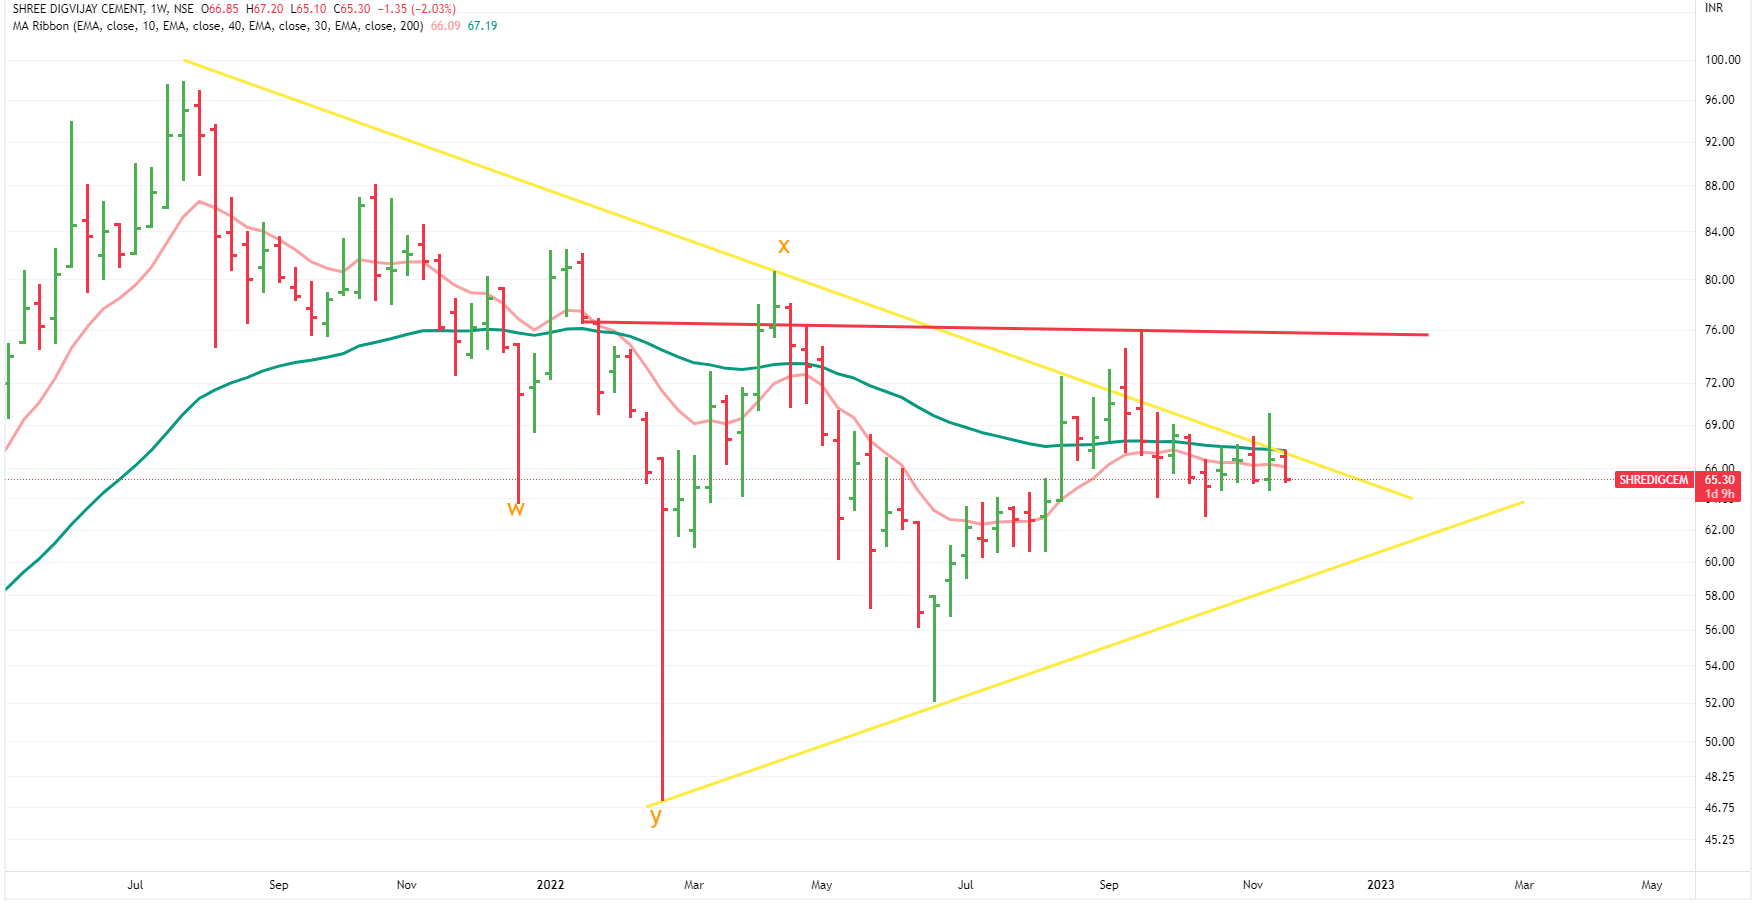
Shree Digvijay Cement
CMP 65
Keep in mind that our analysis and view is useless for trading prespective.
Our analysis and view is meant for medium to long term investors* for entering/holding and exiting.And we can go wrong all the times.
Would request you to study Stage Analysis given several times in earlier posts . You would find your answers by yourself . And in case of confusion, we would be always happy to help you.
On this stock, we don’t find anything positive as of now. It is below 40 WMA .Has a dstrong resistance at 75 .Daily /Weekly/Monthly MACD are in Sell zones. RSI in all timezones is shwoing weakness.
Won’t be surprised if we see this stock at the levels of 50 in coming months.
Disclaimer :This post is just for learning one of the few methods of price-patterns. Views are personal. No buy/sell recommendations. These are probability study methods and chances of success/failure depend upon various factors