Disclaimer :This post is just a for learning a method. Views are personal. No buy/sell recommendations. These are probability study methods and chances of success depend upon various factors.
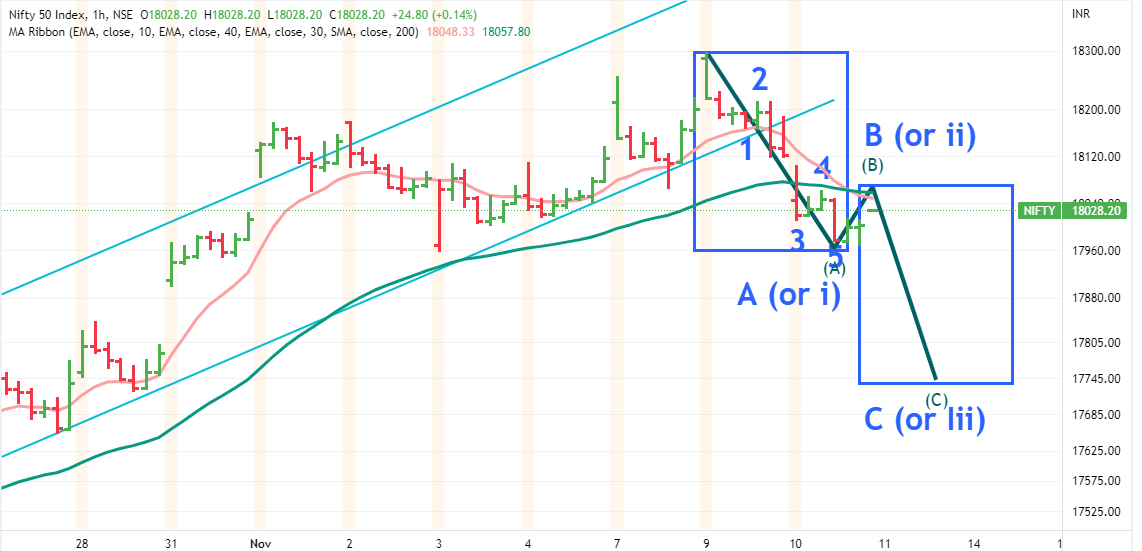
From EW prespective , Nifty has given a 5 wave decline on hourly chart . Now we can take this as A (or i) . And currently it seems to be in wave B (or ii) - the upside potential of B seems very limited.
Once B is complete, we might see a C wave decline ( or iii) . C can be equal to A anf then we might see a little bigger bounce. But if the C happens to be (iii) then we can see much deeper decline in coming weeks and months. Hourly Chart
Disclaimer :This post is just for learning few methods of price-patterns. Views are personal. No buy/sell recommendations. These are probability study methods and chances of success/failure depend upon various factors.
.
Disclaimer :This post is just for learning few methods of price-patterns. Views are personal. No buy/sell recommendations. These are probability study methods and chances of success/failure depend upon various factors
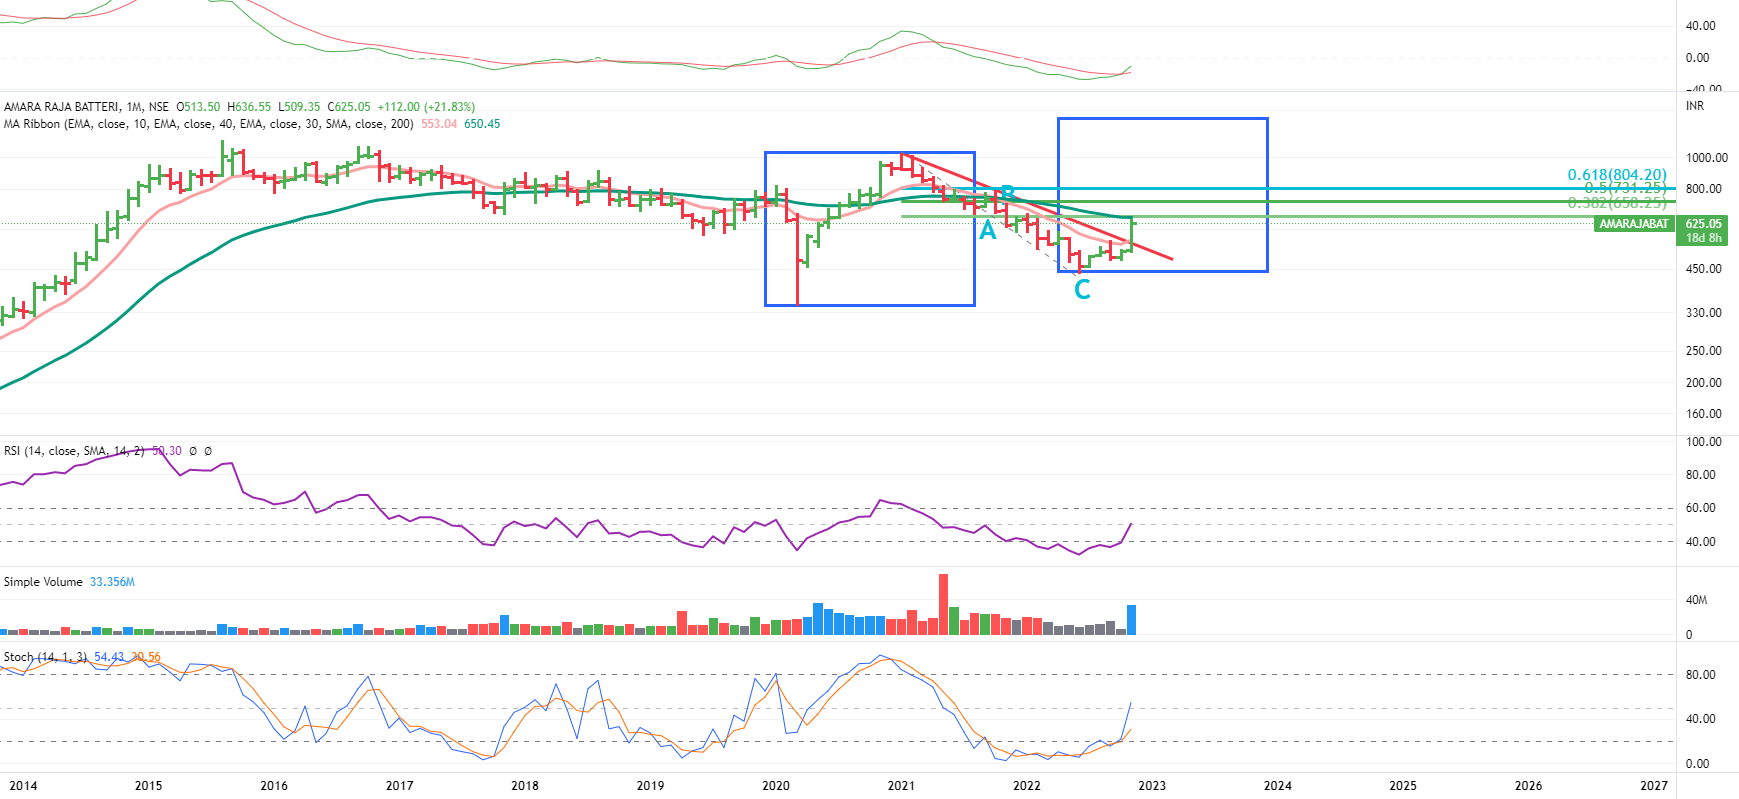
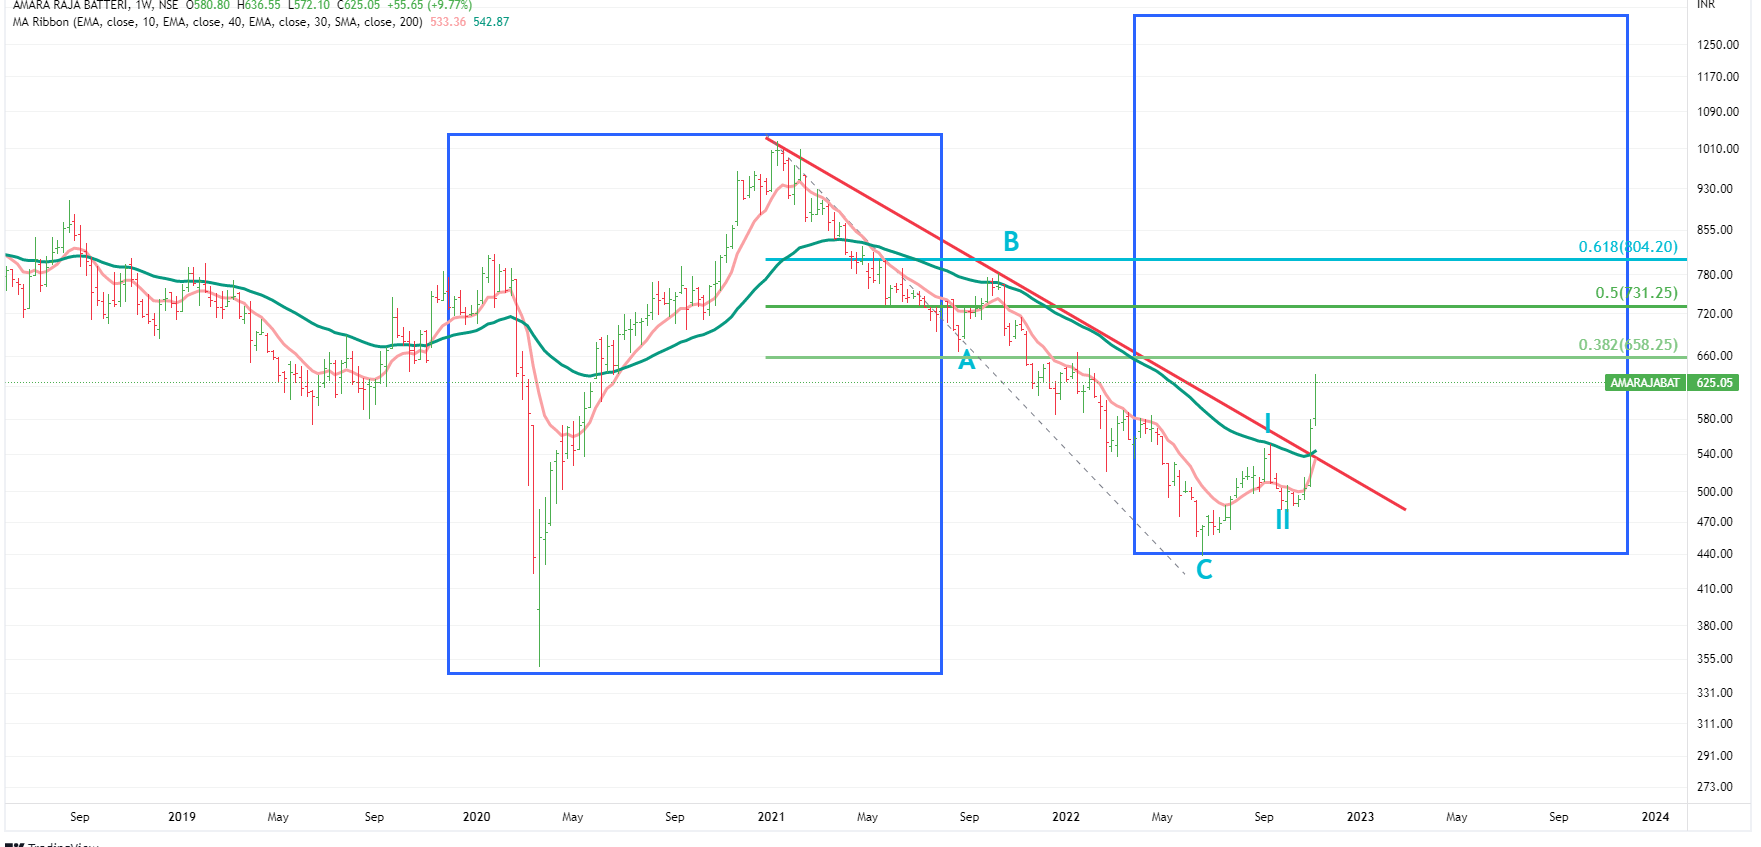
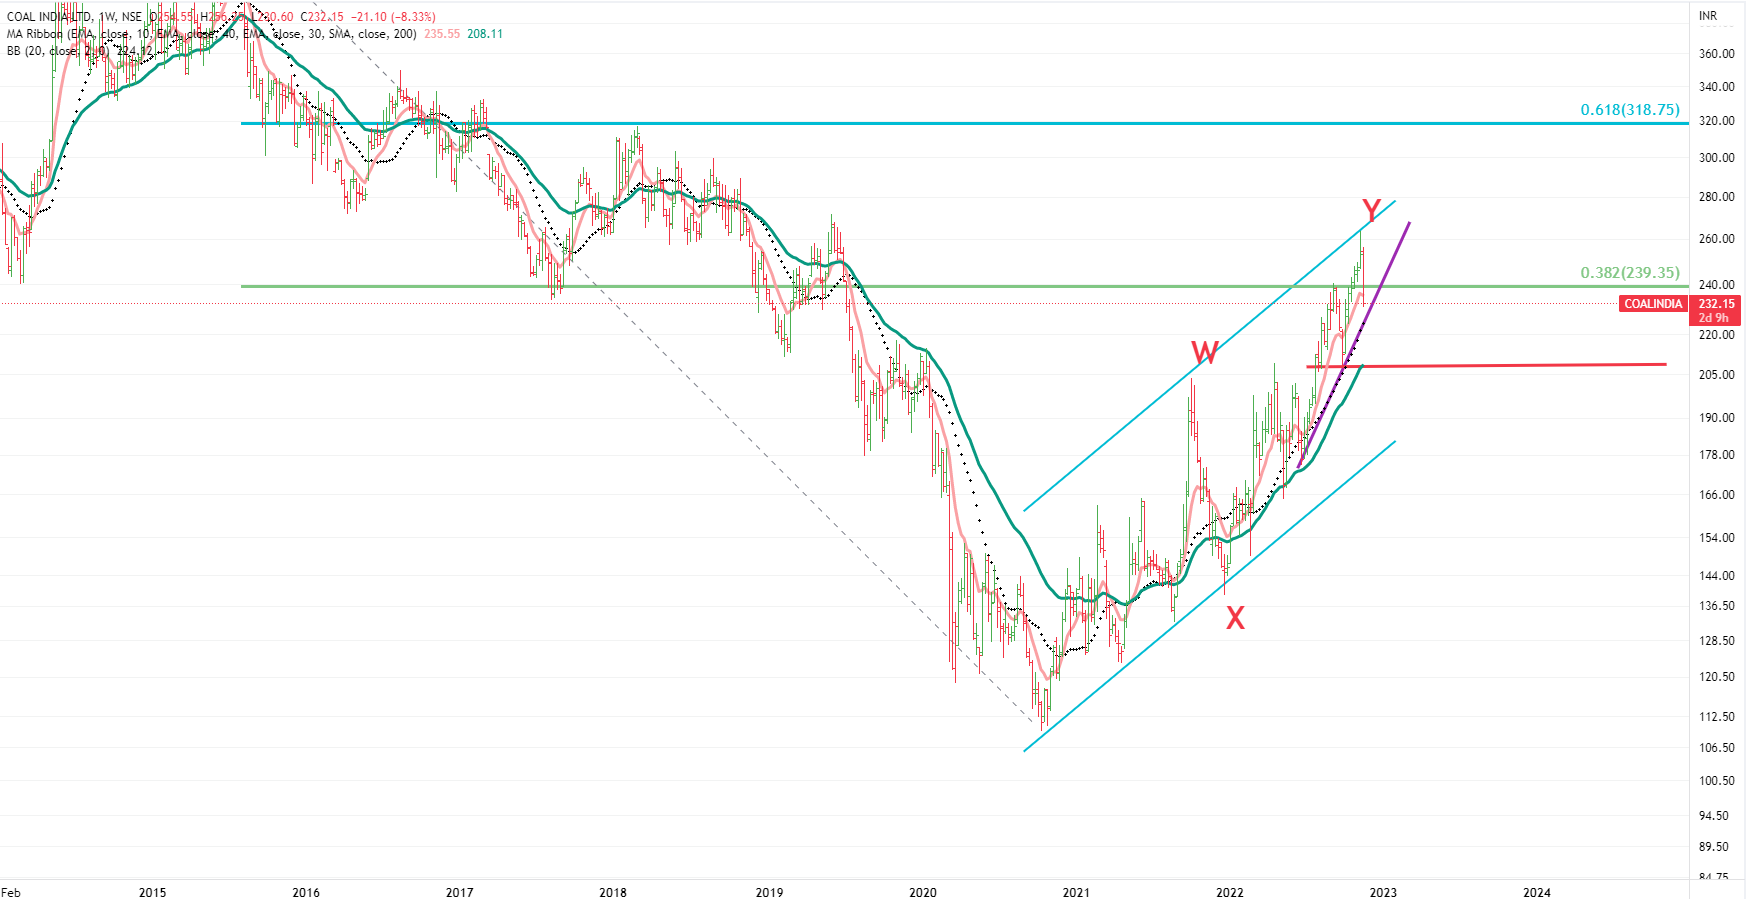
After Covid lows, it seems it finished its wave 2 correction and now it is bouncing back in wave 3.
But we need few confirmations .
Monthly MACD has turned in buy mode, and that is a good indicator.
Volumes are also coming in.
Now it needs to cross and close above 38% retracment level and that is also where it would cross 40 months moving average -that level is between 650-660.
Next resistances are at 720 and 800.
If it is able to cross these in coming months then it can go beyond all time high .
In short , position sizing is important. one can keep adding if it keeps crossing the above said hurdles.
Keep in consideration that these are weekly and monthly charts, these take time to play out. We would also keep a watch and would keep posting follow-ups if something changes.
Disclaimer :This post is just for learning few methods of price-patterns. Views are personal. No buy/sell recommendations. These are probability study methods and chances of success/failure depend upon various factors
Disclaimer :This post is just for learning few methods of price-patterns. Views are personal. No buy/sell recommendations. These are probability study methods and chances of success/failure depend upon various factors
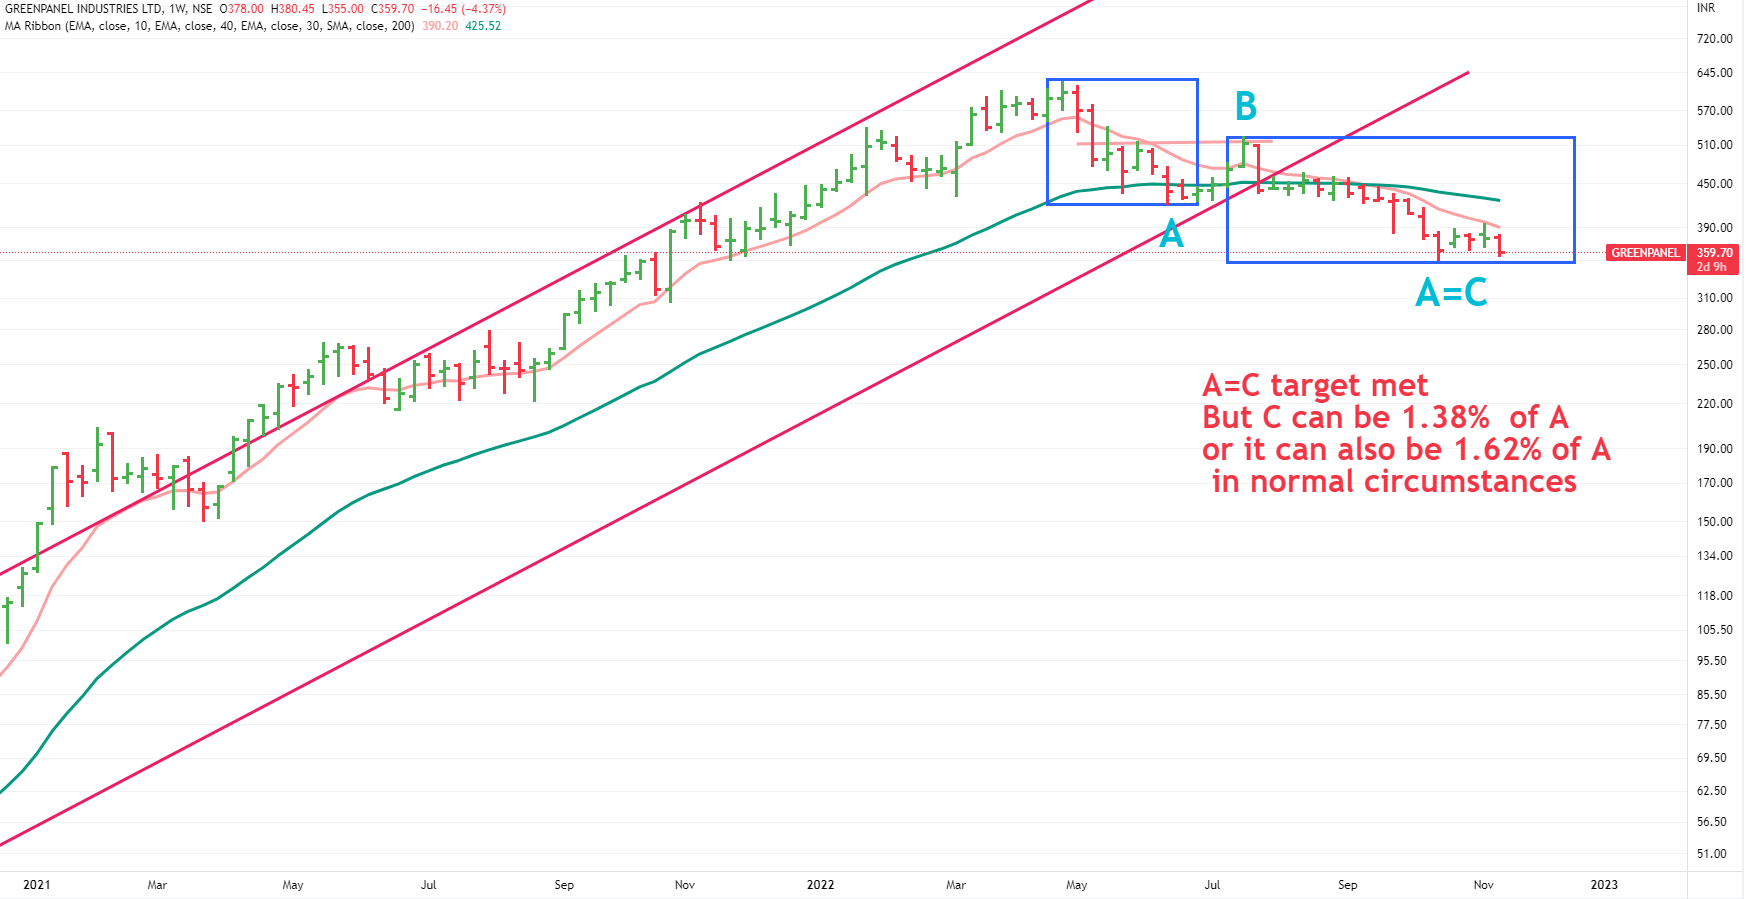
Hi Dear Sir ,I am impressed by your technical analysis skills and so I have become your regular follower since then. If you shed some lights on Greenpanel Industries, then it would be nice of you.
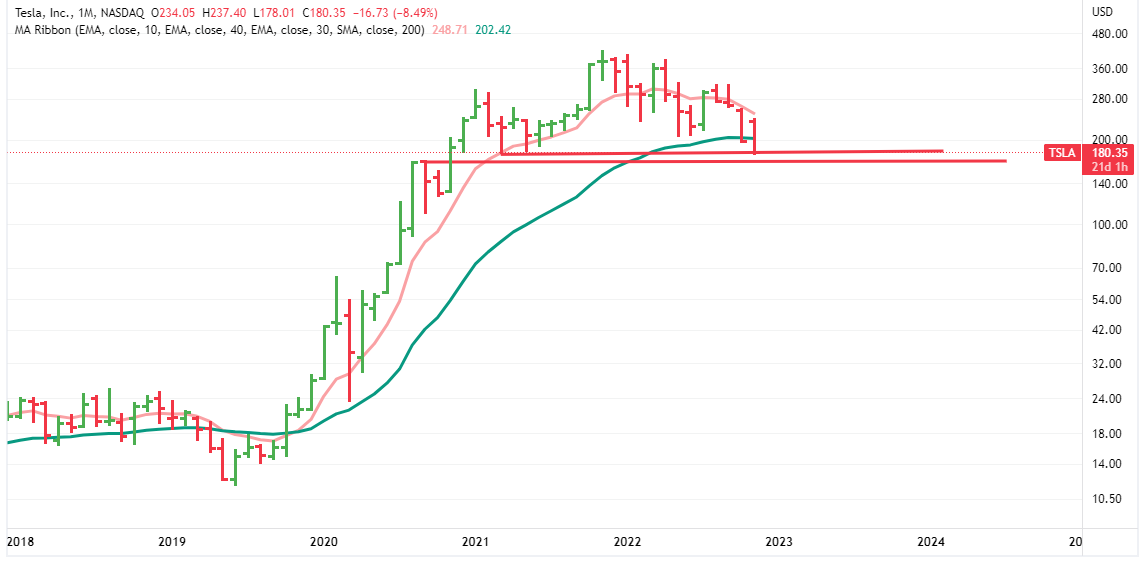
It had a good run from 24 to 630 in 2020-2021 ( Wave 1).
Now it is is correction zone (Wave 2).
As depicted in the following chart- Wave C has met the first target ie. equivalent to C.
But it is yet to show the signs of stopping here as recent candles are not so encouraging as well as MACD is in sell zone in all timeframes ( daily/weekly/monthly) .
In these cases , wave C can be 1.38 % of A or 1.62% of A. (if a company commits fraud or overall market crash happens then price can go beyond these levels)
Better to wait and watch here - if it breaks previous low of 351, it can go to 290-300 (1.38% of A)
Worst case : if it does not stop there , a bottom should be made near 260 level ( 1.62 % of A) .That is also a level for 61.8% retracement of whole rise.And we also have a strong support between 260-270 levels.
Disclaimer :This post is just for learning few methods of price-patterns. Views are personal. No buy/sell recommendations. These are probability study methods and chances of success/failure depend upon various factors
Disclaimer :This post is just an effort for learning few methods of price-patterns. Views are personal. No buy/sell recommendations. These are probability study methods and chances of success/failure depend upon various factors
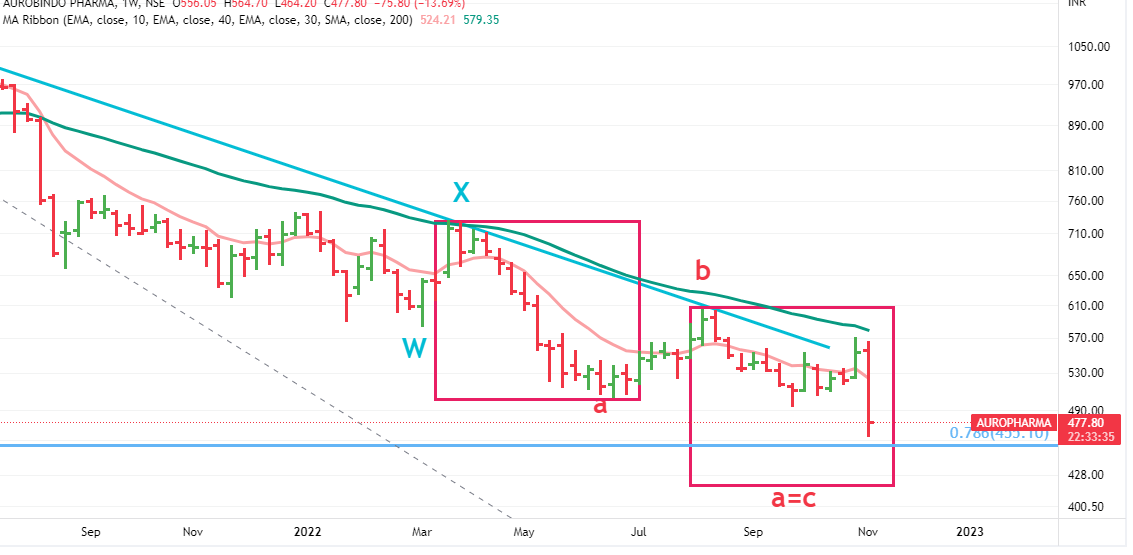
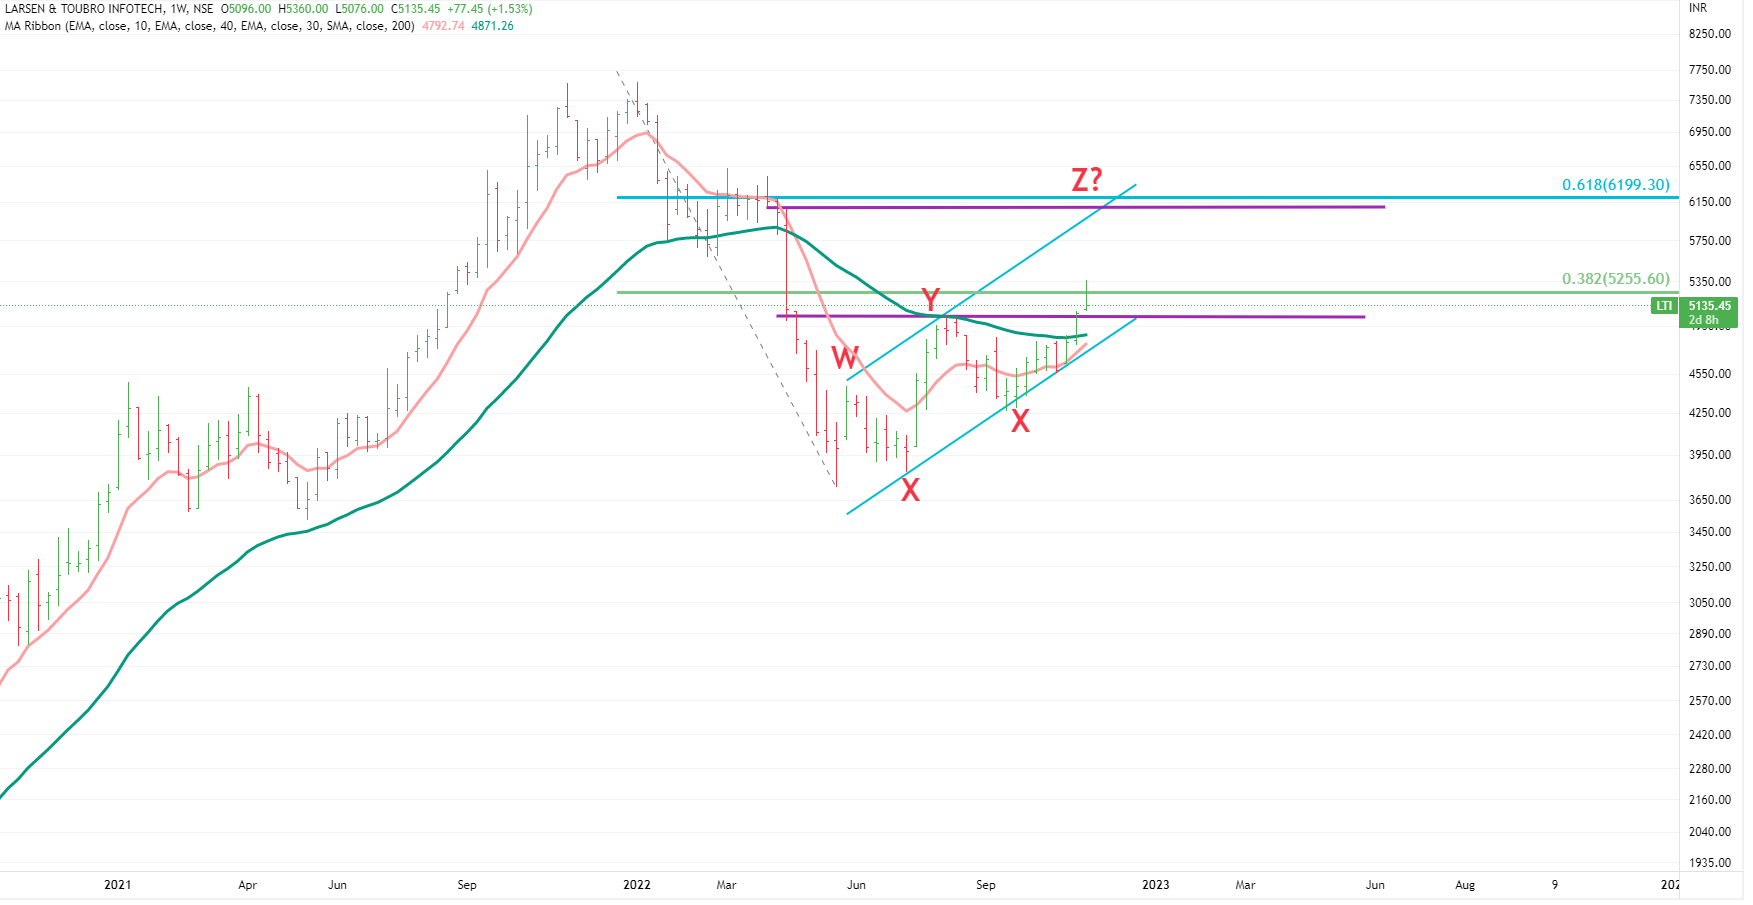
Like most of the other IT stocks , it is bouncing back.
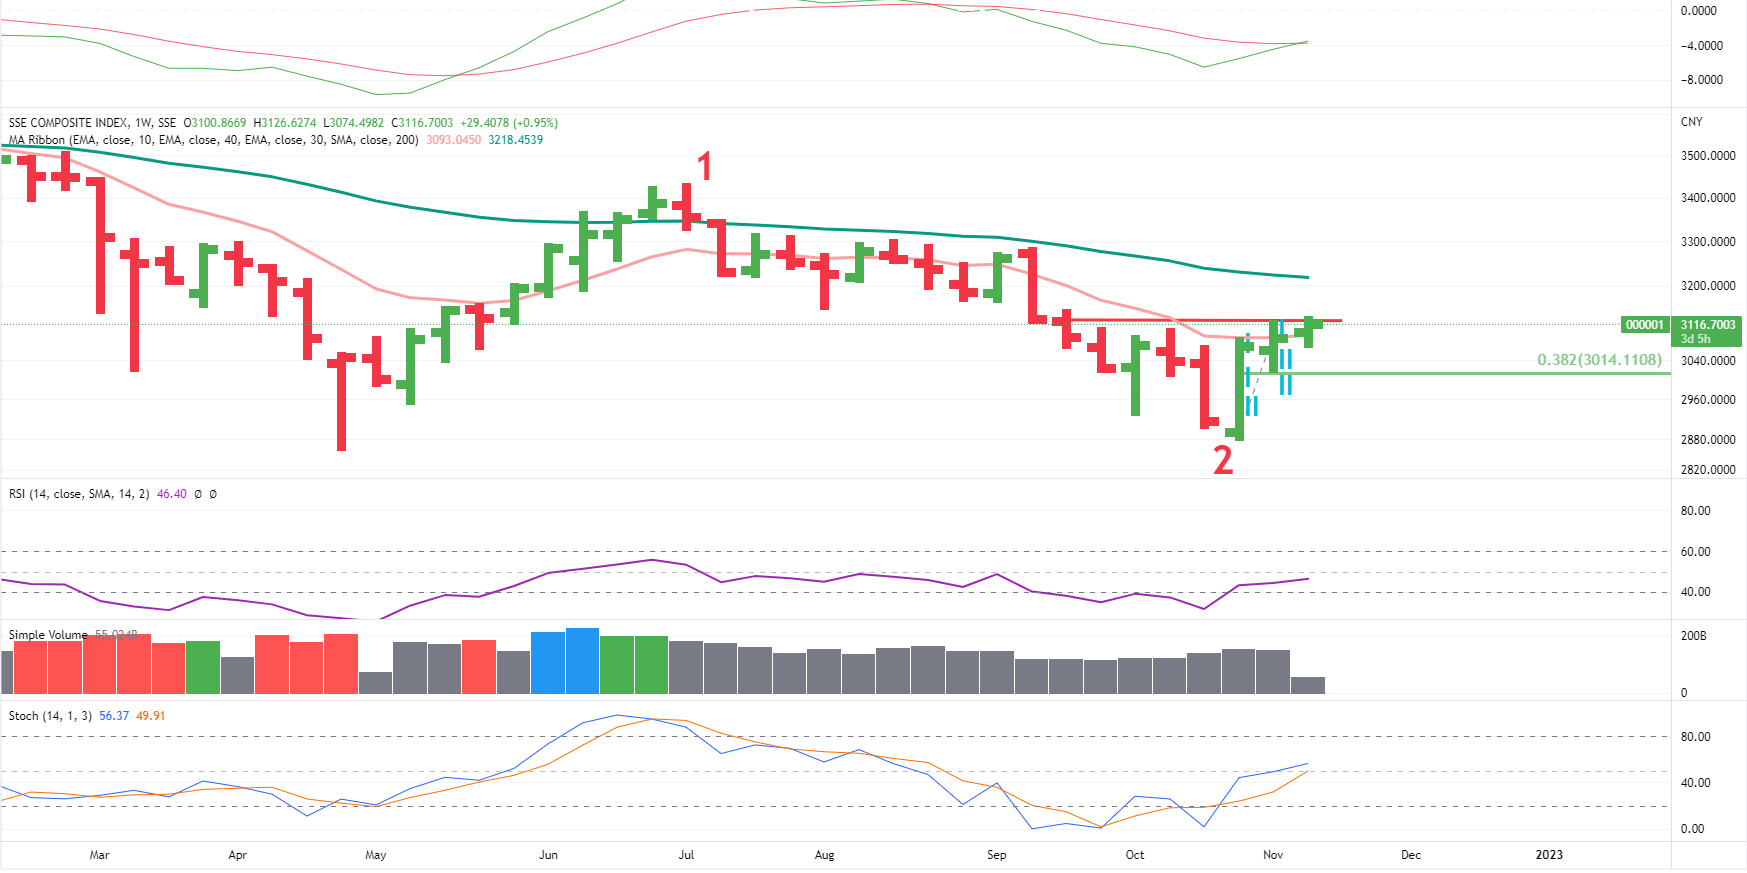
It completed wave 1 in Nov 2021 and then corrected upto 61.8 % of whole rise in May 22. Many a times ,good stocks finish their corrections (wave 2) at this % of retracement.
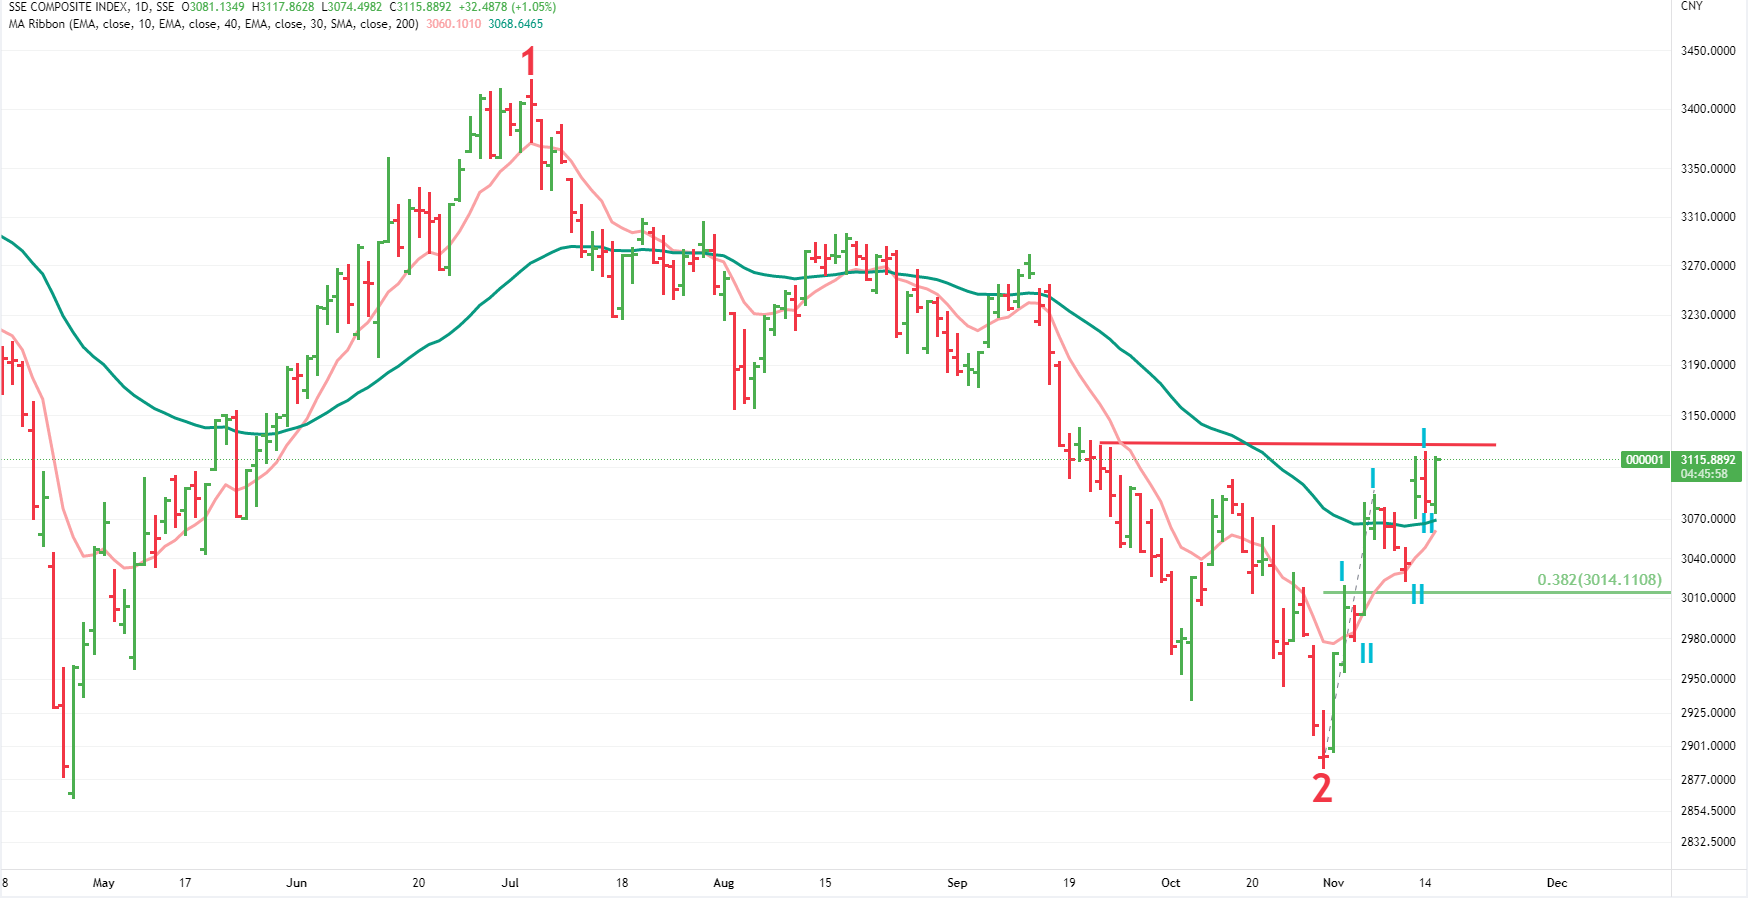
Now the debate is - whether the rise after May 22 is a fresh wave (wave 3) OR it is a just a corrective rally . We’re currently considering it as a corrective rally due to macro -scenario,
As per the weekly chart, it can move upto 6100-6300 levels (wave Z as well as 61.8 % retracement of whole fall since May 22) . In short , it can keep moving between 5000 -6200 for next few weeks/months .The condition is that it should not break the lower purple line ie near 4900-5000. (in very short term, we might need to be extra watchful)
If t crosses and closes above 6200, we would review again . Whether the current rally is really start of THE next bull wave or there’s something else.
Sorry ,unable to provoide a very definite path . But that’s life, we need to tread between unceratinities to move ahead… Disclaimer :This post is just for learning few methods of price-patterns. Views are personal. No buy/sell recommendations. These are probability study methods and chances of success/failure depend upon various factors