@StageInvesting looking forward to your analysis of BAJAJ FINANCE & HDFC BANK…thx a ton, in advance,
Before, you ask…let me give the timeframe…since both are large cap and widely held and analyzed , I don’t mind a longer term hold/averaging
Please do mention your time horizon for investment.
Please do mention your time horizon for investment in this stock.
@StageInvesting “Kuantum paper” has broken out after long consolidation.
please share your view over the next 2 years time frame…regards…
Thank you.Longterm and based on results, commentry, auto sector numbers . technically if it goes for short term correction for next 3 months wanted to exit and re enter.
This i entered for short term trade , 3-6 months.
Bajaj Finance
Weekly Chart
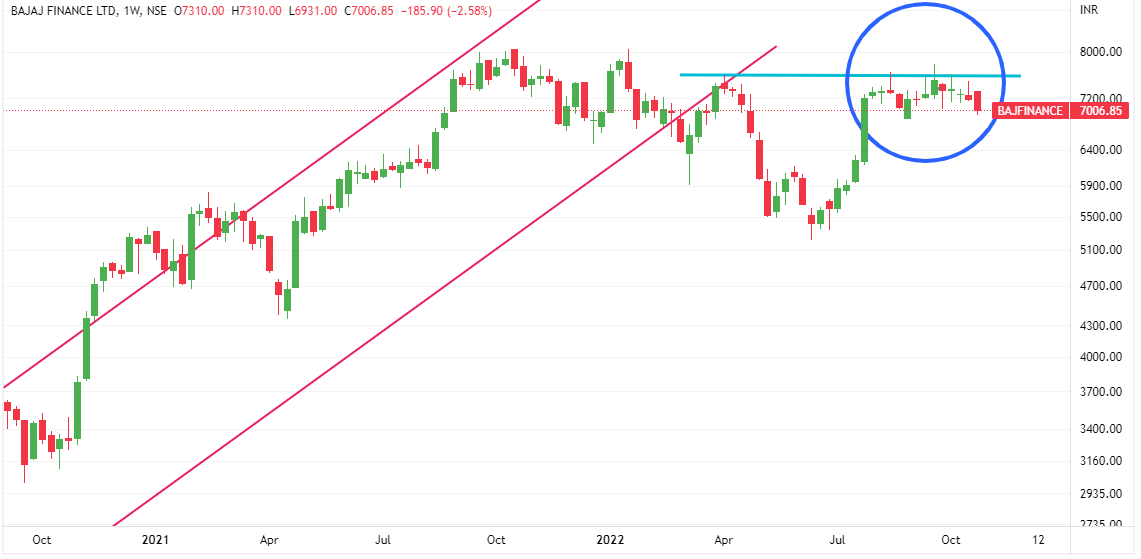
Confluence of lot of candles with bigger upper wicks indicate that huge supply is coming and stock is on weak legs.
If this weakness continues, we can see a good slide.
Monthly Chart
1st support 20 MMA ( 6402) , next support at 40 MMA ( 5400) and next support is at lower end of the channel (5100).

Disclaimer :This post is just a for learning few methods of price-patetrns. Views are personal. No buy/sell recommendations. These are probability study methods and chances of success/failure depend upon various factors
5 Likes
Pls evaluate Laurus Labs from a 3 year holding perspective.
Hello @Stageinvesting
Have read and benefitted a lot from your posts.
Would be grateful if you could check ITC from 1 year perspective. Which stage does it appear to be in.
Thanks and keep up the good work ![]()
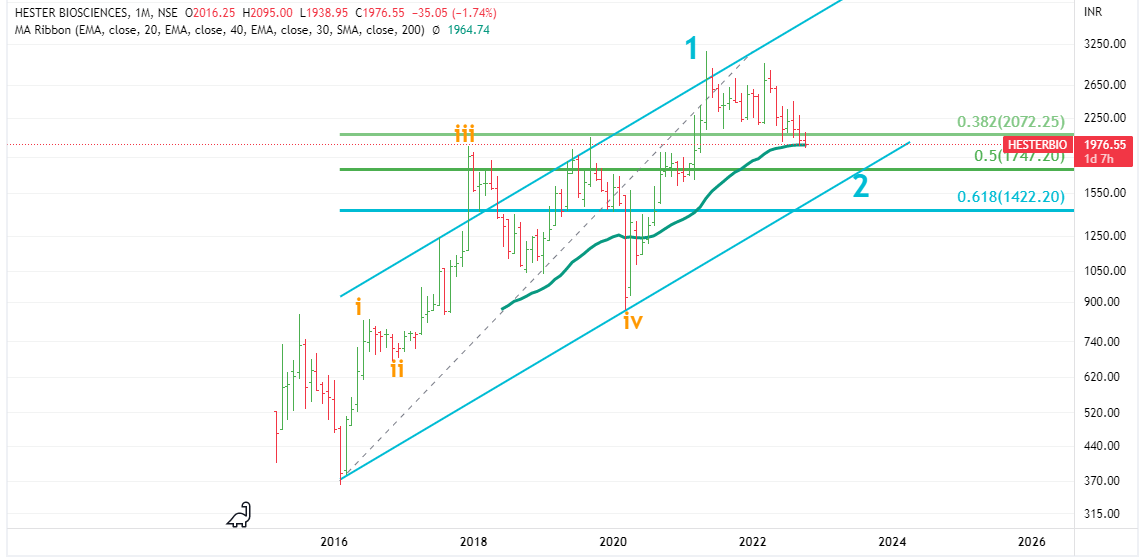
Hester Bio
It seems that it is in wave 2 for more than last one and half years . Wave 1 went on from 360 to 3100 and it lasted for 5 years .
Now it has already completed 38% retracement of the whole wave and is taking support at 40 MMA.
If it breaks 40 MMA and starts trading below it ,it can go to 50 % minimum (1750 ) and that is also coinciding with lower end of the channel . Beyond that 61.8% retracement level can take it to 1400-1500 range.
Now we can’t do anything except waiting. Wave 3 can take it to greater heights . But we don;t know where wave 2 will end and when Wave 3 will start.
Already we’re in wave 2 for last 22 months, it can go on for many more months.
Monthly Chart
Disclaimer :This post is just a for learning few methods of price-patetrns. Views are personal. No buy/sell recommendations. These are probability study methods and chances of success/failure depend upon various factors
5 Likes
Sir if you can share views on Aster DM , GuficBio and Latent view please
Thanks
Hi waiting for your note, until then could you share some resource on the same?
TFCI
CMP-83.50
Weekly Chart
At an important junction.

To be or not to be -that is the question.
At an important juncture -trying to break the trading range.
Volume, RSI look ok. Weekly,Monthly MACD in buy mode.
Disclaimer :This post is just for learning few methods of price-patterns. Views are personal. No buy/sell recommendations. These are probability study methods and chances of success/failure depend upon various factors
1 Like
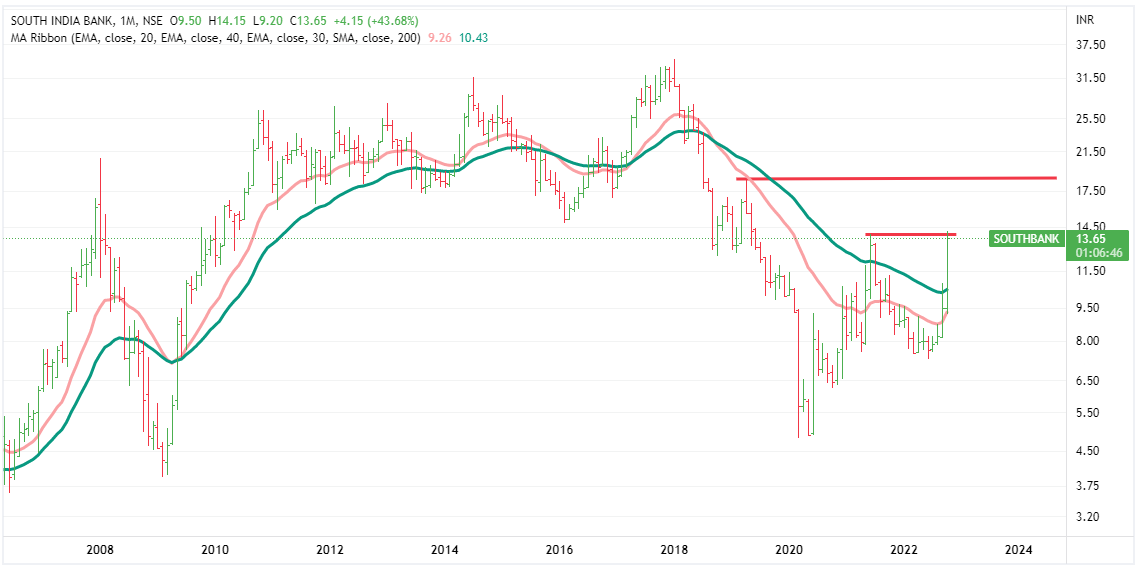
South India Bank
This also is at a crucial juncture.
Will it break its one and half years resistance !
Daily /weekly RSI seems to be heated . May be some cooling off required for next big move.
Weekly Chart
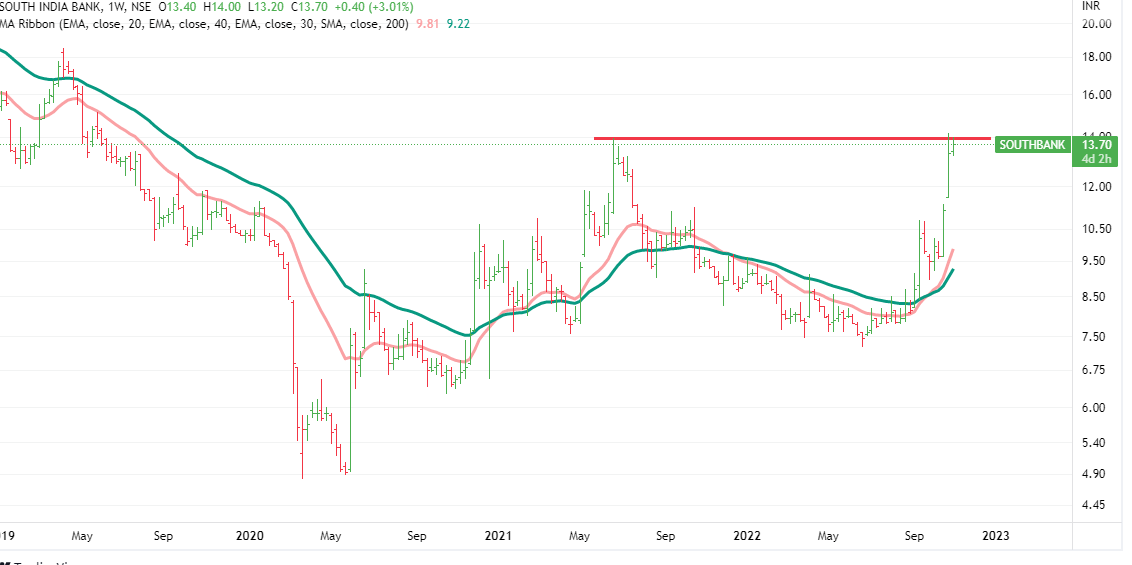
If it crosses the current hurdle, next resistance is at 18.50.
Monthly Chart
Disclaimer :This post is just for learning few methods of price-patterns. Views are personal. No buy/sell recommendations. These are probability study methods and chances of success/failure depend upon various factors
5 Likes
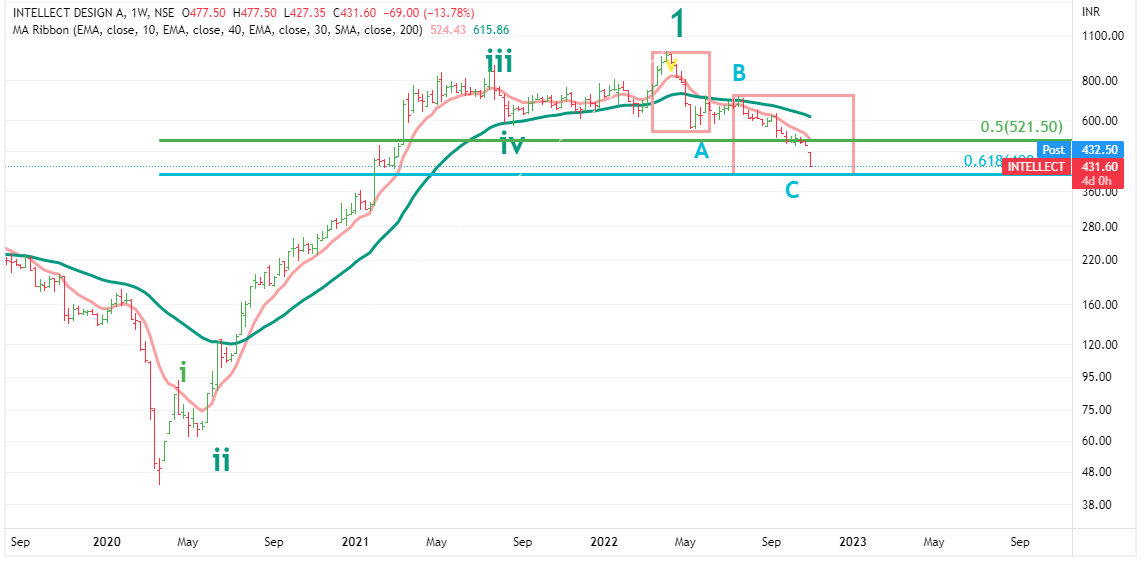
Intellect Design -Follow-up
CMP -431
Covered 18 days back-price was 530.
Little mroe pain is left-it seems.
5 Likes
Hey @StageInvesting what’s your current view on the overall market although nifty has hit 18k broader market hasn’t performed that much yet
We seem to be in last legs of rally. Broader market not participating in the rally is a sign of weakness.
Only surprise can be Fed pivot or Fed slowing down interest rates -hike. This week can be a decisive week for next 2-3 months movement.
3 Likes