My friend ,sorry to say that these days ,we don’t have many upbeat news to share as we’re in a bear market. (in bull market ,you won’t need us as when tide goes up even the stones start floating)
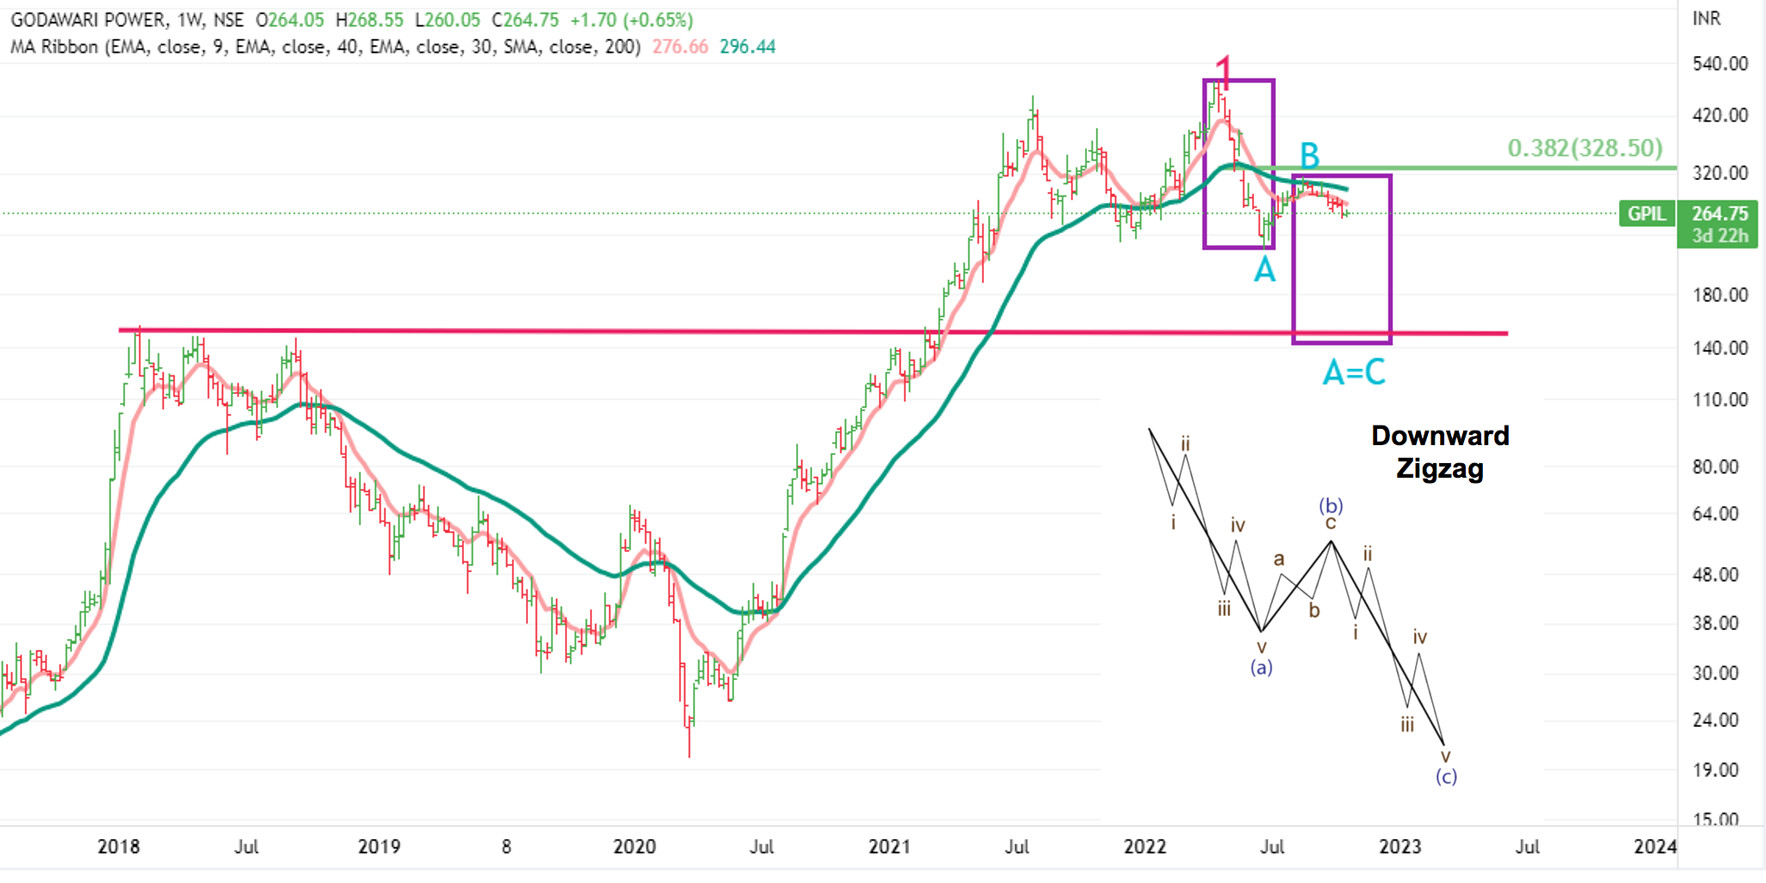
First sign of weakness is that it is trading below 20 MMA (monthly moving average)
On weekly charts, GPIL seems to be in a Zig Zag correction where wave A has 5 legs, B has 3 legs and then C again has 5 legs. Generally C happens to be equal to A (in % ge terms) but in severe bear markets, C becomes much longer.
Currently it seems to have started C. Now where it will go ?
First stop can be 40 MMA ie between 210-220. And if it does not stop there,then target for C can take it down much further . And we can also see a support there -red line) .Won;t write the number here as few may get goosebumps. Would request to check the chart . Let’s pray that it does not happen. Weekly Chart
Keep in mind that weekly chart are seen to know 3-12 months movement so don’t expect anything in jiffy.
Disclaimer :This post is just a for learning few methods of price-patetrns. Views are personal. No buy/sell recommendations. These are probability study methods and chances of success/failure depend upon various factors
Disclaimer :This post is just a for learning few methods of price-patetrns. Views are personal. No buy/sell recommendations. These are probability study methods and chances of success/failure depend upon various factors
If you’re reading our thread seriously , you will not ask this question.
The reasons are as following
a) Only God knows the bottom , we can only make a calculated guess
b) Even if we know the bottom, we don’t suggest to buy at that price due to
i) What if that is not the final bottom
ii) What if you catch a stock at the bottom and then it stays in a narrow- range for many years (check EdelWeiss , JM Financial and many other stocks )
We are creating an awareness of a method that works differently. The basic strategy is Buy Higher , Sell Higher. (buy low, sell high is not for us) . We try to catch the stock when it is catching momentum for upside.
Hence request is to not to focus on finding a bottom.Focus on learning a method where you can catch the stock at the right time.
Yes, we do post projections for future price-movements but that is for study purpose.
Options Data confirms that the issue of short-attention-span is now prevalent in all walks of human life.
For last many months, we’re witnessing a phenomenon in India where most of the volume in our stock-market is happening in options-segment.
Options is one of the segement in the market where many people belive that one can make quick bucks and can multiply your capital very fast!
How many of these people are successful ?
Well, not many. As per Zerodha’s founder, 90% of options -traders loose money ! And he is saying it on the basis of hard data!
It seems the short-attention-span , that is the result of all social media apps , is now affecting the stock-markets also.
But is it only India specific event !
Nope, it is happening worldwide .
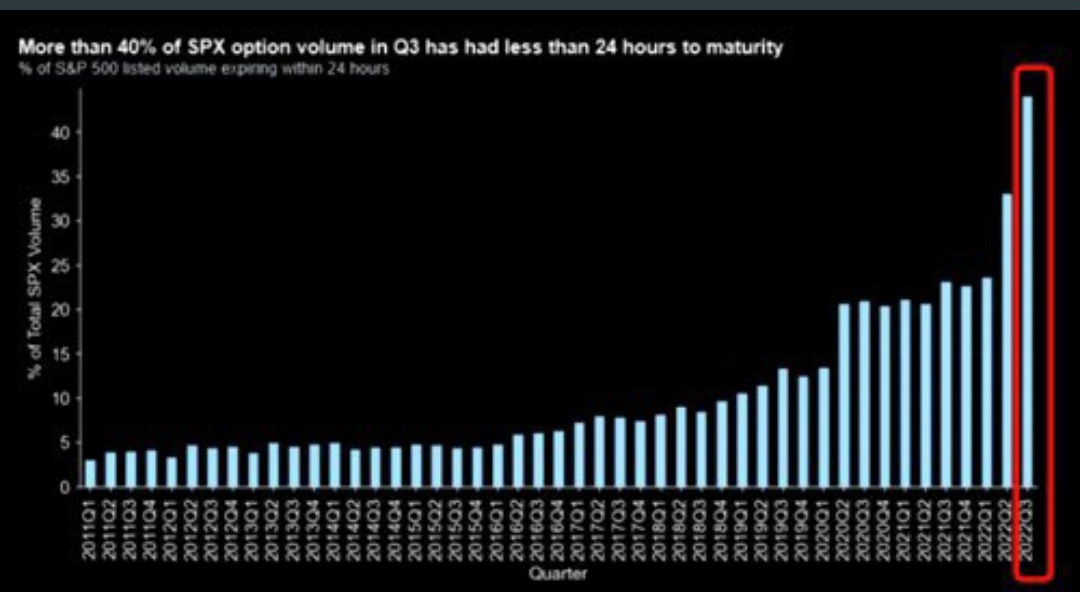
The following chart from US S&P500 shows how options duration-period is coming down over the years .
It signifies that people want to be rich and that too overnight.
Other inference from this is that if these people remain in the market for long time, we should be expecting higher volatility in the markets as compared to the past.
This picture respresents average options-durations over last many quarters -starting from 2011.
In current quarter , 40% of SPX options have less than 24 hours to mature - an effect of change in behaviour post-pandemic or it is due to young gaming-crowd coming to the market and playing here for quick adrenaline-rush like any other sport or like in a casino!
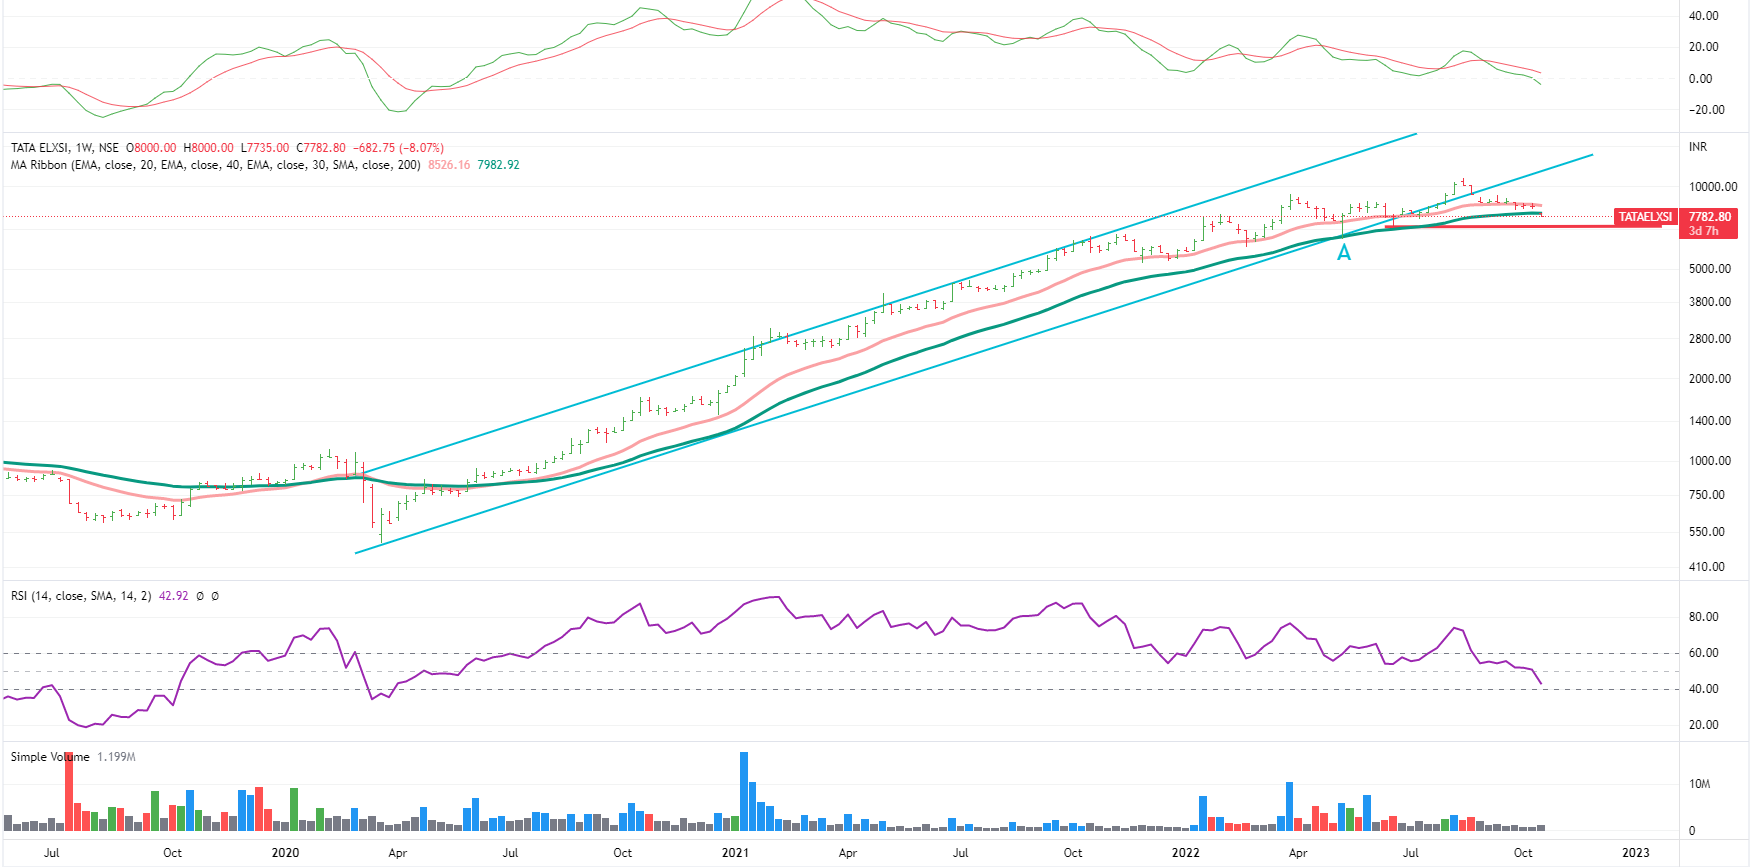
@StageInvesting, Thanks for the EW based predictions on specific stocks and broad indices. How does it look for Tata Elxsi given the recent qtr profit and margin contraction?
Difficult to comment for short-term as chart is yet to develop fully on down-side and we might see some short-term up and down gyrations due to bear-market bounce in US as well as in India but for medium to little long term , it looks bearish.
Reasons :
a) It has broken the channel of the whole rally that started in March 2020
b) Has first time gone below 40 WMA in last two and half years, if it closes belw the same on this weekend , weakness would get further cemented.
c) Is on sell on Monthly,weekly MACD .
Should get a support near 7100 and then 6900 - as this happens to be a gap areaon daily charts. If it breaks the same , we can see it at sub-6000 levels in the months to come ( and still it would be overvalued )
Disclaimer :This post is just a for learning few methods of price-patetrns. Views are personal. No buy/sell recommendations. These are probability study methods and chances of success/failure depend upon various factors
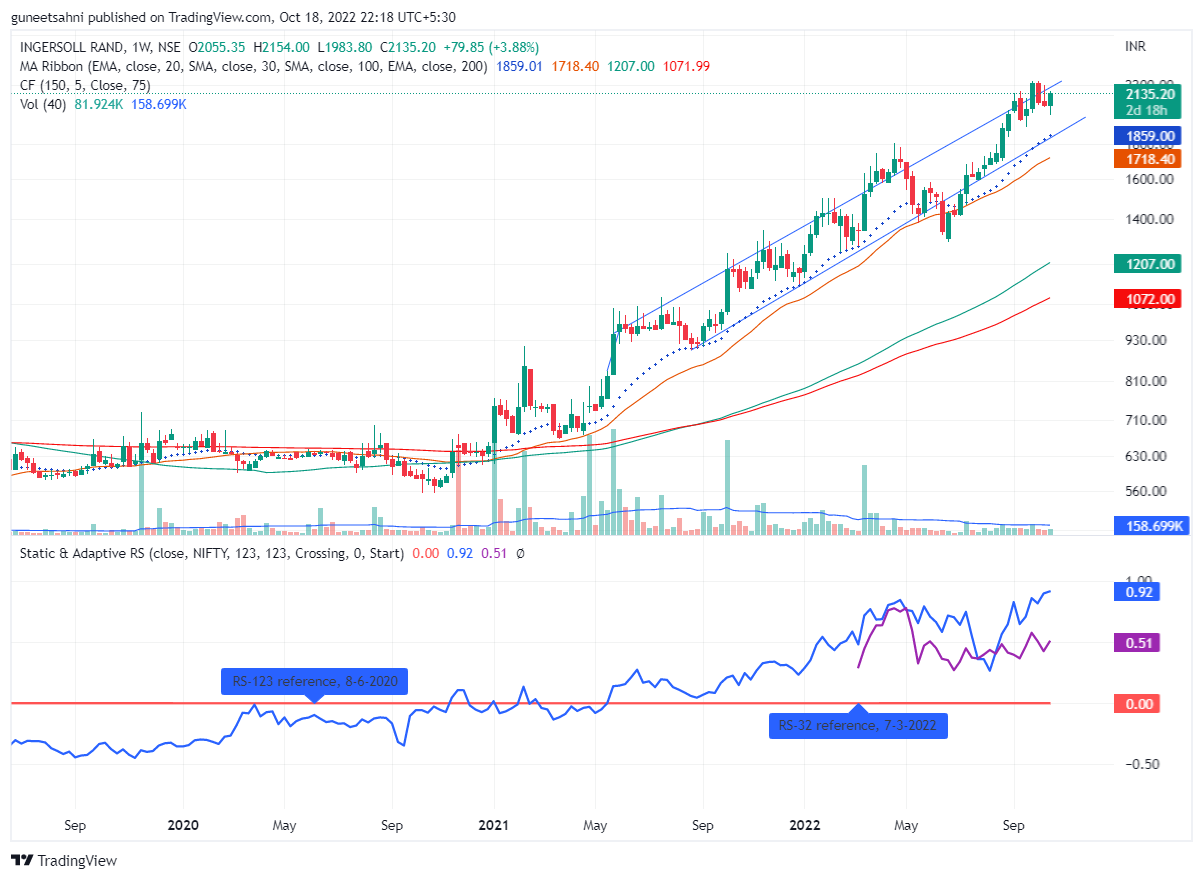
You mentioned that you’re still holding on to Ingersoll-Rand.
What are your views now?
The stock is still much above its 30 and 40-week moving averages.
Its the second largest Air compressor business in India
Funds like Manulife, Invesco, and Dimensional entered the previous quarter.
The MNC holds 75% and gave a humongous special dividend of Rs 200 in 2018.
I have been holding since 450 levels as a core holding, but since PE has shot up to 50x (similar to Elgi), I am looking forward to the technical view.
We covered it when it broke 40 MMA emphasising the importance of 40 MMA for long term investors. The parice was 847 at that time . We covered it in May .
Like mentioned many time , play as a result of breaking of monthly averages take months.Still long way to go.
नैणों की मत माणियो रे
नैणों की मत सुणियो
नैणा ठग लेंगे
जगते जादू फूकेंगे रे
जगते-जगते जादू
नींद बंजर कर देंगे
नैणा ठग लेंगे
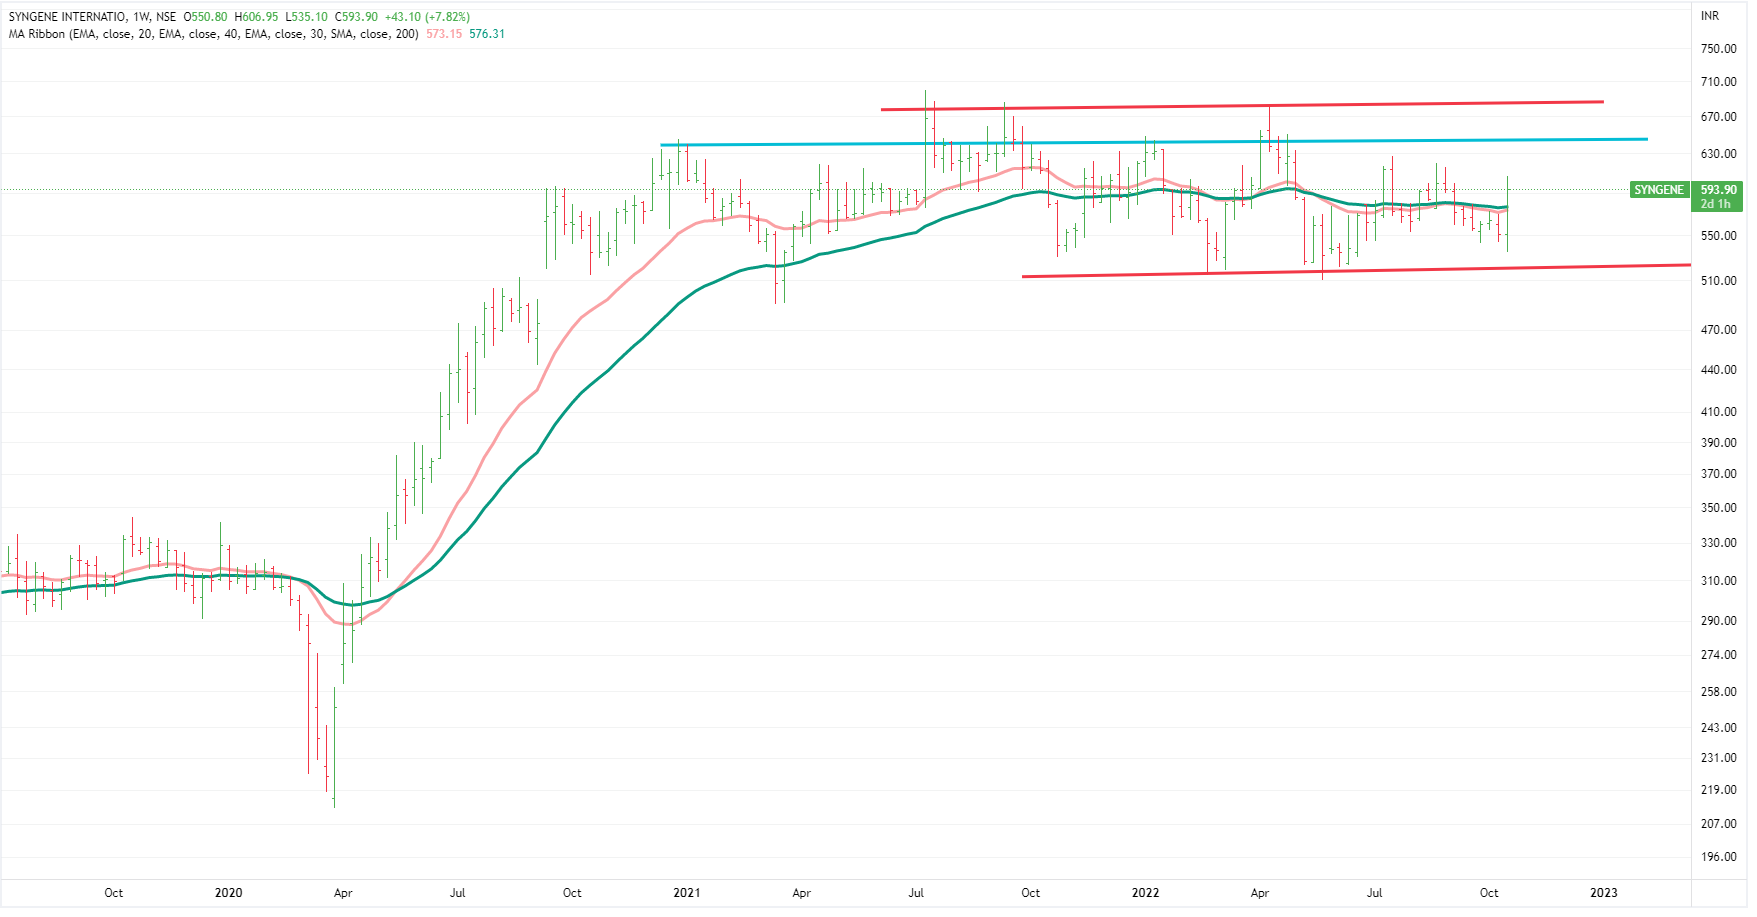
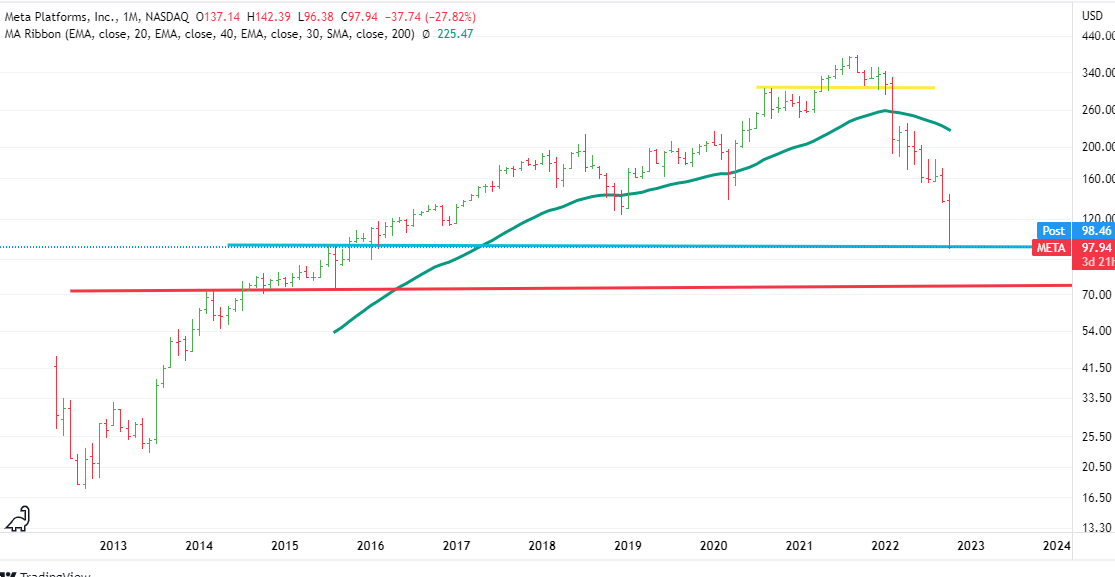
Syngene
There is nothing in the chart that tells that a long term upmove is starting. Let cross and close above the two key resistance lines (supply-zone ) ,only then we would revisit the chart. Weekly Chart
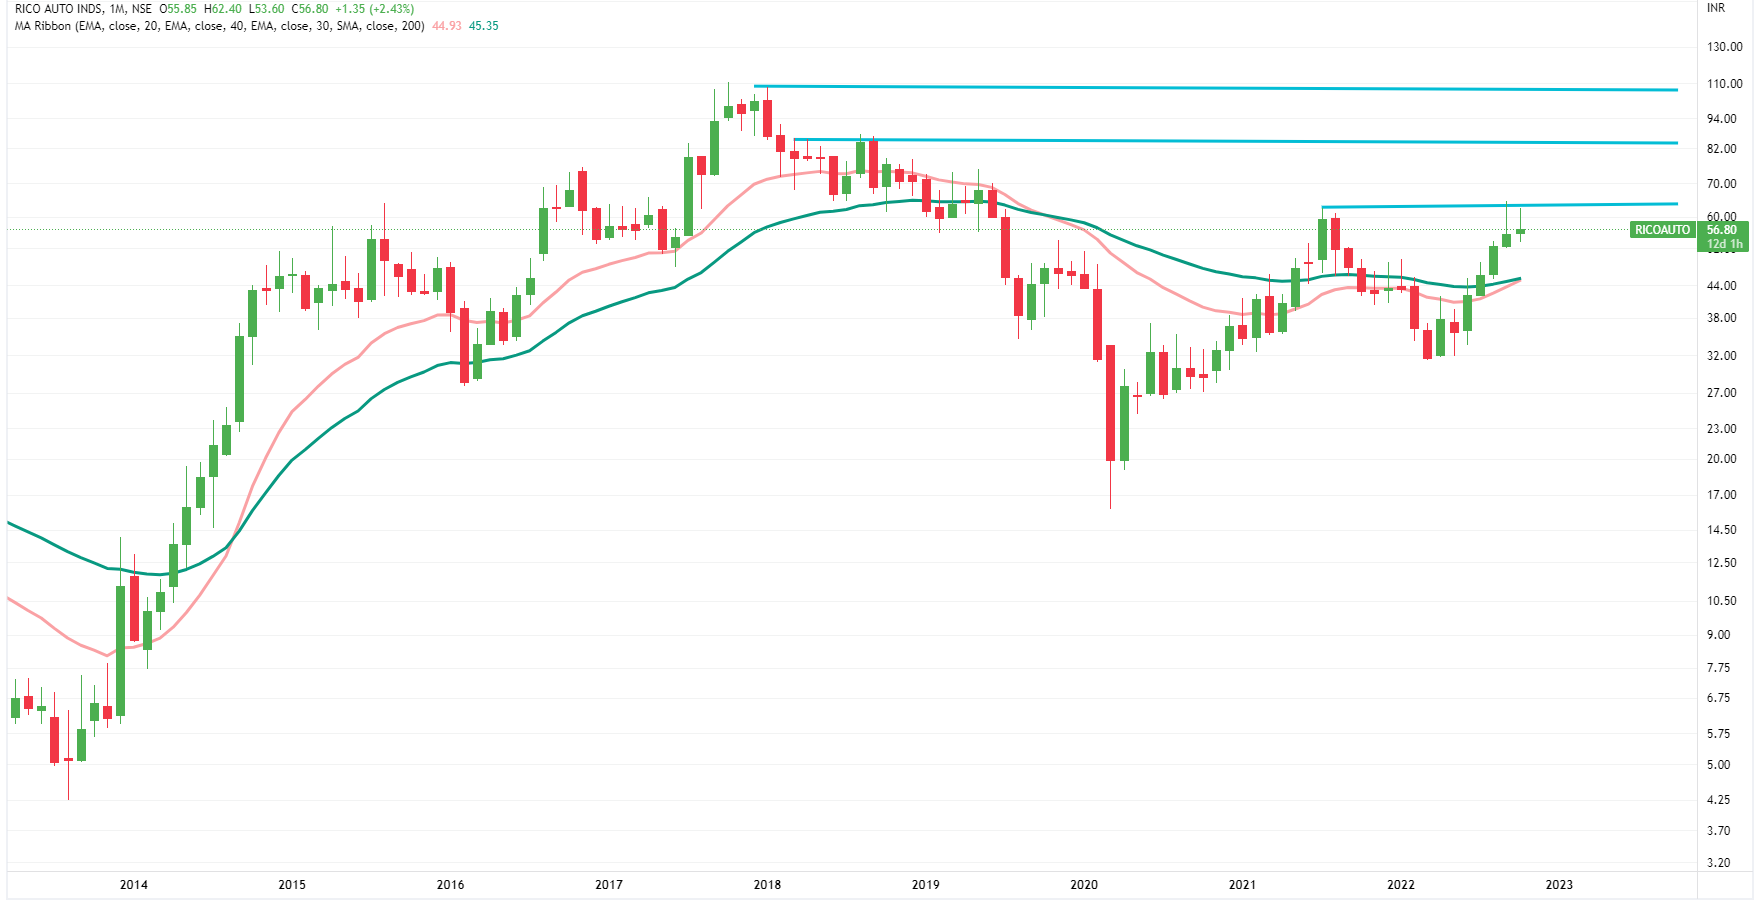
Praj
No clear views as of now . On 1st look it looks that it in last leg of rally. But not very clear. We generally don’t enter a stock that is stretched this much.
If we were you ,we would stay away for the time being.
We would take intial position once it crosses and closes above 63. Then next positions would be added as it crosses next resistance levels (blue lines) - but we would quickly exit if it starts moving below lower blue line.
Disclaimer :This post is just a for learning few methods of price-patetrns. Views are personal. No buy/sell recommendations. These are probability study methods and chances of success/failure depend upon various factors
Disclaimer :This post is just a for learning few methods of price-patetrns. Views are personal. No buy/sell recommendations. These are probability study methods and chances of success/failure depend upon various factors