
Mahindra CIE- Covered few days back. Please check the thread.
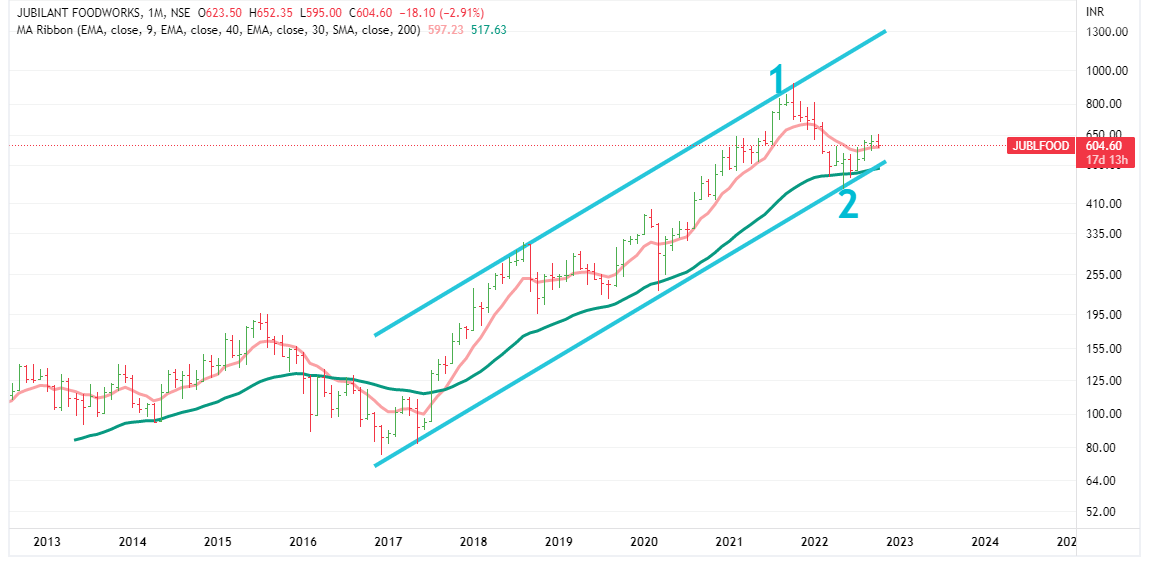
Jubiliant Foodworks
We might see a short term B wave rally (Bear market rally) .
In longer term, if we check monthly chart it seems that it has ended its long term bull run and now it is corrective mood.
Monthly Chart
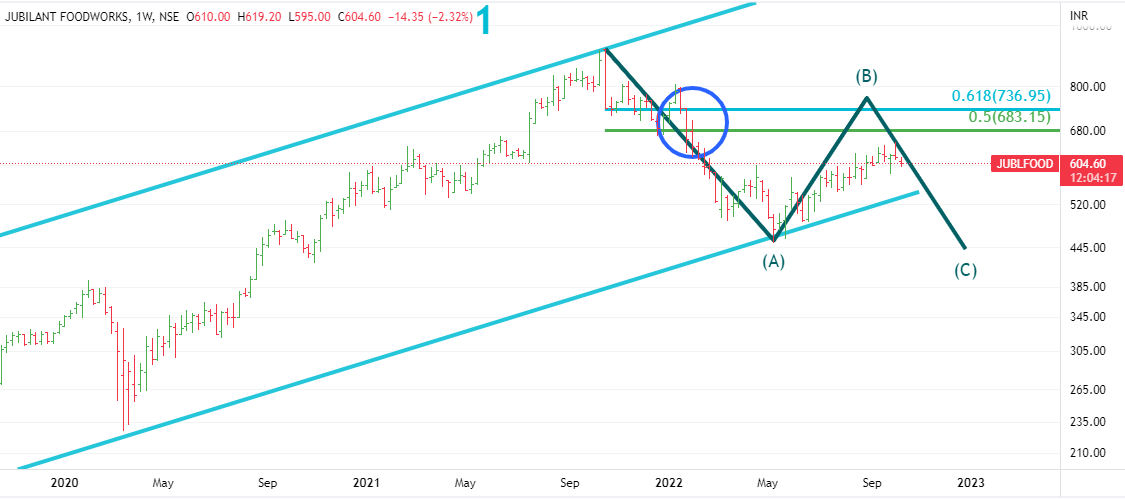
On weekly chart, we see a B wave bounce going on. That might take it 50 or 61.8% retracement of wave A ( 685/735) that also coincides with the top of red ED bars ( in blue circle) .If we cross the same,we might have double-top ( highly unlikely)
After B wave bounce, it should start wave C ,that might take it 450-500 levels - ie. 50 % of whole bounce since 2017 and lower end of monthly BB and in worst case scenario A=C .
This scenario may play out in next 6-9 months as we’re looking at weekly and monthly charts.
Weekly Chart
Disclaimer :This post is just a for learning a method. Views are personal. No buy/sell recommendations. These are probability study methods and chances of success depend upon various factors.
5 Likes
Hi,
Could you please give your views on Kopran with EW perspective. After reaching high of 370, it has corrected 61.8% and trading in that range of 159. Whether wave 3 long term will start?. Can we consider that stage 4 is completed. Thank you.
We covered it long back and now it is the levels that were projected in June.
Now the point is whether it woild start the next wave or would go down further.
Keem in mind that a stock needs good market sentiments as well as sector sentiments to start their next leg.
Other factor to consider is that the corrections happen to be of 2 types - price correction as well as time correction ( price just moves sideways and frustrates the investors) .And may be during this sideways corrections, it may go down to 145 levels.
As per the chart, it seems to be in time correction as of now. Market as well as sector sentiments are neutral to negative territory.While it may move up and down for sometime, but it needs to cross few key levels to show the start of next impulse.
So currently it is all about wait and watch.

Disclaimer :This post is just a for learning a method. Views are personal. No buy/sell recommendations. These are probability study methods and chances of success depend upon various factors.
5 Likes
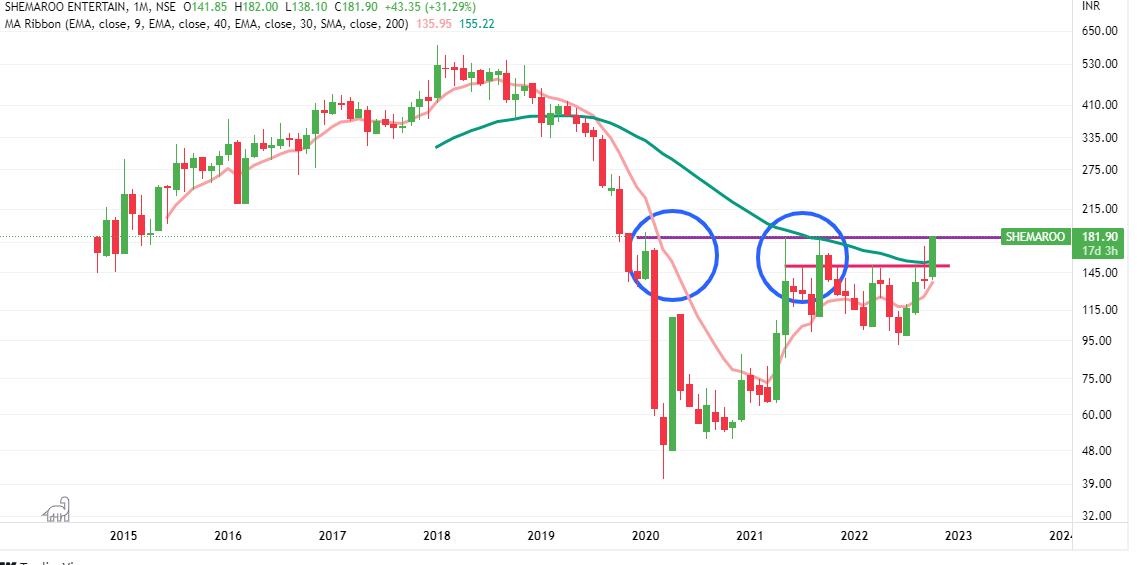
Shemaroo
CMP-172
This is just an example to track on what happens when a stock crosess 40 months moving average (MMA) after years.
Normally longer the period under 40 MMA , then a breakout above it , more the chances of it to become certain X .
This stock was trading below 40 MMA for 3 and half years.
Other observation here is what happens to a stock when it crosses and close above buying climax or effort to bring down candles ( big upper wick -in blue circle) - the top of these candles has been marked by a purple line.
Keep tracking - what happens to a stock when it moves above 40 MMA after years, you would learn lot of things in coming months.
Monthly Chart
Disclaimer :This post is just a for learning a method. Views are personal. No buy/sell recommendations. These are probability study methods and chances of success depend upon various factors.
3 Likes
Invested in this one…n i kinda agree broadly with ur count…
i have accumulated it near 420 levels and will accumulate more if it comes down there again as my scenario is for a decade (the stock is fundamentlly good too)
would love ur viewpoint on jubilant ingrevia too bro…
1 Like
Hi,
Could you please give your views on anand rathi with EW perspective. Thank you
Hari
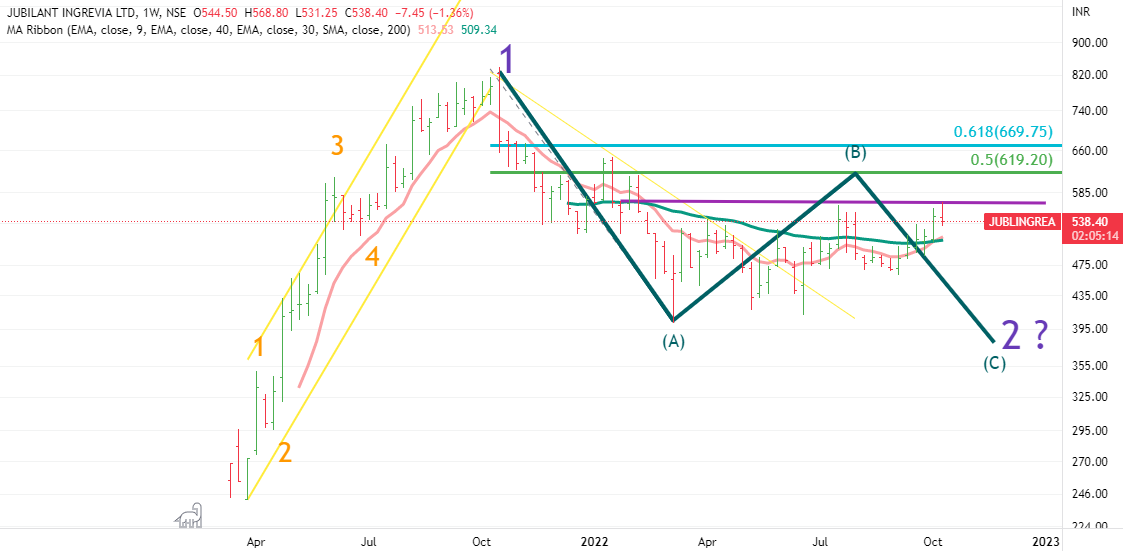
Jubilant Ingrevia
Chart is similar to Foodworks.
B wave is in progress. Resistance levels are marked in different color lines.
How far C would go ? Well it would dend where wave B bounce ends.
Disclaimer :This post is just a for learning a method. Views are personal. No buy/sell recommendations. These are probability study methods and chances of success depend upon various factors.
3 Likes
The chart has very small history so EW won’t make much sense here. And we generally avoid those stocks which have not gone through a bear market.
Tesla
CMP 205
We covered this stock in April , The stock was at 876 ( it was split 1:3 ,so as per current calculation ,it was at 292) . Our projection was that it should go to 700 ( 233) in first phase of the fall.
Now it has already crossed the first phase of fall . Let’s see where it would go from here.
As per monthly chart, it is currently at 40 months moving average ( month is yet to close) . If ot breaks this level, then next stop can be between 180-185.
And of it breaks that level also ,then the next stop would be very crucial- that is near 160-165.
160 -165 is an important zone -
a) It is lower end of monthly Bollinger Band (bit dynamic level as it keeps changing as per the price movement)
b) This price zone is also at the level of 61.8% Fib- retracement of the whole 3rd wave that statred in 2019
c) This is also the zone where A=C
Monthly Chart
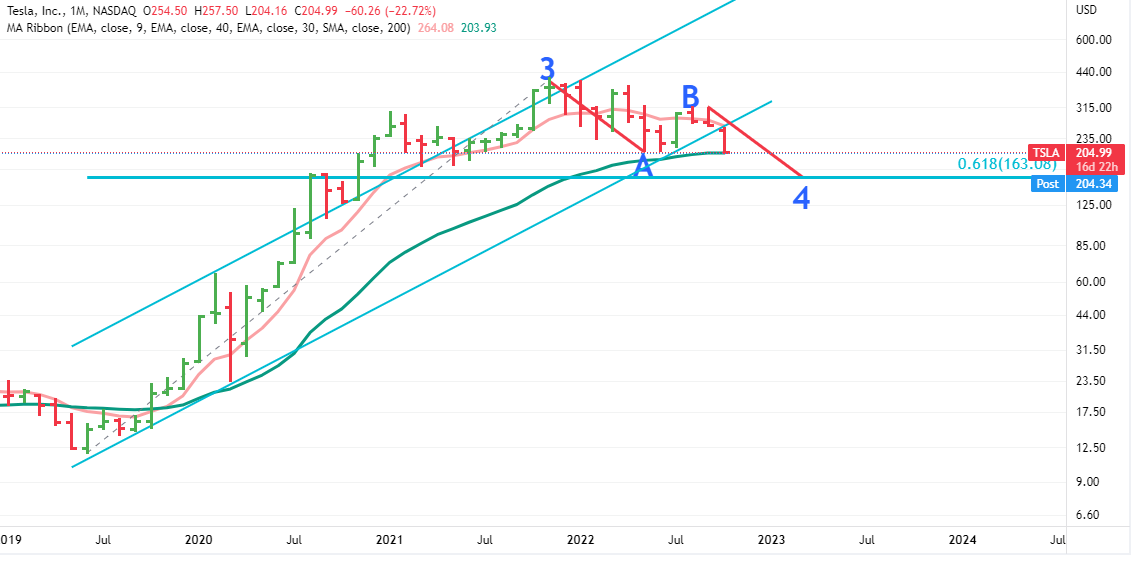
Keep in consideration that it won’t happen overnight . Currently it is at lower end of weekly BB and Nasdaq might start B wave bounce anytime so it might fall a little more and then can move up a little (225-250) before strating its next leg of fall.
Disclaimer :This post is just a for learning a method. Views are personal. No buy/sell recommendations. These are probability study methods and chances of success depend upon various factors.
3 Likes
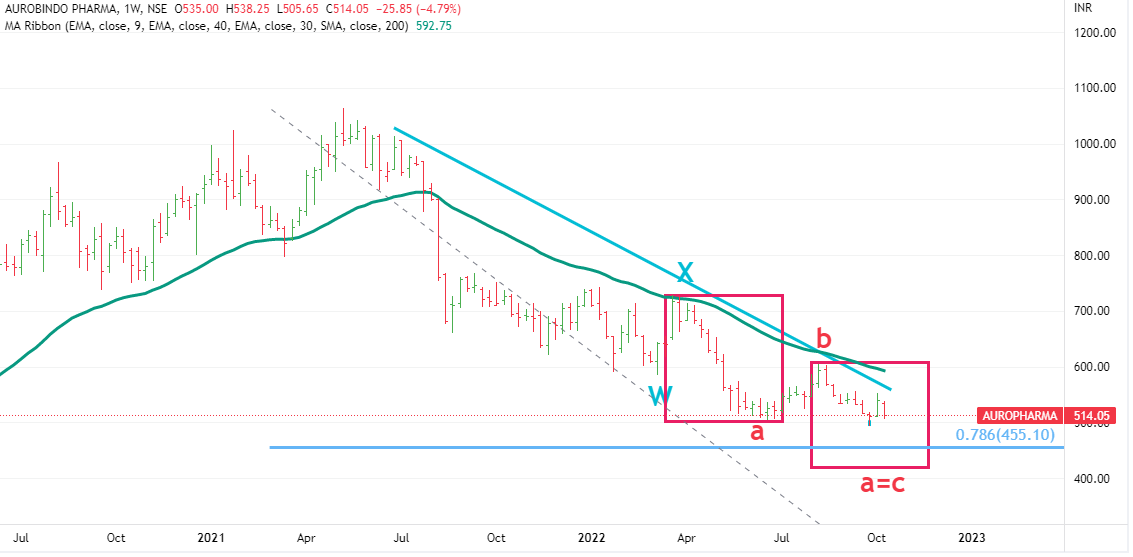
Can you do Long term outlook on Aurobindo Pharma? Its trading below 40 MMA
Aurobindo Pharma
CMP 514
It seems to be one of the weakest stock in pharma sector .
Downfall can continue in coming weeks . Can go upto 78% of Fib -level retracement of whole rise from March 2020 . If it does not stop there , then A=C is the target .
It is a weekly chart so it might take time to play out as per this projection ( if this plays out!)
Weekly Chart
Disclaimer :This post is just a for learning a method. Views are personal. No buy/sell recommendations. These are probability study methods and chances of success/failure depend upon various factors.
2 Likes
Hi,
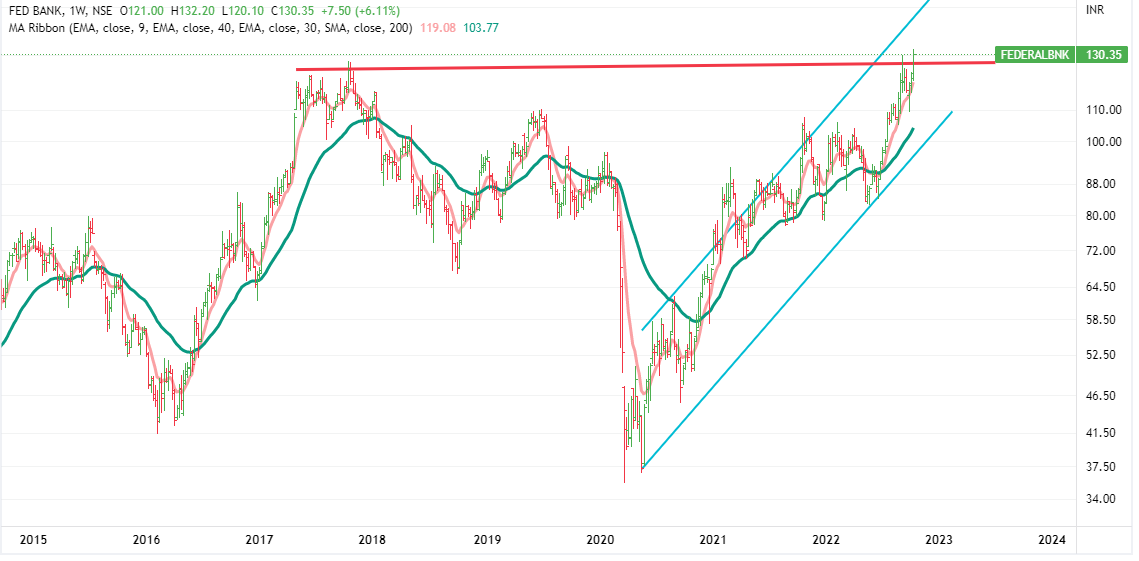
I have learned a lot from this thread thank you for that. Can you please give your views on federal bank. Federal bank chart looks strong, it gave a multi-year breakout on friday also came up with good set of results. Can you please give your views with EW perspective. Thanks.
Federal Bank
Like many other banks, it is on a roll for last few months.
It is all time high as of now and has enetered in blue sky zone (that means no resistances on left).
If one invested in it recently , should trail it with 20 DMA and 40 DMA and can remain invested till it breaks these key averages.
Long term investors can trial it with 20 WMA and 40 WMA.
Disclaimer :This post is just a for learning a method. Views are personal. No buy/sell recommendations. These are probability study methods and chances of success/failure depend upon various factors.
1 Like
Next Few Weeks
It seems that we might see a bounce in global markets in coming 2-3 weeks and that might result in a counter trend rally in India too.
Bitcoin
It is a global liquidity indicator off-late. Any bounce in this signifies that people are getting interested in riskier assets.
We see a double bottom being formed and clear divergences on RSI and MACD. That may result in a temporary bounce.

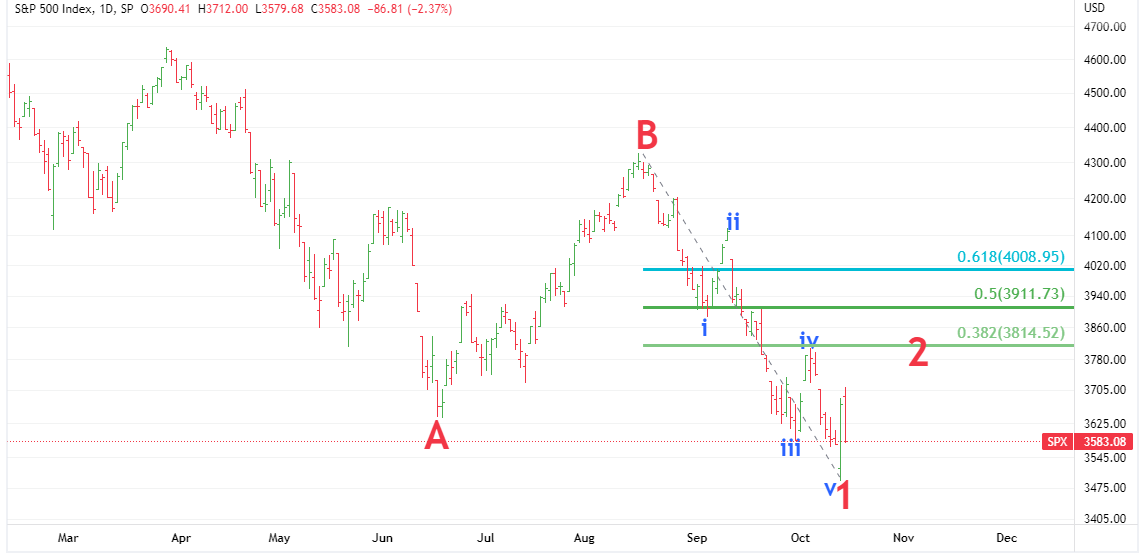
DOWJONES ,S&P500,NASDAQ
All seem to be completing wave 1 ( downside ) of C and a bounceback in wave 2 might happen.
DJI
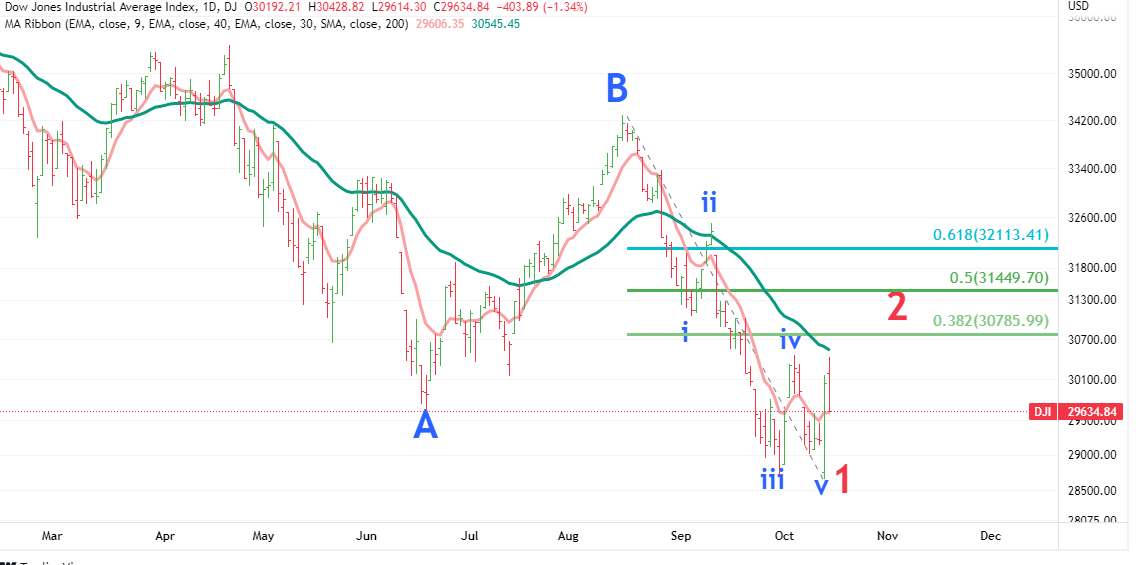
S&P500
Nasdaq
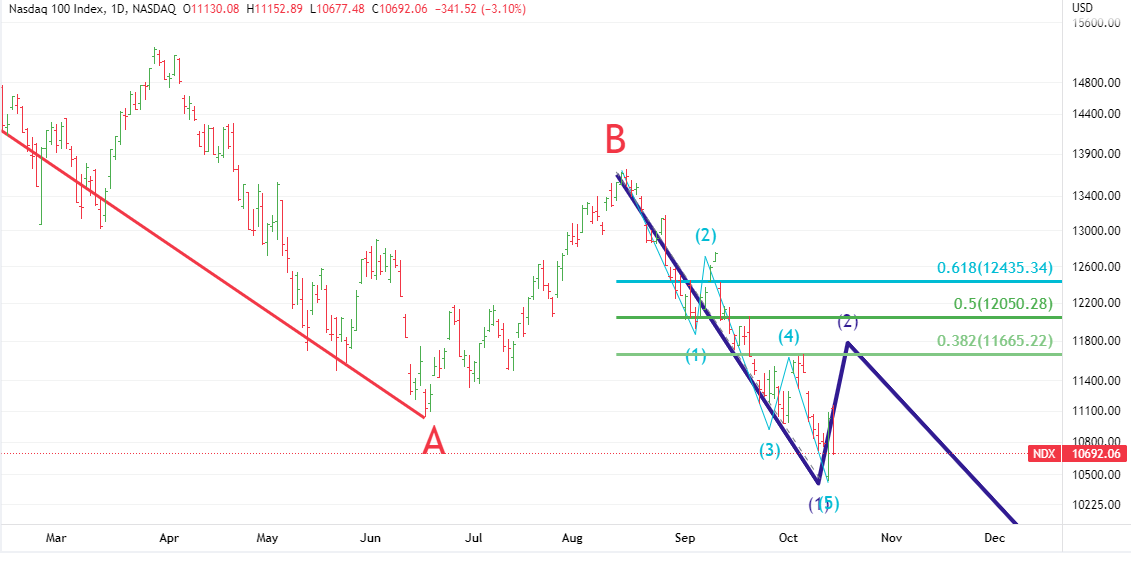
In short, there might be some flow of good news or a bear -exhaustion rally ( that means bear have got tired after so much selling)
Let’s keep a close watch in coming days. If that happens ,we can see a 600-900 points counter-trend rally in Nifty also .
Disclaimer :This post is just a for learning few methods of price-patetrns. Views are personal. No buy/sell recommendations. These are probability study methods and chances of success/failure depend upon various factors
5 Likes
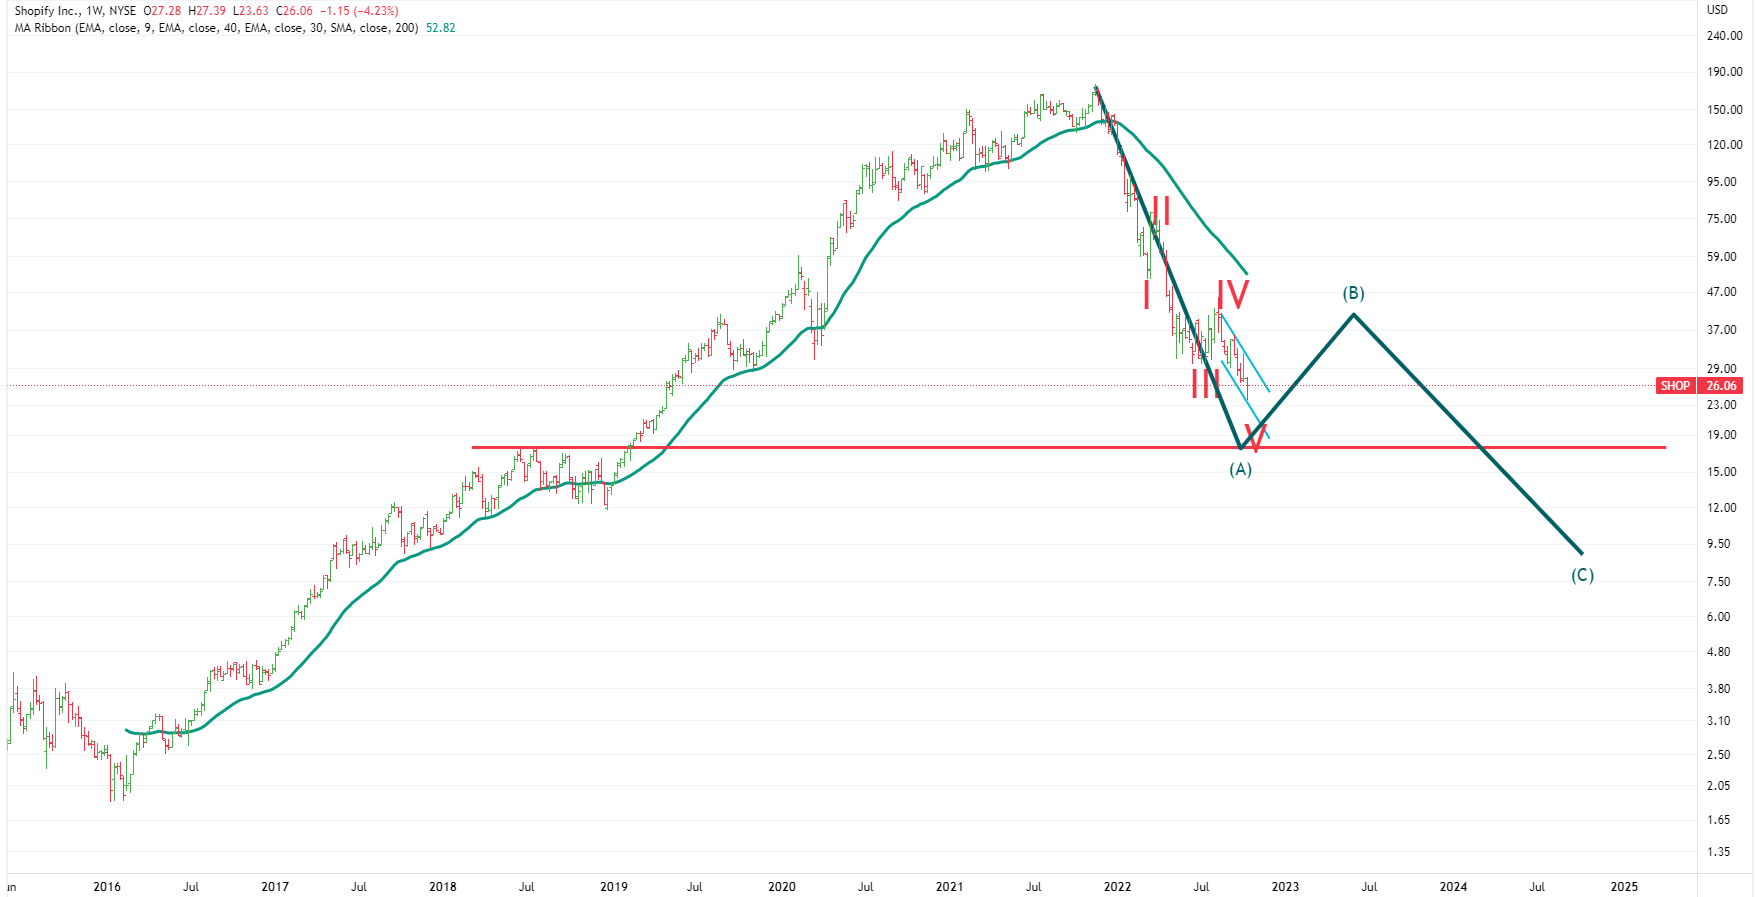
Shopify -Follow-up
CMP 26
The stock was split 1:10. In April, covered it at 428 (i.e. 42.8 as per current structure) and projected it to go near COVID-low ie. 31.2 .
Well it has gone beyoond that .
Currently it seems to Vth of wave A. Some more space is there for Vth to be completed.
Then a B wave bounce should follow - or if broader US markets start counter-trend bounce, it can complete Vth here only (Vth waves many a times don’t achive their targets).
Once B wave bounce is over then C wave down should follow. How far C wave would go would depend how much B wave bounce happens.
We can project C wave targets but many a times we ourselves get scared of absurdity of our projections (absurdly high or absurdly low ) . Hence we would avoid to project any price (down -level ) at this juncture.
Just compare it with the prices of stocks of online retailers in Indian market e.g Nykaa . May be Shopify’s valuation is telling something to us !
Disclaimer :This post is just a for learning few methods of price-patetrns. Views are personal. No buy/sell recommendations. These are probability study methods and chances of success/failure depend upon various factors
1 Like
Just a gentle reminder.
5 Likes
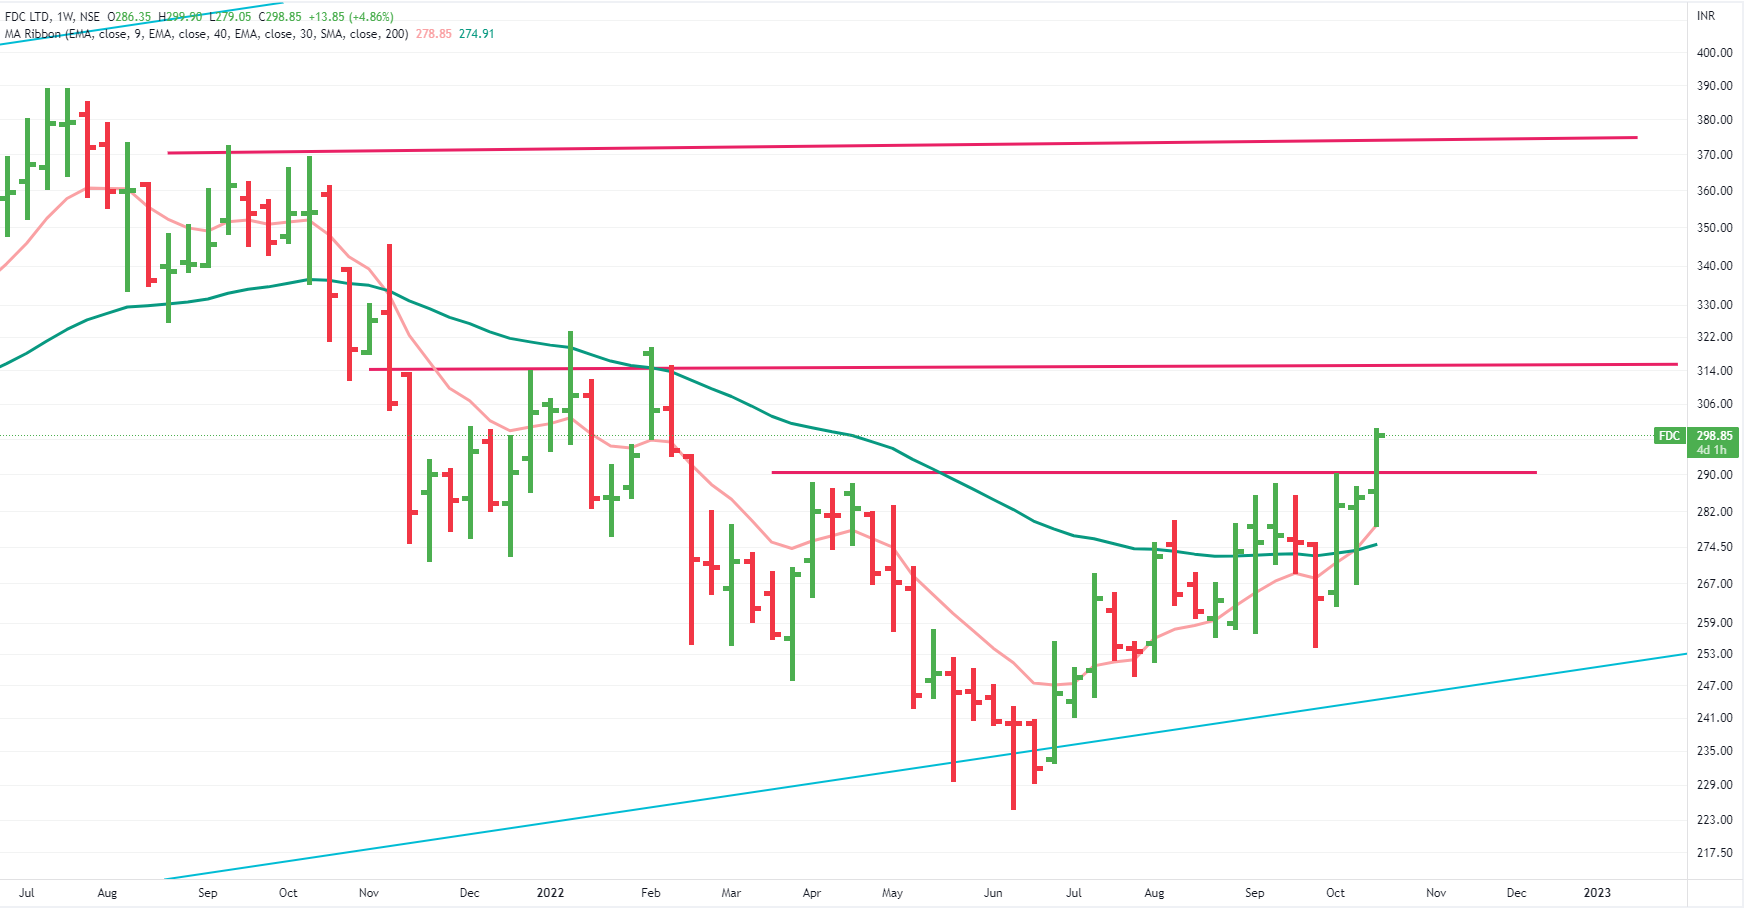
FDC
1ST trading range crossed today…next trading range is the hurdle now.
And it is just start of the week, hopefully it would close above these trading-range hurdles on weekend.
Took inital position.Would add if it closes above it on weekend or crosses the 2nd hurdle (red lines)
Read the above mentioned Granule post to understand stage investing.
Weekly Chart
Disclaimer :This post is just a for learning few methods of price-patetrns. Views are personal. No buy/sell recommendations. These are probability study methods and chances of success/failure depend upon various factors
3 Likes
@StageInvesting How about GPIL?
Dear Sir, which stage would you put Tata chemicals, bajaj finance and HCG?