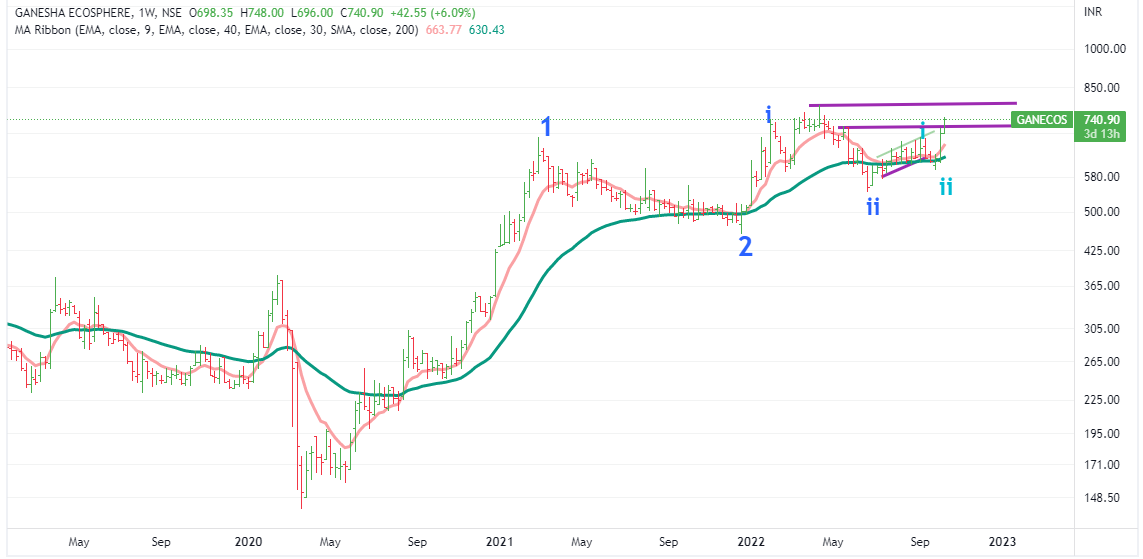
It seems fine as per stage analysis. It has crossed first trading range (but it should close above the same on this weekend). But if we were at your place, we would take intial postion here.
Then there’s another trading range,near 790 (both trading ranges marked in purple color line). Once it closes above the 2nd trading range,then we would start riding over it .
Stock looks ok wrt volumes. Also daily /weekly/monthly MACD , RSI reading is currently in favor of an uptrend.
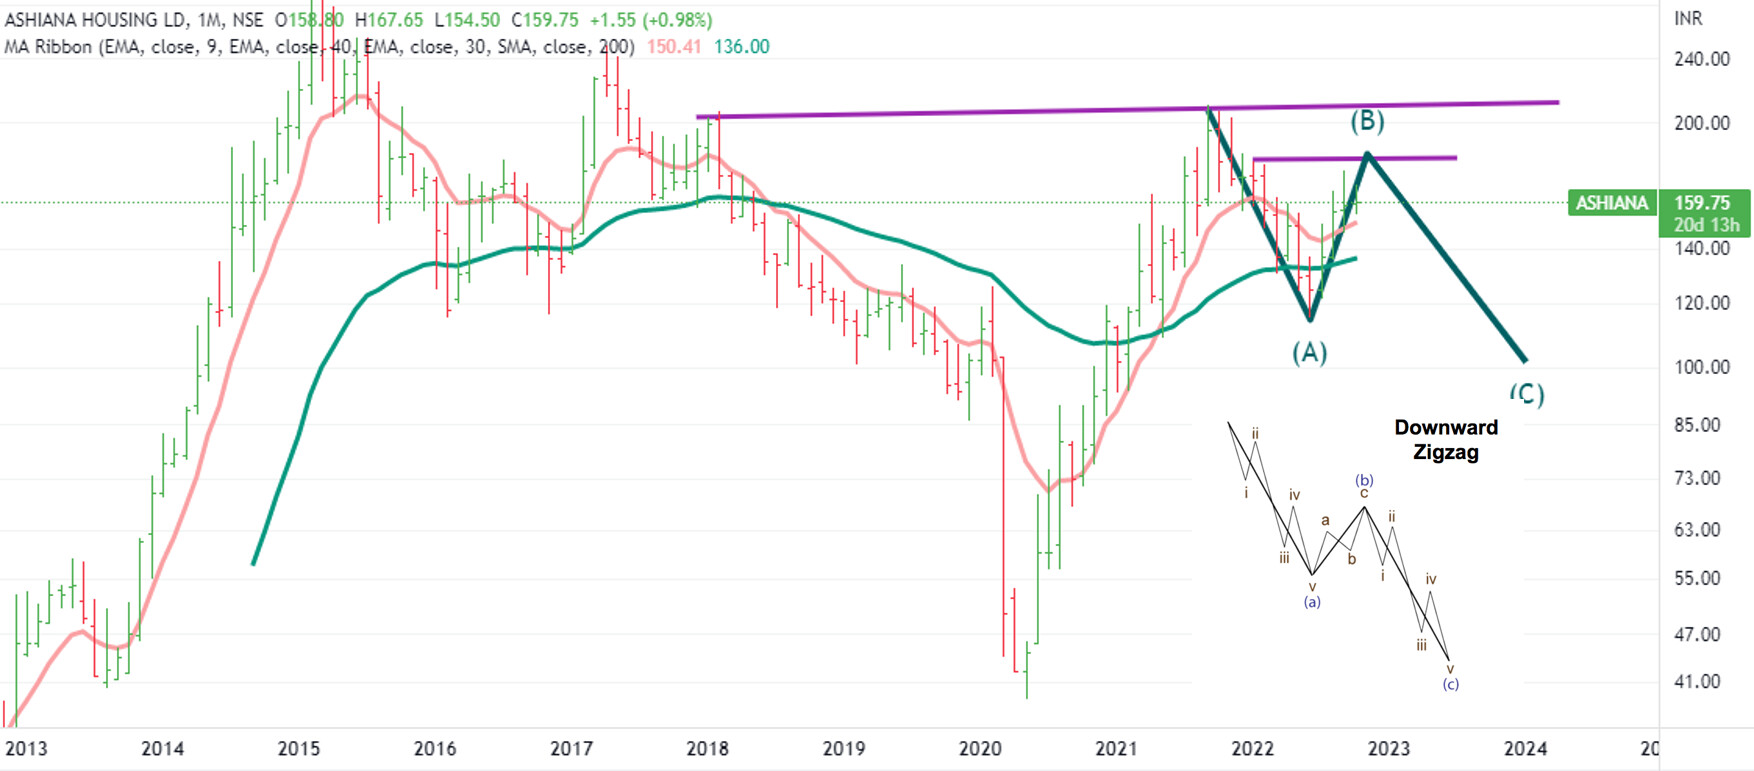
Ashiana Housing
This stoock does not give much confidence as of now.
There are many resistances looming over it ( 2 immediate resistance are marked in purple lines here)
On monthly chart, the recent decline looks like 5 waves decline (A wave ) and now it is bouncing in B wave. C wave (downward should follow).This might come out as Zig Zag correction. Monthly Chart
( keep in consideration that this is monthly chart, so it would take time to play out)
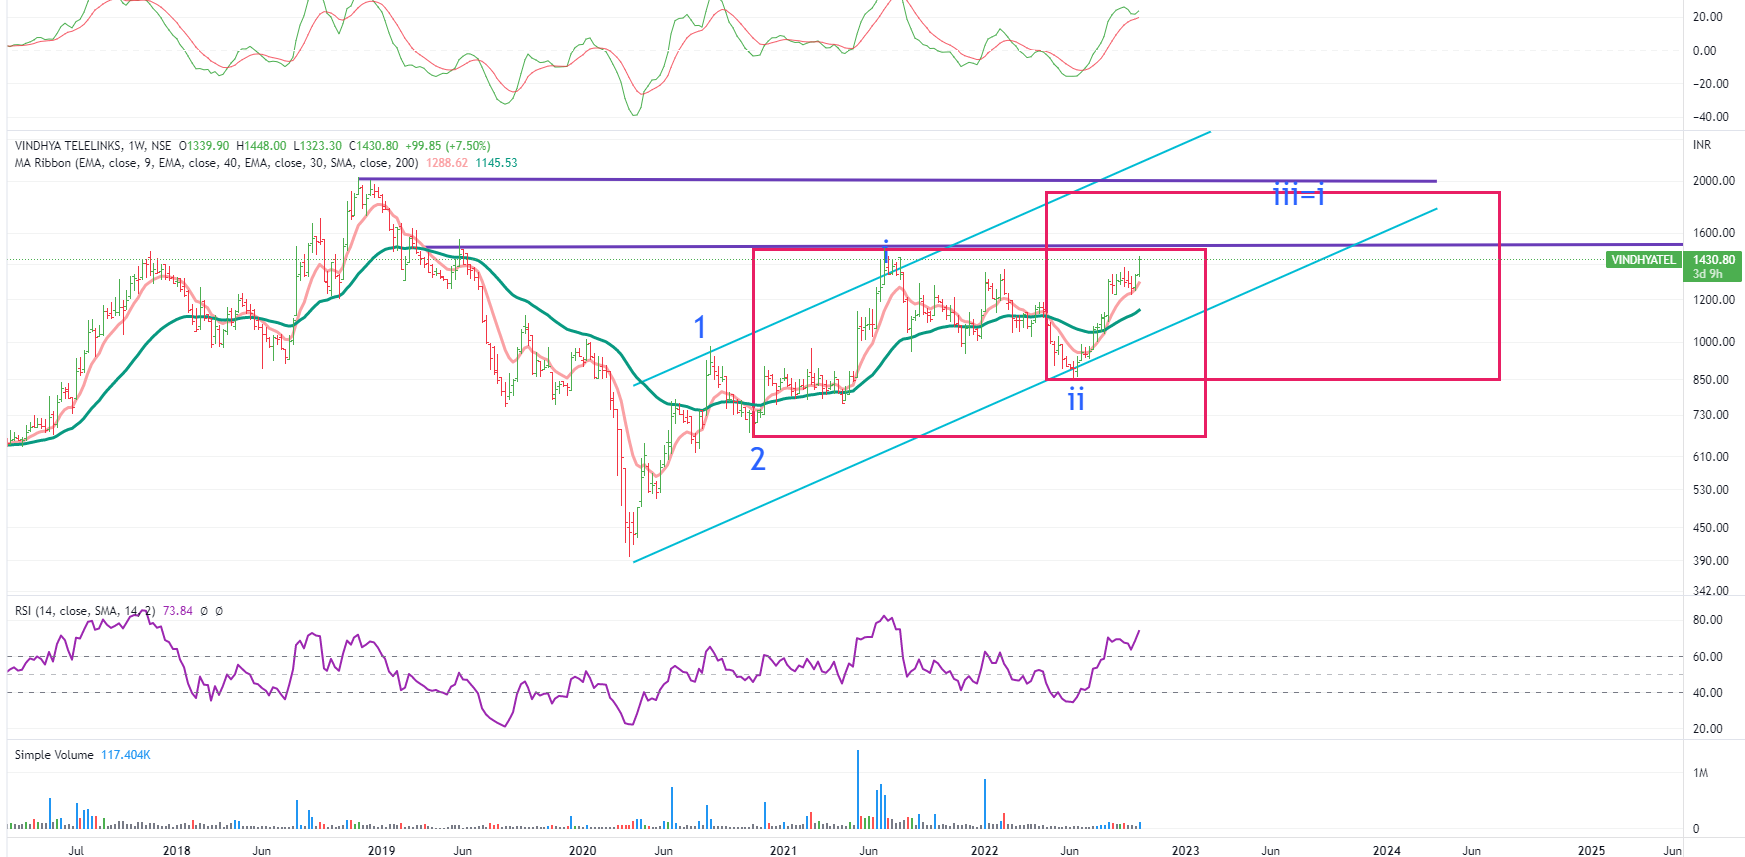
Triton Valves
This is very micro cap company. So would avoid to comment on the same as prices of these kind of small companies are easy to manipulate.And other fact is that it is very difficult to exit these kind of stocks due to low liquidity when things become bad . Disclaimer :This post is just a for learning a method. No buy/sell recommendations. These are probability study methods and chances of success depend upon various factors.
Well ,the company has some chequered past and it also seems to be a partially holding company . Its own EPC busines has long runway ahead but cash-flows in the past have been bit questionable !
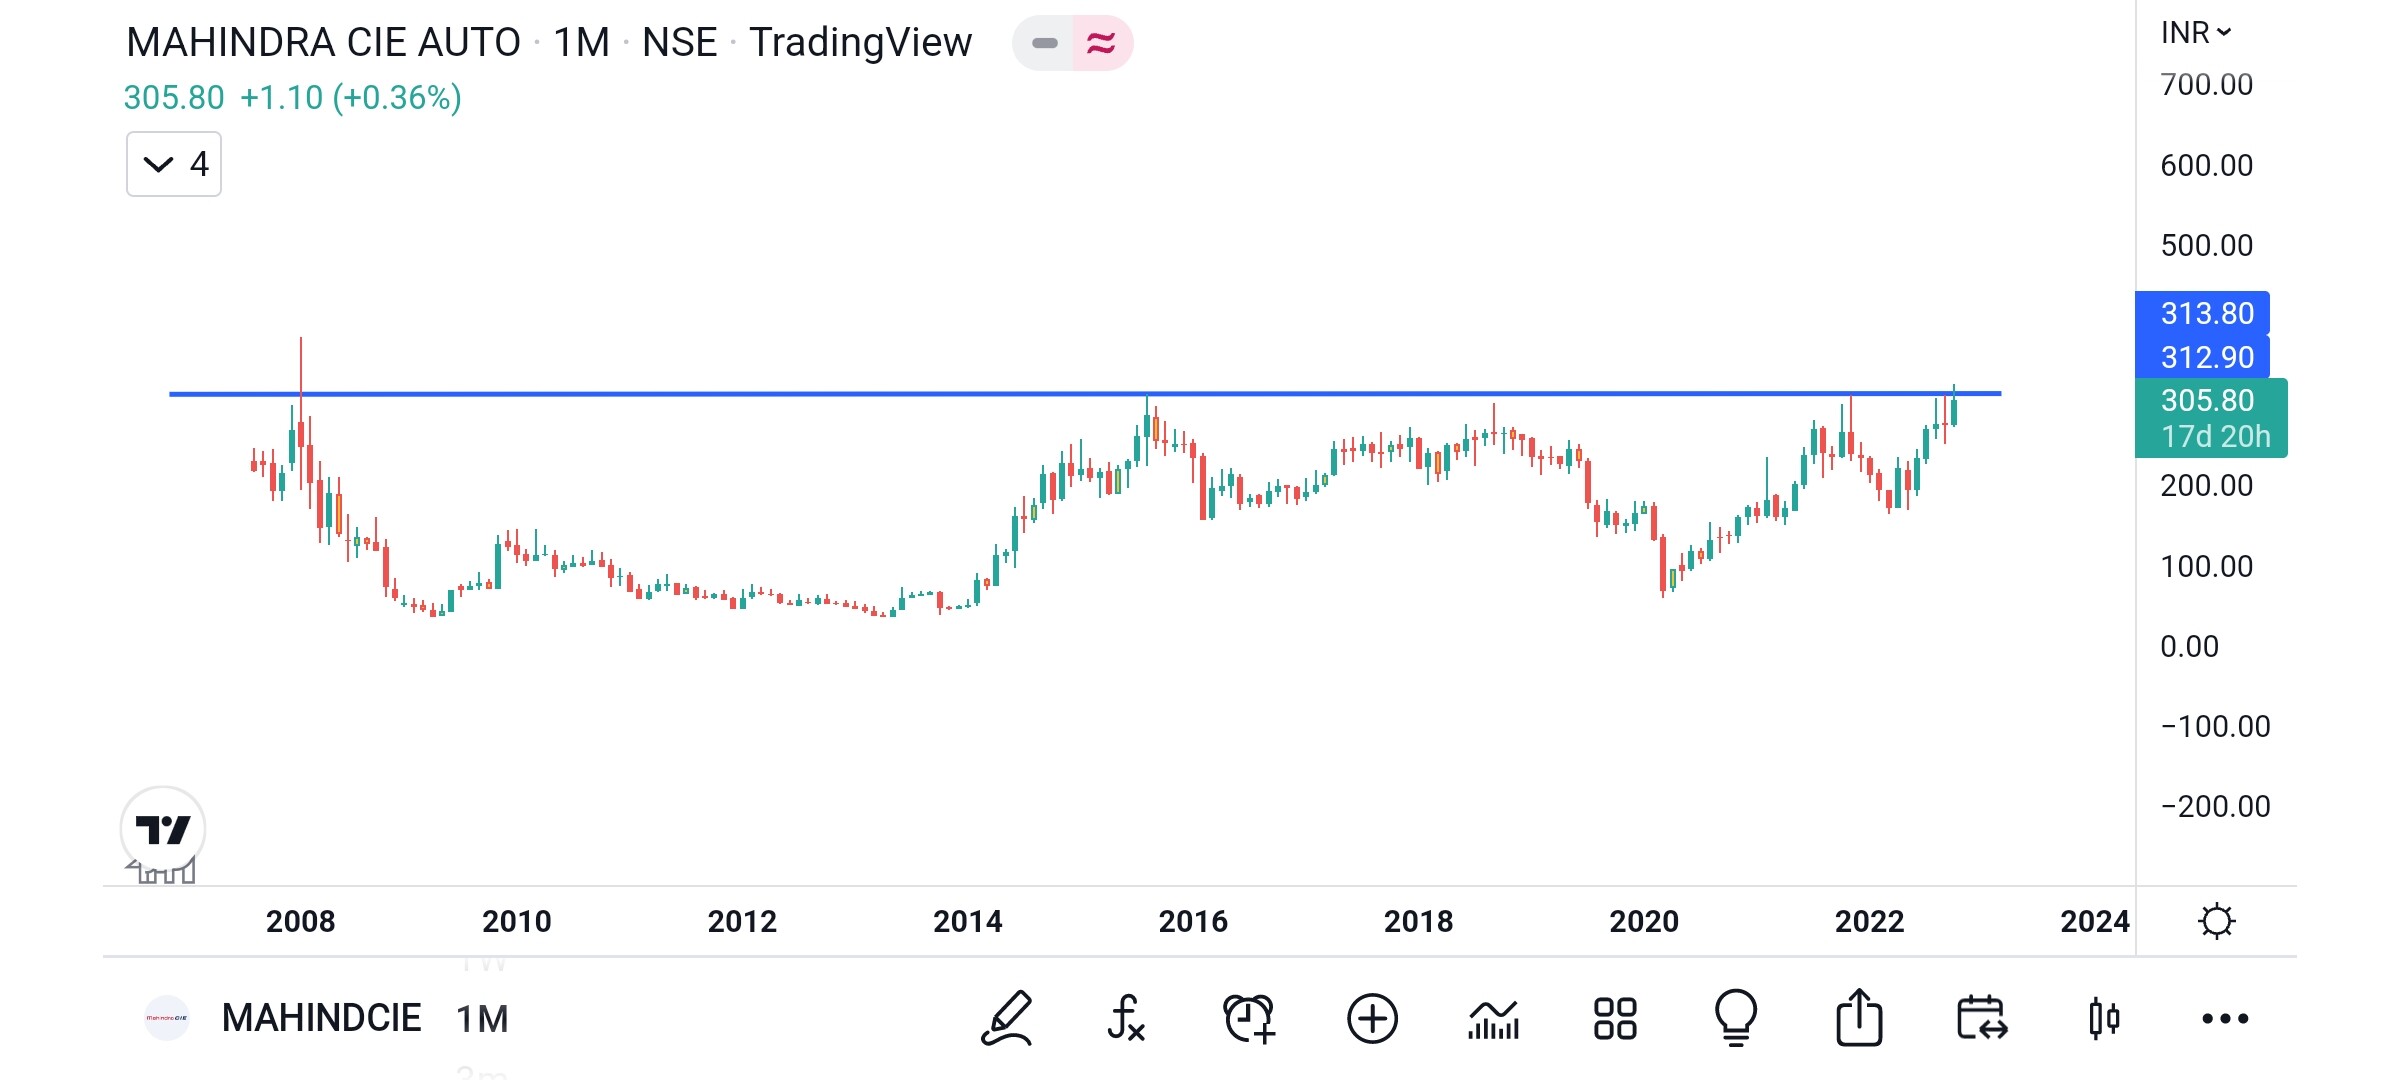
On charts, it is at key resistance level, near 1500 - as market by purple line .
If it is able to cross and close above that we might see a good appreciation in the price.
It ticks well on all other indicators e.g. RSI, MACD etc. Volume is yet to pick up - let’s see whether that happens in this week.
Let’s see whether it progresses well in S2 after crossing the trading-range that has upper level of 1500.
Disclaimer :This post is just a for learning a method. No buy/sell recommendations. These are probability study methods and chances of success depend upon various factors.
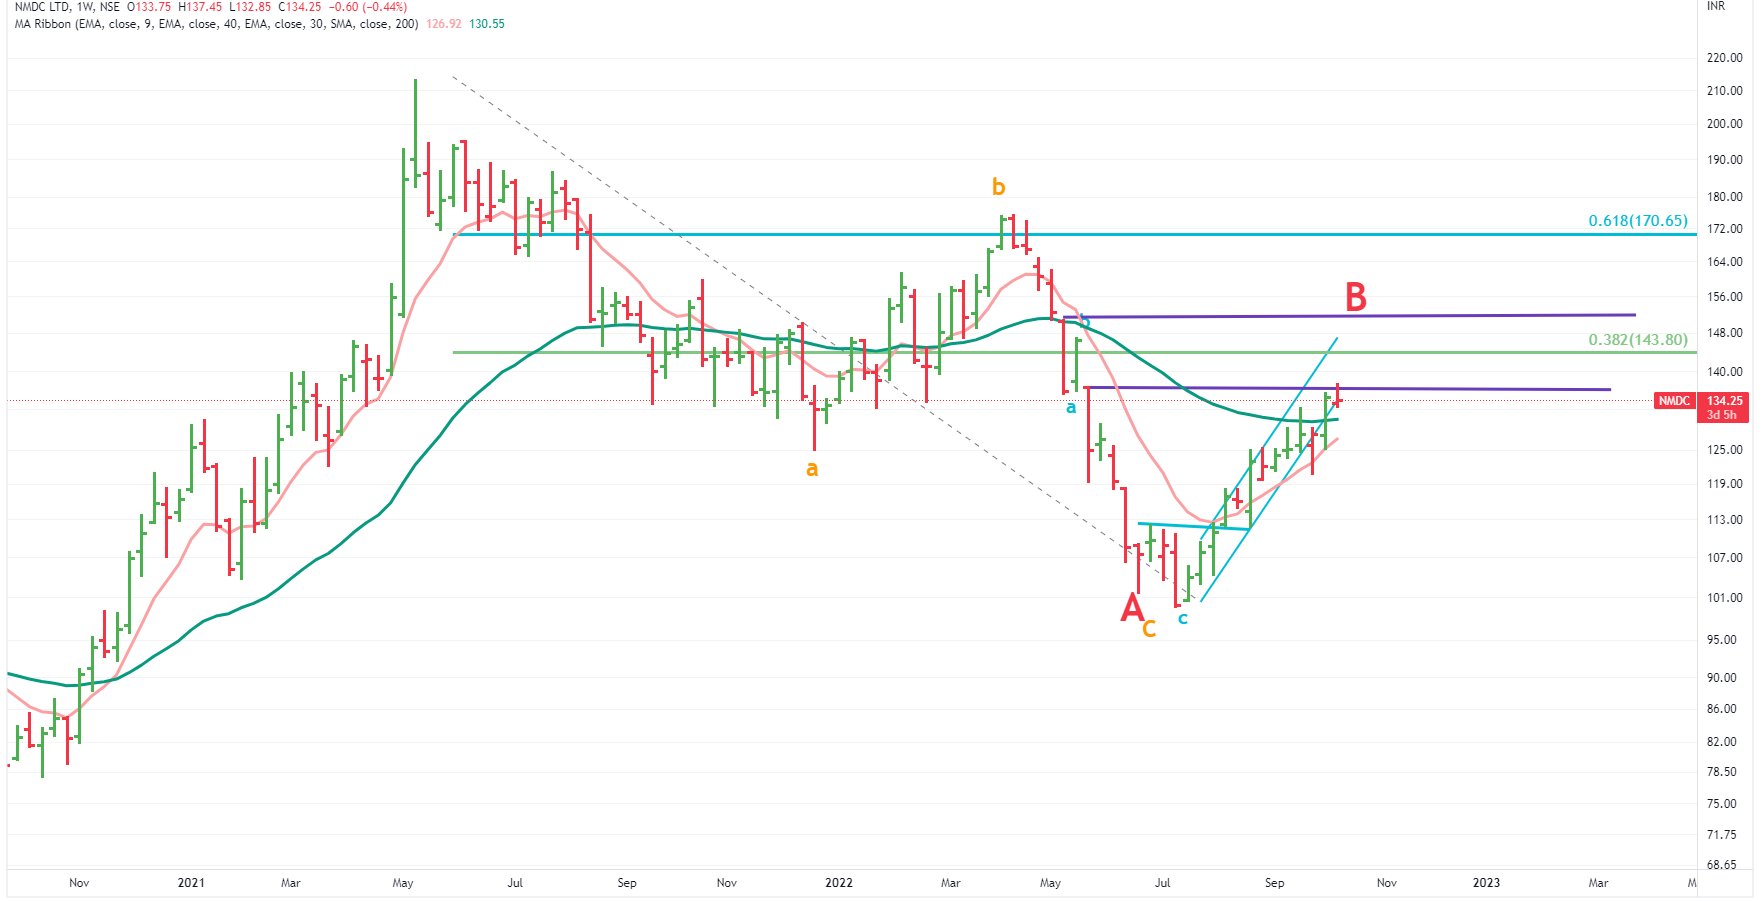
a) Markets are overall choppy , so all set-ups are facing some challanges.
b) The recent bounce B can’t be counted as a clear impulsive wave, so we’re assuming that it is just B wave bounce.
Now B wave bounces can go to any levels - 38% ,61.8% or they can stratch longer.
If it keeps crossing all the hurdle-lines - one can keep riding and can exit if the price starts turning back. It is still not in a sit and sleep phase.
From our understanding, if one understands trailing methods, he can trade . But for long term investment ,it is not ready.
It can turnback from where it is today or from next purple line or from other lines (marked on the chart)
Disclaimer :This post is just a for learning a method. No buy/sell recommendations. These are probability study methods and chances of success depend upon various factors.
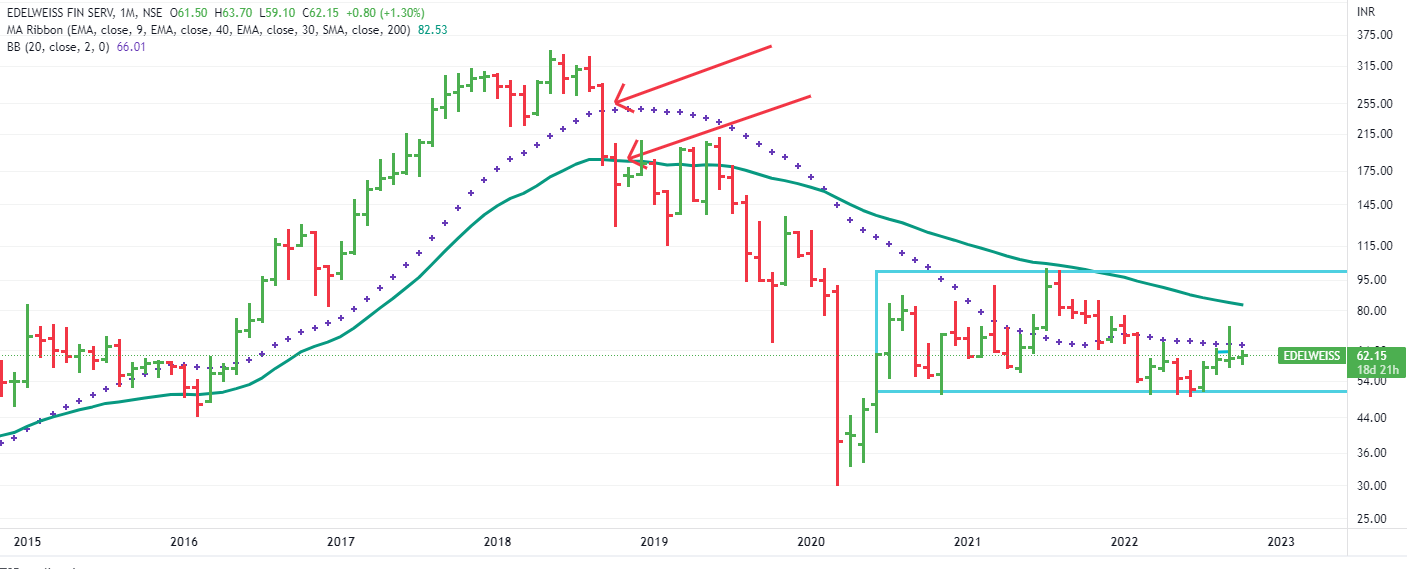
Well, can’t comment on short term up and downs ( It may bounce a bit in short run as IT and related companies are in falling -zone since last many months), but it seems very bearish in long term.
Look at the red candles ( Jan 22) and buying climax candle in April. Big hands have exited the stock . And now top of these candles would act as resistance whenever price tries to move up.
Untill and unless big money comes back, the chances of it to go back old ATH seems very low.
Also stock is at lower level of recent rising channel (red arrow) , need to watch-out .If it breaks this channel , then chances are that it would go below 40 WMA. That would lead it to much lower levels.
Disclaimer :This post is just a for learning a method. No buy/sell recommendations. These are probability study methods and chances of success depend upon various factors.
Truly appreciate your efforts of sharing and teaching us technicals in such an easy way along with examples. I wanted to know your view on Tata Consumer as it has gone down 30 ema on weekly charts and might close below that.
Thanks for your kind comments. Our effort is to ugrade everyone to at least basic levels of technicals- studies . It is well appreciated across the globe but somehow in our country , it is considered to be something related to trading. But we want to show that its scope is much larger and even fundamental investors should have some basic hang of it.
This week is crucial . It has already gone below 40 WMA, if it closes below that then either price would go down further or it can linger below 40 WMA for long period.
Other thing is to watchout is lower trendline (orange), if it breaks that also then downward movement is confimed.
Also have a look at big red bars (in blue circles), price always gets rejected from the top of those red bars.For any significant move in future, these are the hurdles to be crossed.
Price is taking a support at 20 months moving average (dotted purple line) for last few months.
A close below trendline, 40 WMA and 20 months moving average ( check on month-end) - all these things are quite nearby. If it breaks these levels,it can easily enter 650-700 zone.
So our choice would be to stay away , get some popcorns ,enjoy and see how it behaves on these cliffhangers.
Disclaimer :This post is just a for learning a method. No buy/sell recommendations. These are probability study methods and chances of success depend upon various factors.
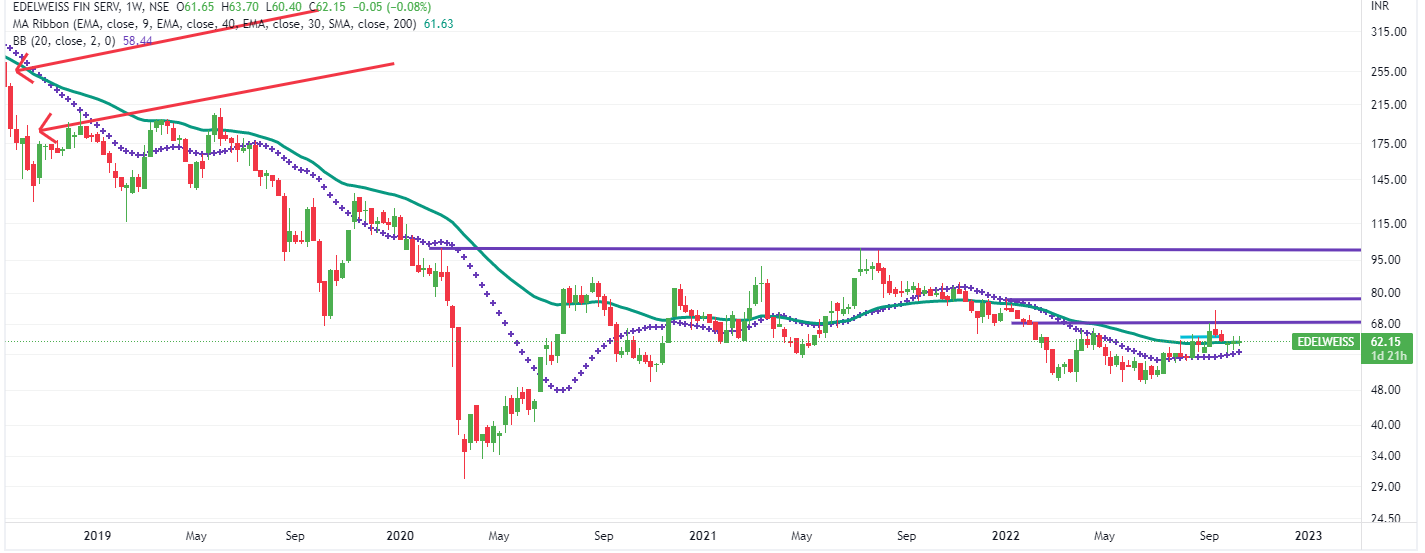
Well, this stock had a kind of a happy run from 2012 to 2018 and after that it went into oblivion.
This chart re-emphasises on our often repeated warning signals.
Once a stock starts closing down 20 months moving average for few months, start assuming that either something has changed fundamentally or some large investors have shunned the stock or some problem exists in overall markets.
And once stock starts closing below 40 months moving averages, this gets further cemented.
For a long term investor, these are good time to fullly or partially exit.
Red arrows mark the price moving below 20 MMA , 40 MMA .
For any long term upmove , the stock needs to close above 40 MMA for few months. Monthly Chart
Poor people like us should stay away from this stock untill we get any clear signals. We have limited money and we can’t let it loose its value due to inflation and waiting in these kind of stocks.Investing in these kind of stocks at this stage , and then waiting is a rich man’s game.
Poor people like us can’t live on hope !
Disclaimer :This post is just a for learning a method. Views are personal. No buy/sell recommendations. These are probability study methods and chances of success depend upon various factors.
One is basing his decisions on making assumptions on business -growth based on the balance-sheet of the company and other one is trying to asses the future on price & volume movement of the stock.
It’s only called called speculation when you disagree with someone else’s bet.
And on a bigger picture- every decision in your life that’s made for any expected-outcome in future is nothing but speculation.We all speculate every hour ,every day , every week !
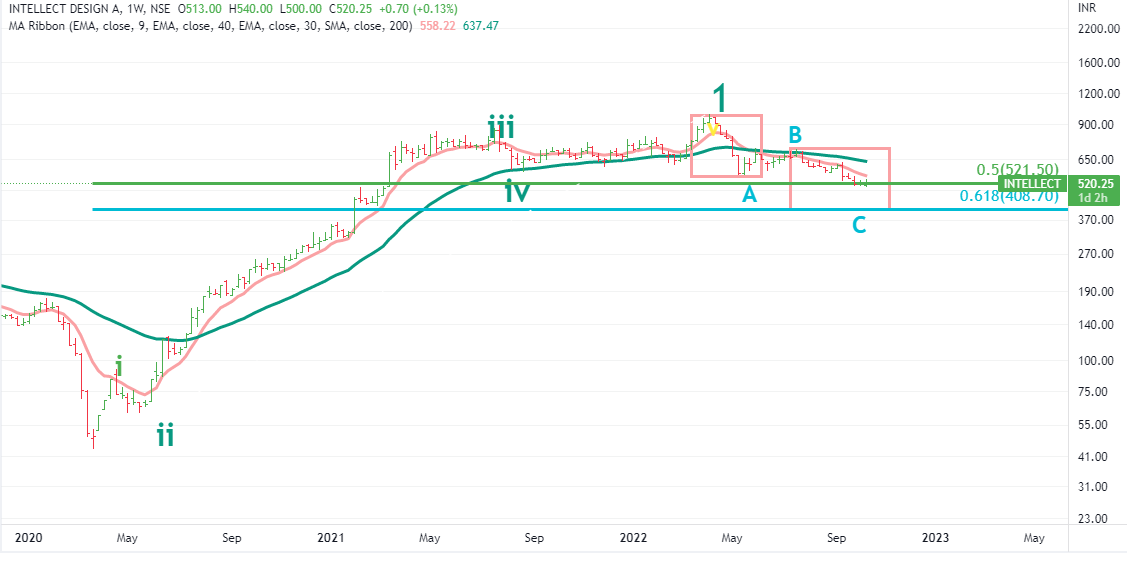
Keep in consideration that we are not talking about short term ups and downs. Our view is for 3-6 months horizon.
It currently at 40 months moving average level. If it breaks from here , it can do 38% to 61.8 % retracement of the whole rise from March 2020. That means it can anywahere from 470 to 410 leavels .
Btw A=C also happens at 61.8% . And that is the worst case scenario as per current wave structure.
In short - one has to be very very cautious. Weekly Chart
Disclaimer :This post is just a for learning a method. Views are personal. No buy/sell recommendations. These are probability study methods and chances of success depend upon various factors.
Dear Sir, thank you for sharing your knowledge on this forum. It has been an excellent learning experience. Can you share your analysis on Jubilant Foodworks. In my view it is at an inflexion point right above 50 & 200 EMA. Would be interesting to read about your analysis. Thanks in advance.