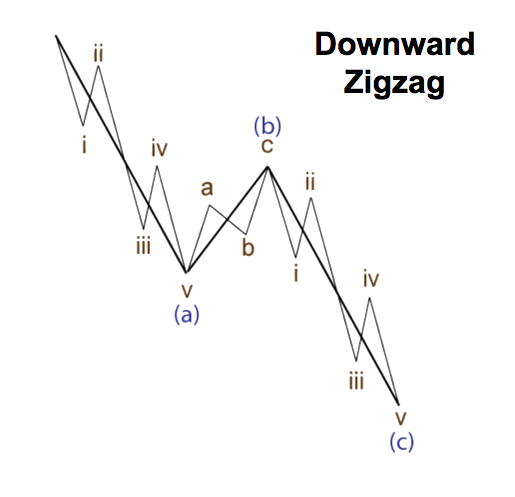
How an EW practiotioner rides a long term compounder.
Let’s learn by examples .
KRBL
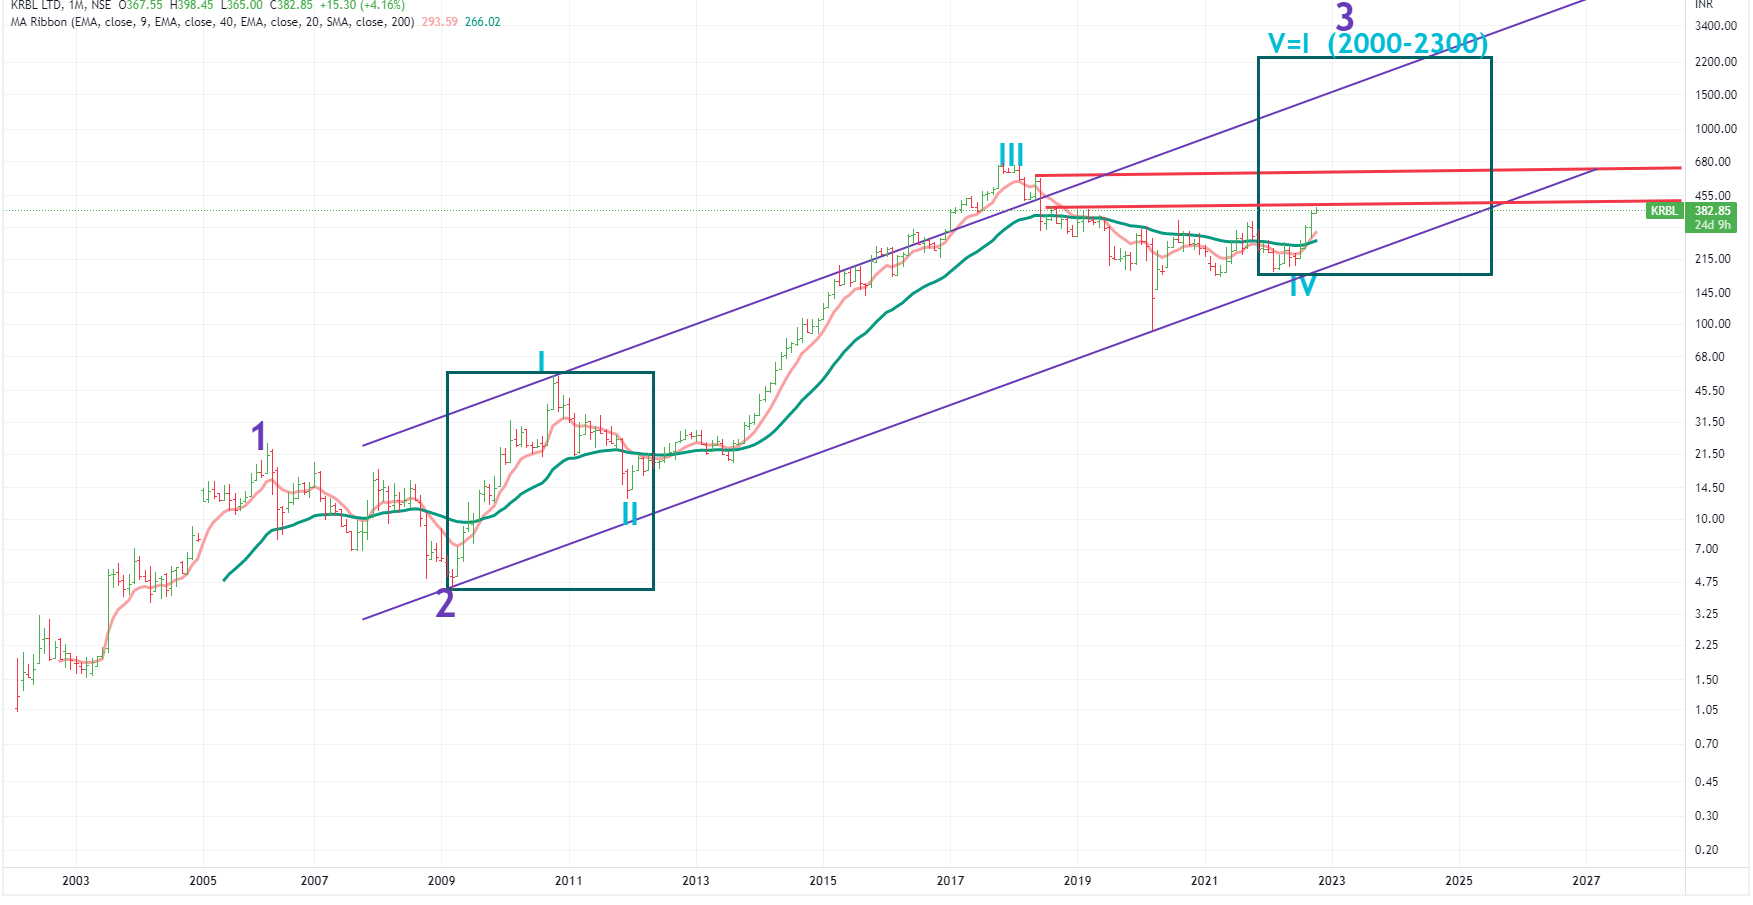
The following is a monthly chart.
Readings of monthly charts play out in months and years so this is not for short-term investors
As per this ,KRBL is in wave V (maked in sky-blue) of bigger wave 3 (marked in purple) .
This shows a lot of potential and can go near to 2000 and then it might correct in a big way in wave 4.
Keep in mind that it does happen in days and weeks -it takes years. Check how much time Wave III took? From 2011 to 2017 -6 years 9from 13 to 628) !So this is not for traders.
An EW practioner tries to find these stocks at an early stage and then trails it by long term moving averages. For example, in this long term investment- one would follow 40 Months moving average (green line). Multibaggers journeys are never in straight line.
In wave III, the stock went to 628 and then stated correcting in IV. It broke and closed below the 40 MMA in June 18 , the price was at 350. So either a long term investor can exit fully ( it went down to 95 after that ) or he can exit partially as it has a still long way to go and he has lot of margin of safety if he entered at the start of wave III (somwhere near 14 -30 levels).
In coming months - we are at a key resistance level as of now - lower horizonatal red line.( range of 390-410) . If it starts and closing above that range on monthly levels - then after a retest , we might assum that upward journey has begun- next level of resistance is near 590-600.
Wave V wont be stright line - as every wave has 5 waves within- so up and down price movement would continue.
Once we take broader view,we track our entry points on daily/weekly levels as wave structure . At the same time, we keep a watch on fundamentals of the company - they need to show consistent ,above-average performance if stock has to move successully.
Disclaimer :These are just probabilty studies. Price movement of a stock depends upon several factors- fundamentals of the company, market/sector conditions etc etc. Please dont take it as a buy or sell recommentaion.
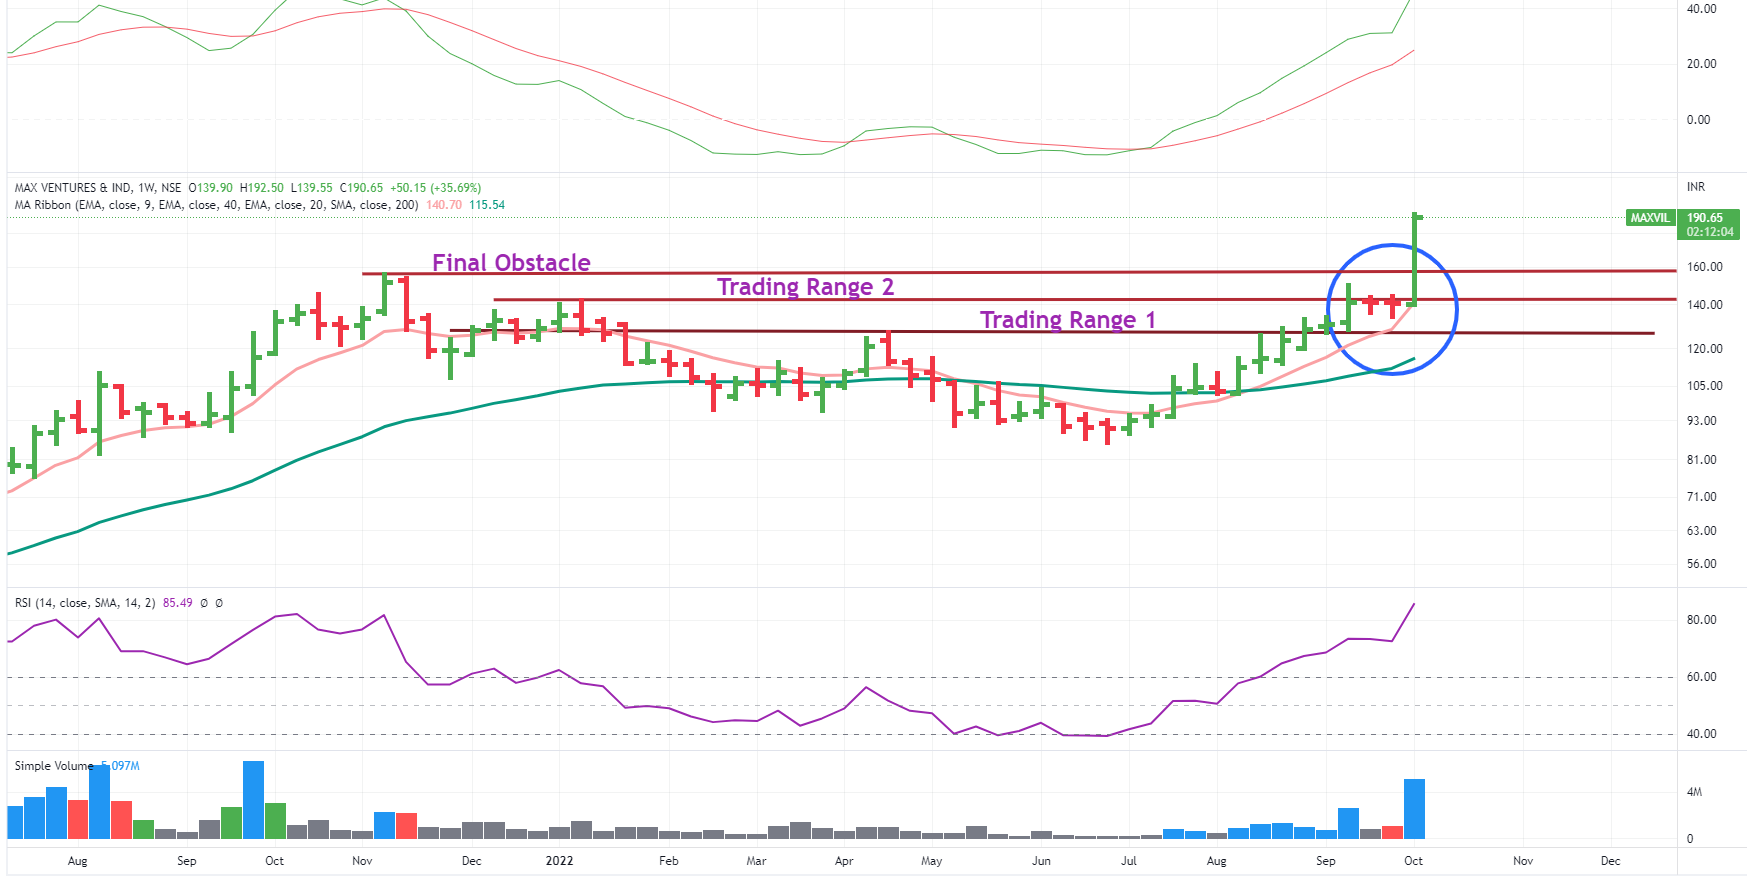
MaxVentures
Sometimes the S2 movement starts in a jiffy.
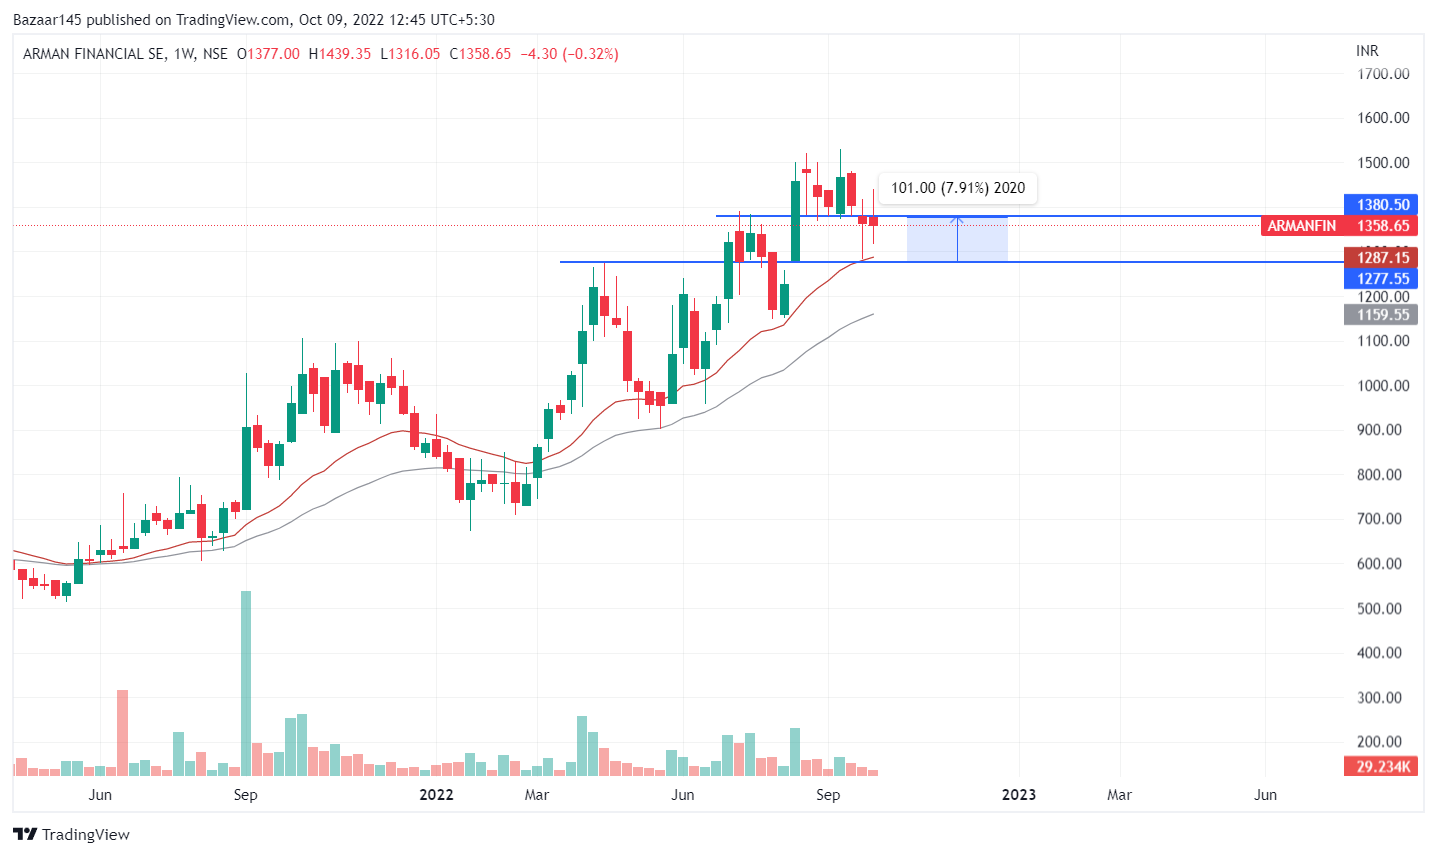
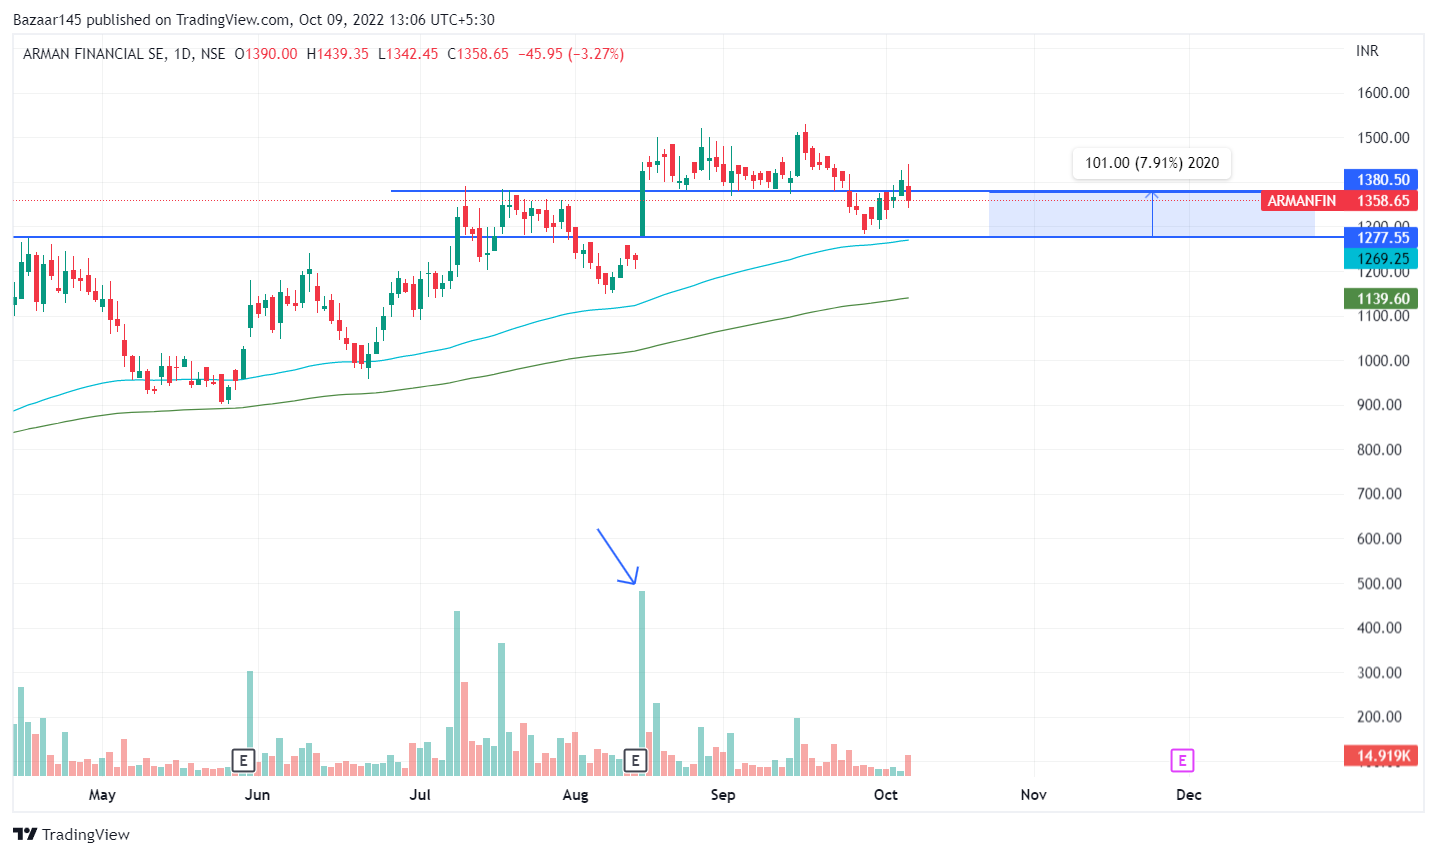
Check the weekly chart.
We start to ride in this Stage 2 it when it broke the 1st trading range
Then added few when it broke the 2nd trading range.
Then it came back to test the 2nd trading range and stuck there for last 2 weeks -this is called retest (blue circle). We added more of these this week when it again came above the 2nd trading range as well as when it crossed the final resistenace.
Do read whole write-up on Granules ( the post on learning stage analysis ) to undertand what factors to check (Vol,MACD,RSI ,10 wma, 40 wma etc etc ) and apply whether you can see those factors working here.
The way US markest fell on Friday, it seems that Nifty might follow the this older path. First a fall , then a tradable rally .Let’s see how things pan out next week.
Stock has come close near to 1/3rd of its stock price.
The bigger worry is that it closed below 40 months moving average - if it closes below 40 MMA this month also- it would signify that it has still more weakness left in it.
Currently it is trading near 4th wave of its recent bull run- 4th waves are usual stop -level while stock is going through correction.
From here if it breaks , then it can go near highs of pre-covid levels or below .
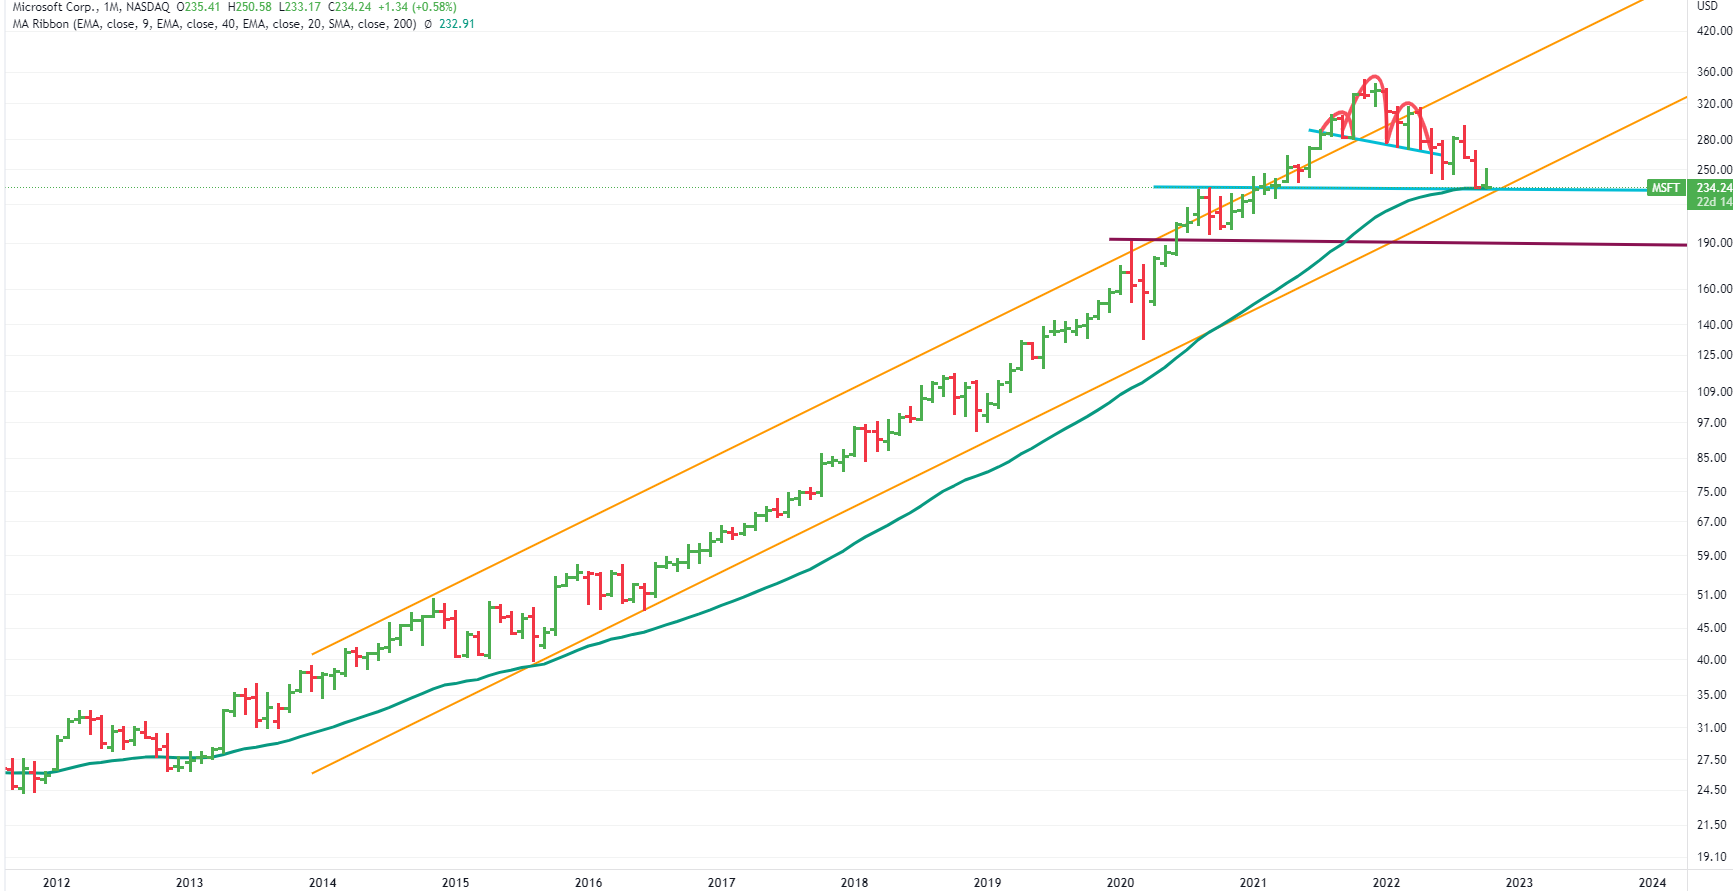
Well it broke its uptrend channel after 10 years and 40 MMA before bouncing back.
Now again it is back below 40MMA . And again crossing below the long -term channel. Monthly Chart :
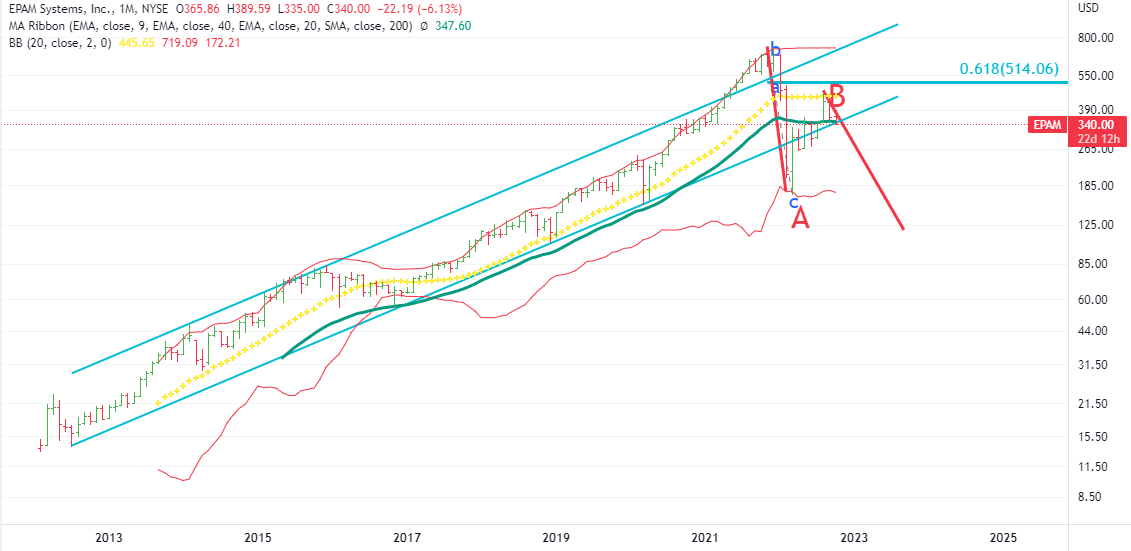
1st support should be lower end of BB on weekly charts i.e . near 260.
If it is still not in mood of stopping , then next support would be lower end of BB on monthly charts i.e.170 . Although A=C tells a tale that can be very grim and unbelievable in current scenario.
Keep in consideration that BB,moving averages are synamic targets as they keep changing as pper the price-movements.
First stop should be lower end of weekly BB ie near 20.If it breaks lower BB then A=C can become a possibility.
Disclaimer :This is just a post for learning a method. No buy/sell recommendations. These are probability study methods and chances of success depend upon various factors.
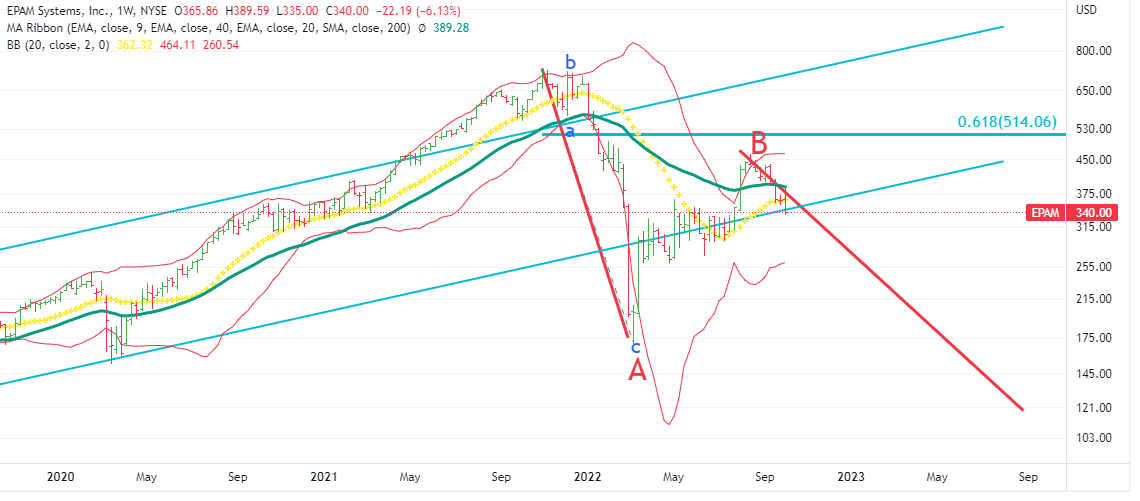
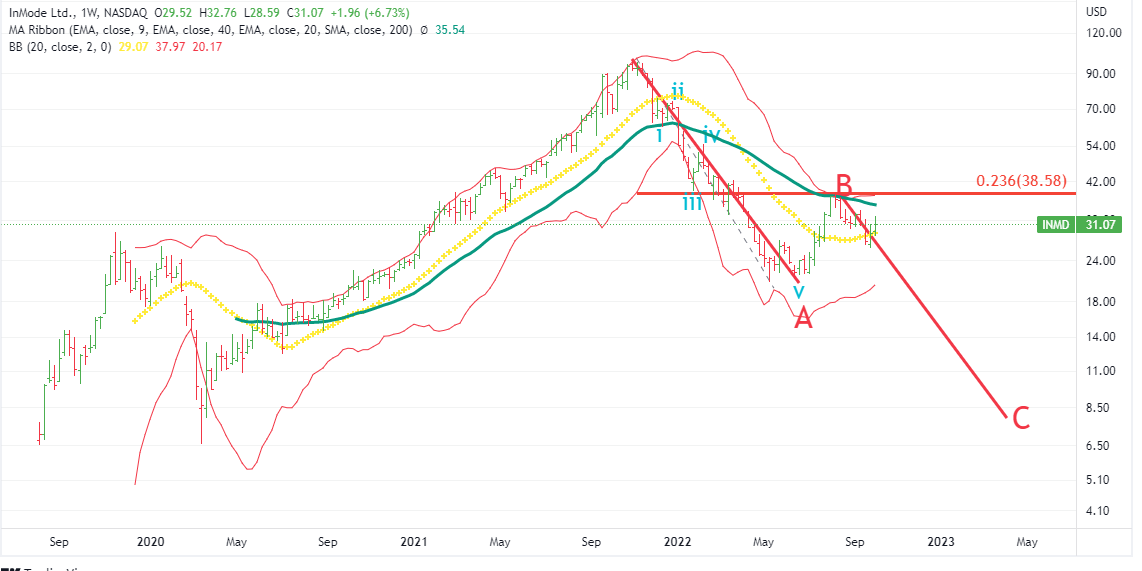
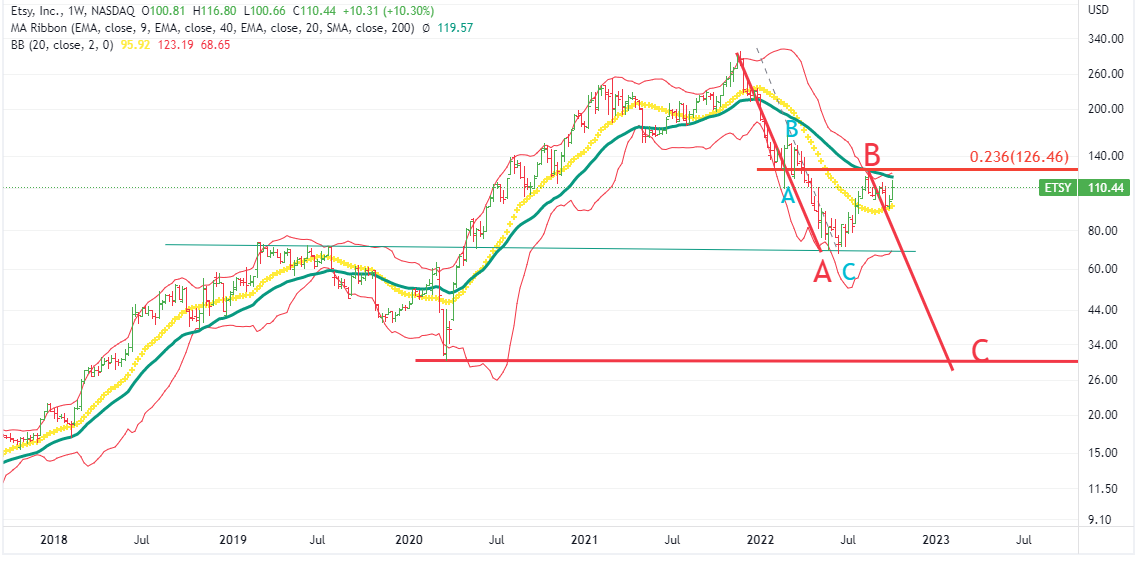
As projected,it bounced in B wave …touched 40 WMA nad is turning back.
If US markets keep cracking, 1st level is lower band of BB i.e 70 and that is also the level where wave A ended.
Further to that it can go to COVID lows where C=A. Weekly Chart
Disclaimer :This post is just a for learning a method. No buy/sell recommendations. These are probability study methods and chances of success depend upon various factors.
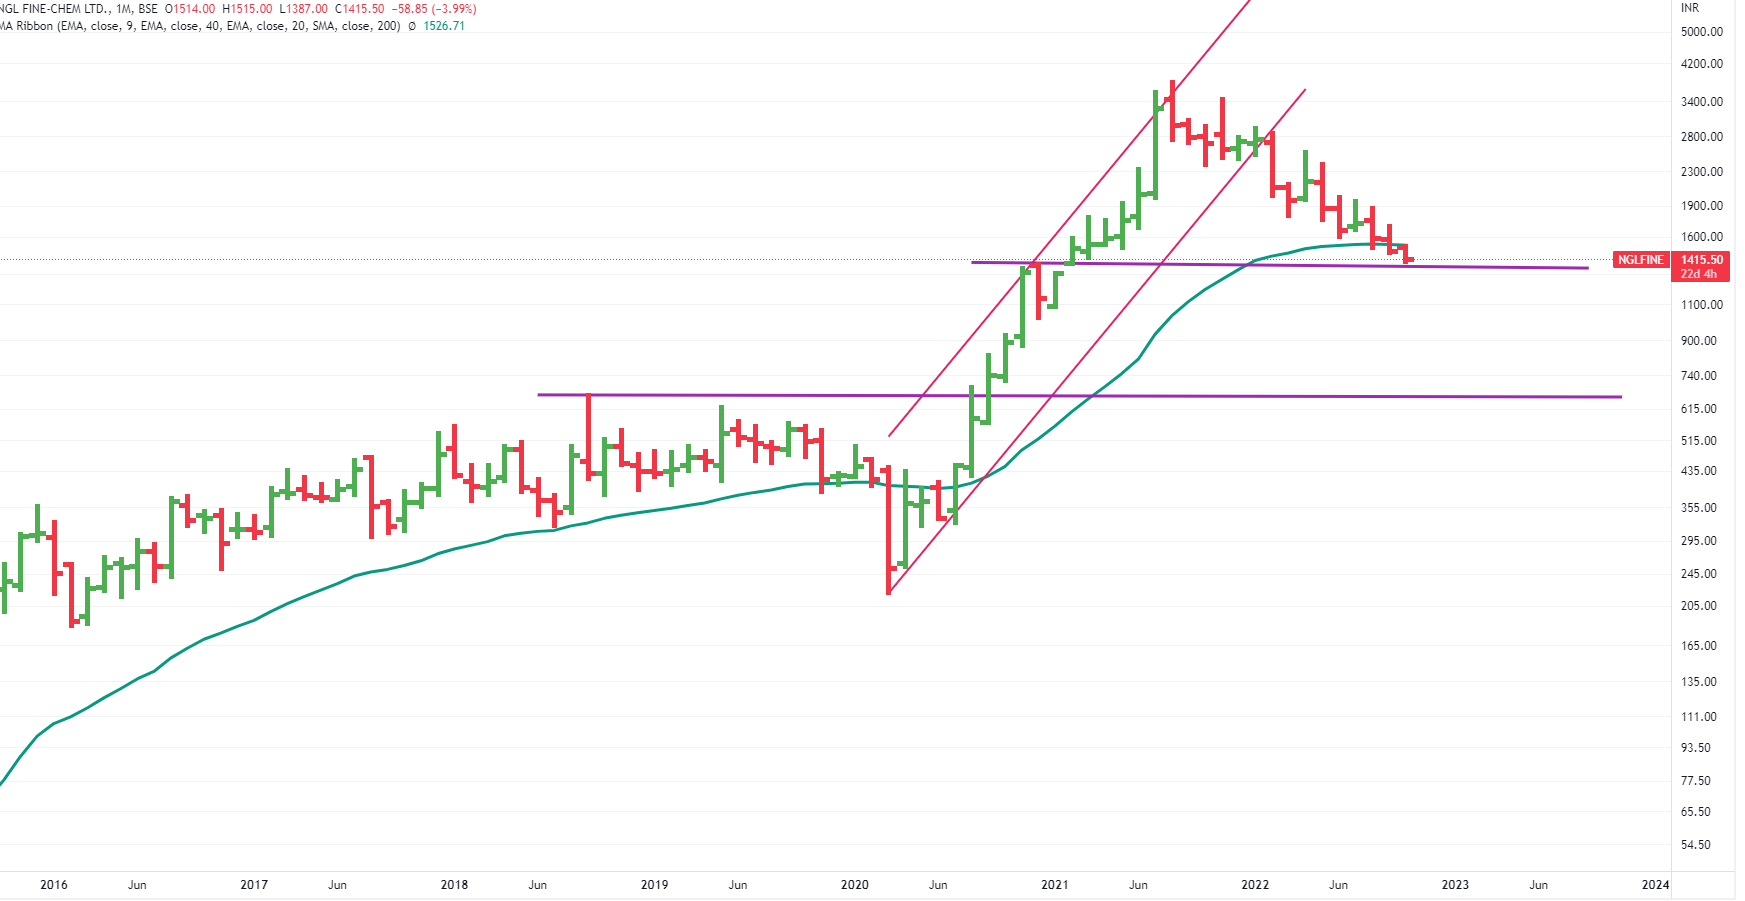
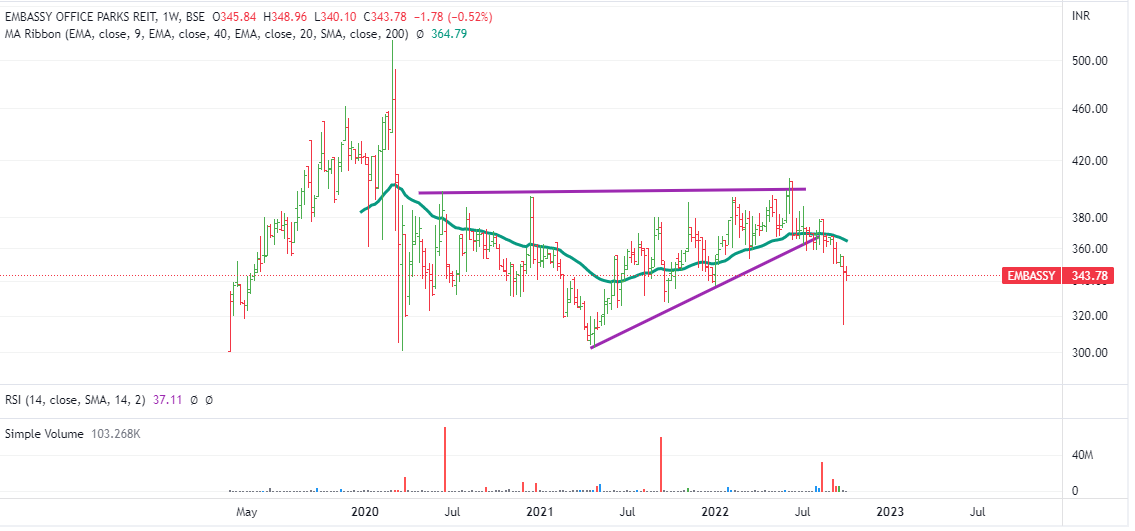
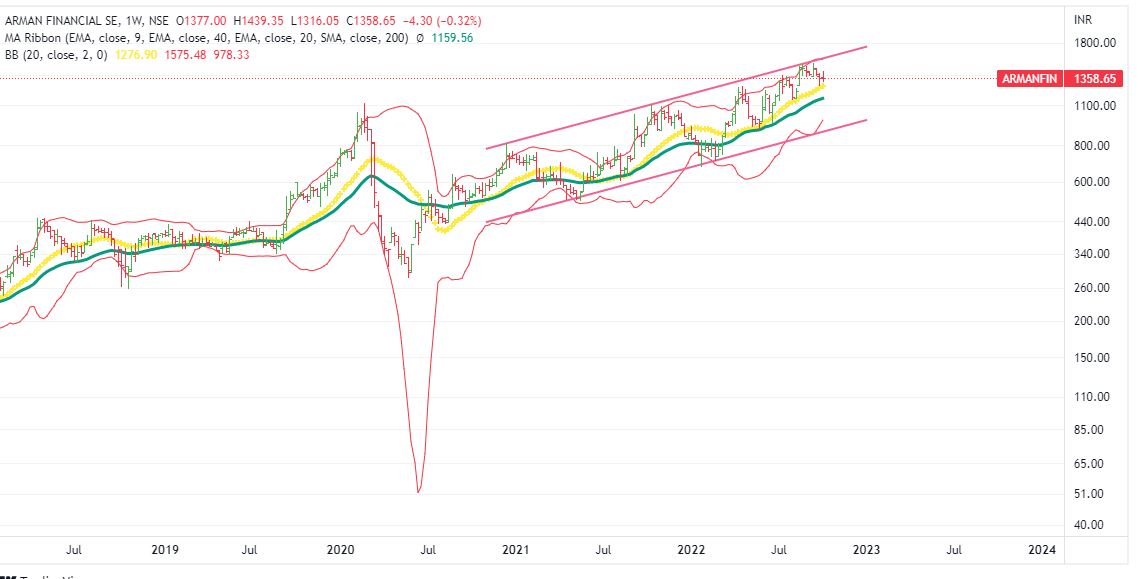
Tried to analyse this but it seems to be one of the trickeiest charts.
All the moves have been overlapping and can’t see any clear wave structure ,so difficult to guess the long term move as of now.
Only thing that is visible is that it is trading close to upper channel - hence can move down from there. If someone has to enter ,he should wait for a weekly close above the channel.
We tend to stay away from these type of charts. There are 100s of other cleaner charts where one can convincingly make few alternatate projections.
Hi Stageinvesting…!!
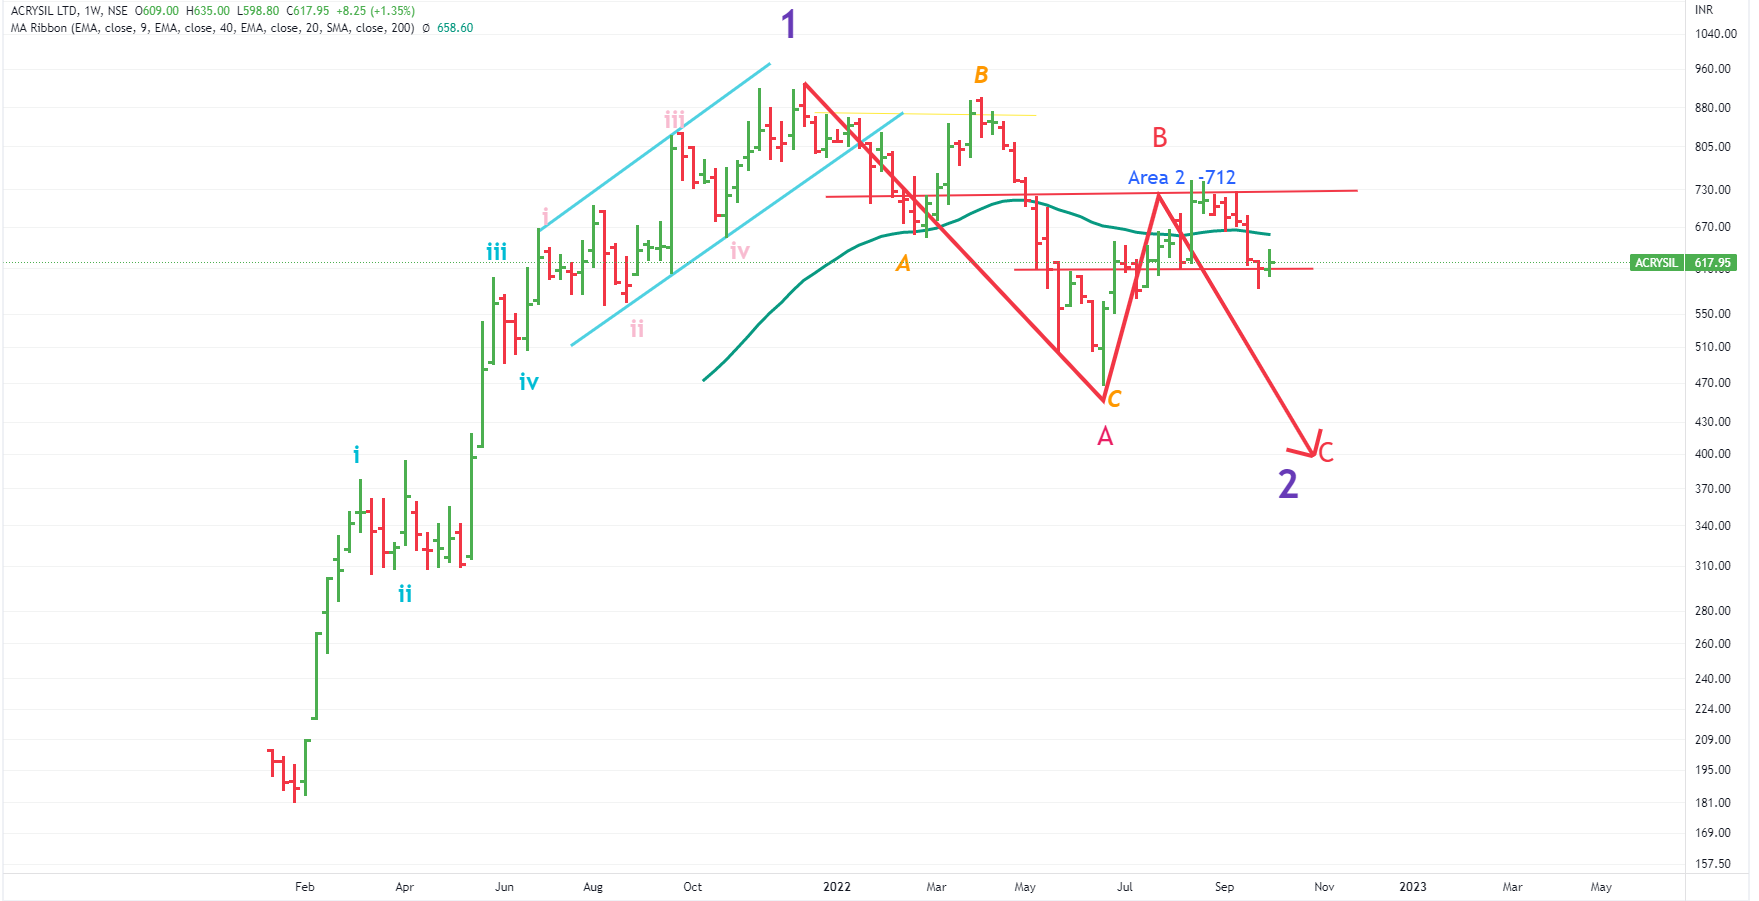
It looks like Deltacorp is doing B and if it closes above 230 next week (results also there) can extend rally upto 270 where we can expect downward C to to start…Pls correct my understanding if it’s wrong.
Thank u
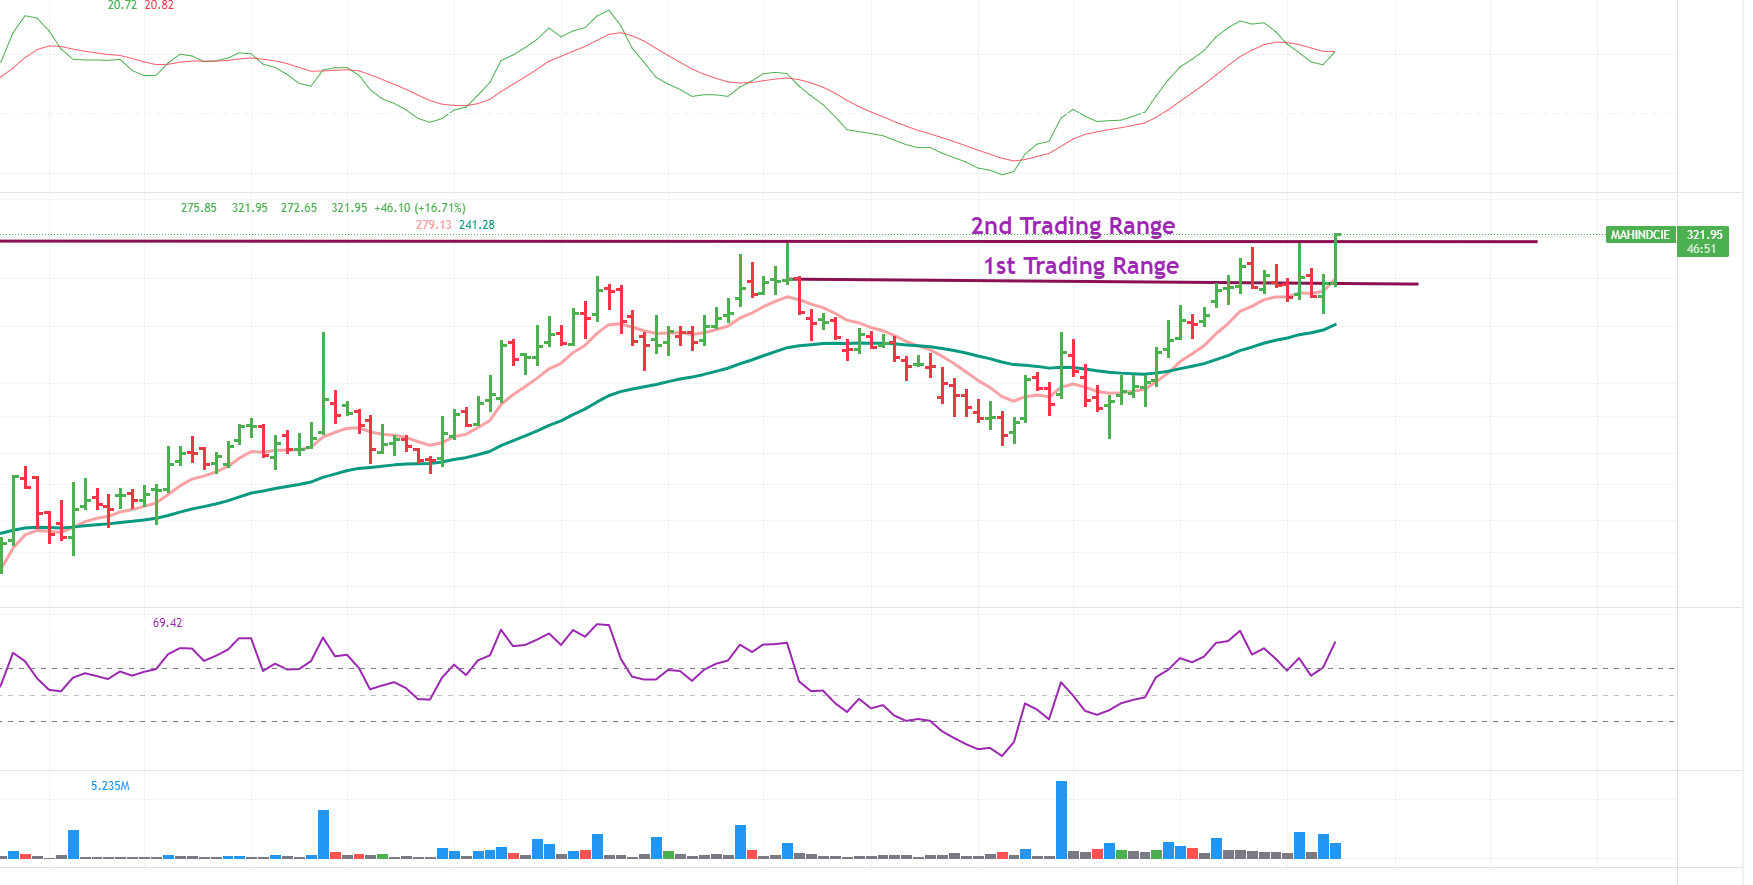
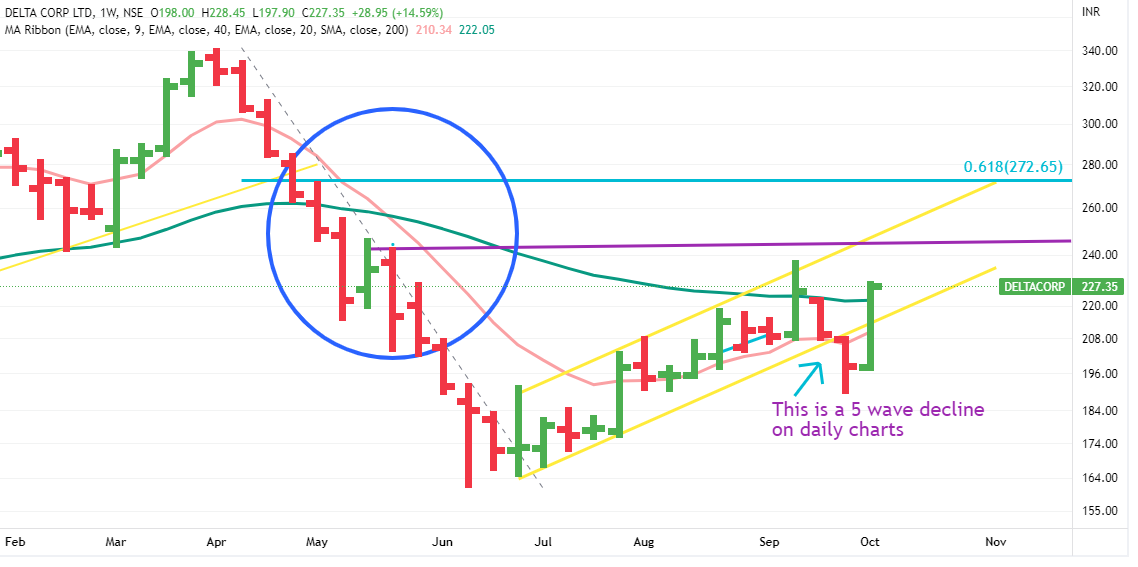
Deltacorp
Yes, it is 2nd attempt.In first attempt, it turned back from 38% retracement levels.
But has lot of resistances .
First it has to cross and close above 241 . That is top of previous ED bar ( effort to pull down candle) and at the same time that coincides with upper end of recent rising channel.
2nd , once it crosses that hurdle, then it has to cross the next few ED bars ( in blue circle)
3rd , currently it is touching upper end of weekly BB .That might act as a hurdle.
4th interesting point is that recent decline was a 5 wave decline , hence it might be doing a zig zag correction i.e it might bounce a bit and then it may come down again to complete its last leg of zig zag correction.
In summary, even if it moves upwards -the journey may not be smooth. Weekly Chart
Disclaimer :This post is just a for learning a method. No buy/sell recommendations. These are probability study methods and chances of success depend upon various factors.
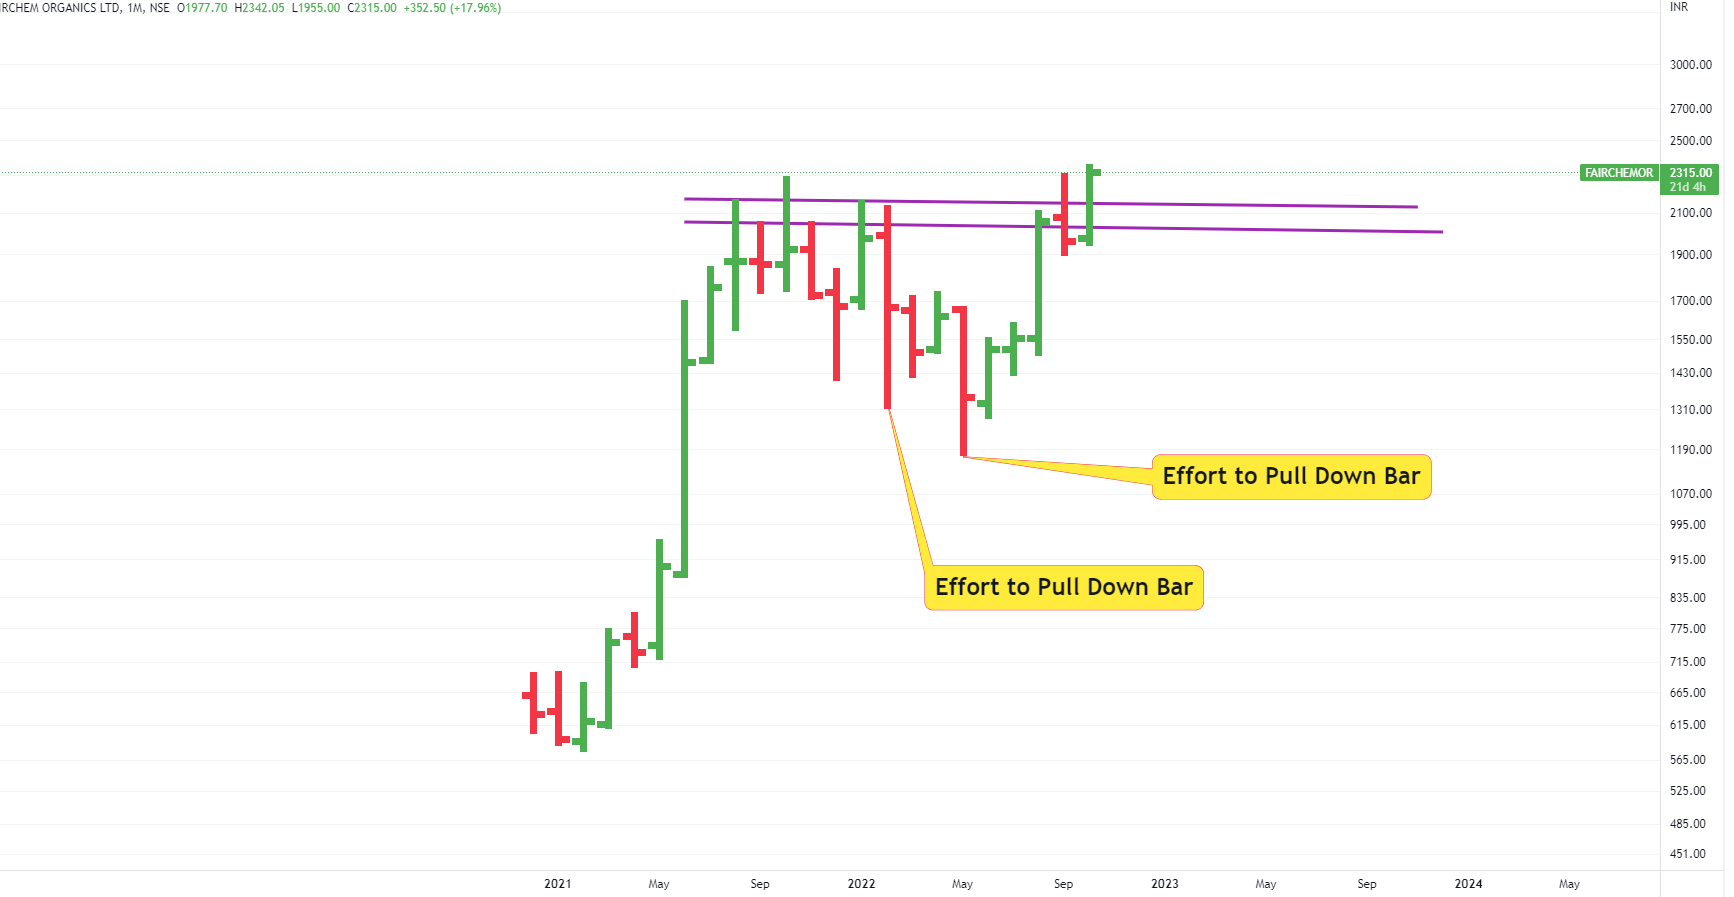
CMP 2305
Stock selection by VPA method (Volume Price Action)
In this method, buying is done if the stock prices closes above ED bar (effort to pull down bar) or if the price starts closing above the BC bar (buying climax bar) .If this happens at a higger time-frame , the better chances of startign an uptrend.
Underlying concept :If the prices start closing above these bars, that implies that major supply has been absorbed and serious buyers are stepping in (checking volumes is impaortant)
We selected this stock today based on this method …but need to wait for the closing.
Disclaimer :This post is just a for learning a method. No buy/sell recommendations. These are probability study methods and chances of success depend upon various factors.
Volume Price Analysis (also known as Volume Spread Analysis) is another method for entering and exiting stocks. This is good for postional as well as long term investors.
If you know basic charting, you can learn this method by free by clicking on the follwoing Video series on YouTube.
This series is being made by a Mr. Karthik Marar, an engineer by proffession. Apart from that , he has made a free indicator on Trading View.
You may pay thousands of rupees to elarn this method but this old gentleman is teaching it free ( well, we know people don’t take free things seriously ) .But if you’re a serious learner ,it is a golden opportunity.
Series consists of small videos and you can learn this in your leisure time.