StageInvesting +Elliot Waves

Indeed this view might play also. If this happens banknifty will be in wave 2 during the time s&p is in wave C-3 or c-5 depending on how it’s drawn.

My reason for interest in this is not to be right or wrong. I have been a member for very long here and off late don’t post as much as my method now is to take swing trades in nasdaq stocks for most days and trade in index when opportunities present themselves

For indices I never keep a stop loss. However I hedge equal amounts when the wave continues and doesn’t terminate where I expect it to. Then take a profit on the next run while waiting for it to return the first trade or joint trade into profit. Some time I couple double hedge if the wave is likely to continue.

There is no right or wrong in technicals, only how you can use it to trade So I don’t force academic level of certainty on myself.

No one is disputing any “finding”
I don’t know why he was suspended in the first place but that he was suspended put me off from participating on this forum

We don’t make the market, we try to interpret and take a trade. All views are just views, fundamental and technical. Your edge comes from position sizing, patience to wait for the trade, discipline to not jump the gun, taking small losses when you’re wrong
But ofc everyone knows that, practicing is difficult

2 Likes

Great US Comapnies Stocks Situation

Some high quality businesses are now trading between 1-1.25X NTM PEG ratio .
And look at the PE of these historically- proven high growth, future-ready global companies stocks and compare what we’re paying in India for brick & mortar companies ( a point to ponder).

These stocks may further go down in coming months but they are gradually coming in buy-zone (don’t hurry ) - the people who have interest in US market should keep a watch and can wait for bottom and base formation ( to make an entry in these stocks , not-so-technical savvy investors can use Stage Analysis method ).

Other point here is to highlight the importance of 40 Months Moving Average - how long term investors could have exited these at the break of 40 MMA (green line) and they could have avoided the pains of further drawdowns.

Also would like to draw your attention to the fact that these are monthly charts - the recent drawdown does not look severe in these charts but if you check closely prices have come down near to half of their peak price ( again not a reason to buy ).

Paypal
Can it come between 65-75 , we will definitely buy it for long term.

Google
Expected to touch 80 —lower line of channel . Anywehere between 75-85 , we feel this can be good for long term.

Nike

Can it come to near Covid lows ?Near 60s?

VISA

Can it come near to Covid lows or near October top ie. 150!

Disclaimer These are personal views. These are nowhere recommendations. These are probability projections and things can go worst or better than the projections given here. Do your own studies.

1 Like

Hi,

Hasn’t paypal already touched a bottom of 67.58 sometime ago? Any reasons to not buy it then?

Also, it would be great if you can give your insights into Inmode, Microsoft, EPAM systems and Nasdaq index? I am asking for a lot of names but your insights are very informative. So it would be great to get your feedback.

A good question. We did not buy it (Paypal ) then because :

a) We never tend to buy when a stock falls , we wait for a base-formation .That means that supply at lower level has been absorbed and there’s less scope for further fall.

b) As mentioned several times before we are expecting further fall (at least 10-15% ) in US markets, hoping that we might get it more cheaper.

We would get back on your stock-queries in some time …no hurries …more you wait, more cheaper they get. :grinning:

3 Likes

Nifty -Very short term

Nifty one leg down is balnce- may go near 16500-16700 zone.

After that a bounce , a tradeable rally (bounce) of 700-800 points (can go higher near 17990 if 17450 zone is taken out convincingly) …the bounce would also coincide with US indices retracement after weeks of fall …then the next leg down can be expected.

In India, it seems that we are in a distribution zone ( as far as Index is concerned )since last October…where prices are kept higher to keep the retail investors interested and large investors liquidate their holdings.

In Stage Analysis , this phase is called Stage 3.

stageanalysis

And then there’s another well known theory known as The Wykoff Method, he calls this phase as a distribution zone.

Disclaimer :These all are assumptions. May or may not work out. Use your own wisdom and caution.

2 Likes

Nasdaq

We’re in wave 3 of C.
Minimum expectaions for wave 3 are that it has to be equal to wave 1. That has been done and now it is extending.
Next watchout level would be 161.8 % of 1 i.e. near 10250.
(in worst case scenario, wave 3 can go upto 261% of 1)

After we complete wave 3 , we might get a tradeable rally in wave 4. Now size of the bounce in wave 4 depends upon the where we stop in wave 3.

Once we complete the bounce in wave 4 , we might again slide down in wave 5. Wave 5 either can be equal to wave 1 or wave 3.

Many a times wave 5 turncate , means they don;t achive the target.

How deep wave 5 will go would depend upon the extent of bounceback in wave 4 as size of wave 5 would be counted from the top of the wave 4.

Other way to make a guestimate of extent of full fall is to calculatate the % fall in wave A , generally wave C happen to be equal to wave A ( shown in red lines here)

(Indian index might bounce back ,might give a tradeable rally when US Indices are give their wave 4 bounce )

Keep in mind, these are dynamic numbers. Calcualtions keep changing as per the index (price movement ).

What is certain ?The certainitiy is that we’re in a bear market and bottom is yet to be made.

Disclaimer: These are probability studies based on historical patterns of price behavious in different asset classes . They can go wrong . And we can’t estimate the timeline of different levels in these studies.

2 Likes

@StageInvesting How do you apply stage investing for KMCH and Manappuram finance?

Please see our view on the said stocks :

Here are simple steps to check the stage :grinning:
A) Go to weekly chart
B) Apply 10 EMA and 30 EMA
C) If stock is trading below 30 WMA, it is in S4 . Close the chart and go to next stock
D) If stock is trading above 30 WMA and 10 WMA is above 30 WMA,this stocks needs further work
E) See whether it is trading in a range , going up and down 10 and 30 WMA.
F) If it is moving in this trading range, wait for the stock to break out the trading range to make an entry
E) Keep in mind that in most of the times the prices come back to trading range level -to retest. So one can make a small position at the time of breakout and add more after it comes back for retest and starts moving up again. If stock goes below the trading range and 30 WMA , exit the initial position also
F) Many a times there are lot of resitances on left side, so one needs to make staggered entry, ie once the stock closes above those resistances.
G) Keep in consideration that these are weekly charts. So one needs to check closing only on weekend. Many a times stock break up above the trading zone with-in the week but comes back below the range at the end of the week.
H) Every breakout should have good volumes . Any break out with low volume can be a fake breakout.
H) This method works well in bull-markets. In bear markets like these days, you would get lot of false breakout and you might loose trust in the method.

Manappuram
It is well below 30 WMA.No nearby trading range is visible. So no need to pay any attention.
Exit time was when it broke 30 WMA and trading range. One could have exited partially at break of 30 WMA and fully after it broke the trading range.


KMC
Well this seems to be in S3 , in a trading range. But lot of resitances on left hand side. So if it moves , the movement would be full of obstacles.

One should build positions slowly slowly, 1st after the breakout above trading range, then when it comes to retest and does stay back into the trading range for more than a week. More stocks can be added after it keeps crossing and closing above the left side resistances (as shown in the chart)

Disclaimer :We are just explaining the method. No advise or recommendations from our side. And as per our view , we’re in a troubled market, any new position building is full of risk.

Hope this is helpful to understand Stage Analysis.

12 Likes

We discussed this stock in May 22, about 5 month back.

@StageInvesting What website / tool do you use to apply the above filters?

Please go through the follwoing videos on YouTube on getting strated on charting.

How to set up free charting account ?

How to use moving averages

For in-depth understanding of Stage Analysis, you can read this article . Please take a print-out and read it multiple times.

For more elaborate understanding of Stage Analysis , please read Stan Weinstein book.

Keep in mind that this method is for medium to long term investing- for entry and exits- where one can just spend few hours on weekend to decide entry ,exit and position sizing in his/her favortie stocks.

Hope it helps.

7 Likes

How We’re Playing This Market

As it is apparent that we’re bearish for at least for next 6 months, we are playing this market in many different ways .

a) We participate in counter-trend bounces (bear market rallis) whenever we feel that a rally of more than 800-1200 points can be expected . This we do by buying Index as well as Stocks in Futures.

b)We participate in downward rallis by shorting Index as well as Stocks in future

c) We’re not day to day traders ,so we don’t engage in weekly or monthly options.These happen to be very volatile and one can loose whole capital if one is not a technicals-expert , can’t sit in front of the screen whole day , does not have experience and is not trained in behavioural part of investing.

d) Our key strategy in current market
Our key strategy to play our bearish view is being executed by buying puts and that too very long dated. Currently we have bought 18000 and 18500 Puts for March End.

We keep on adding these puts whenever market goes up above 17200 ( when it goes down the price of puts goes up , so we don;t buy at that time)

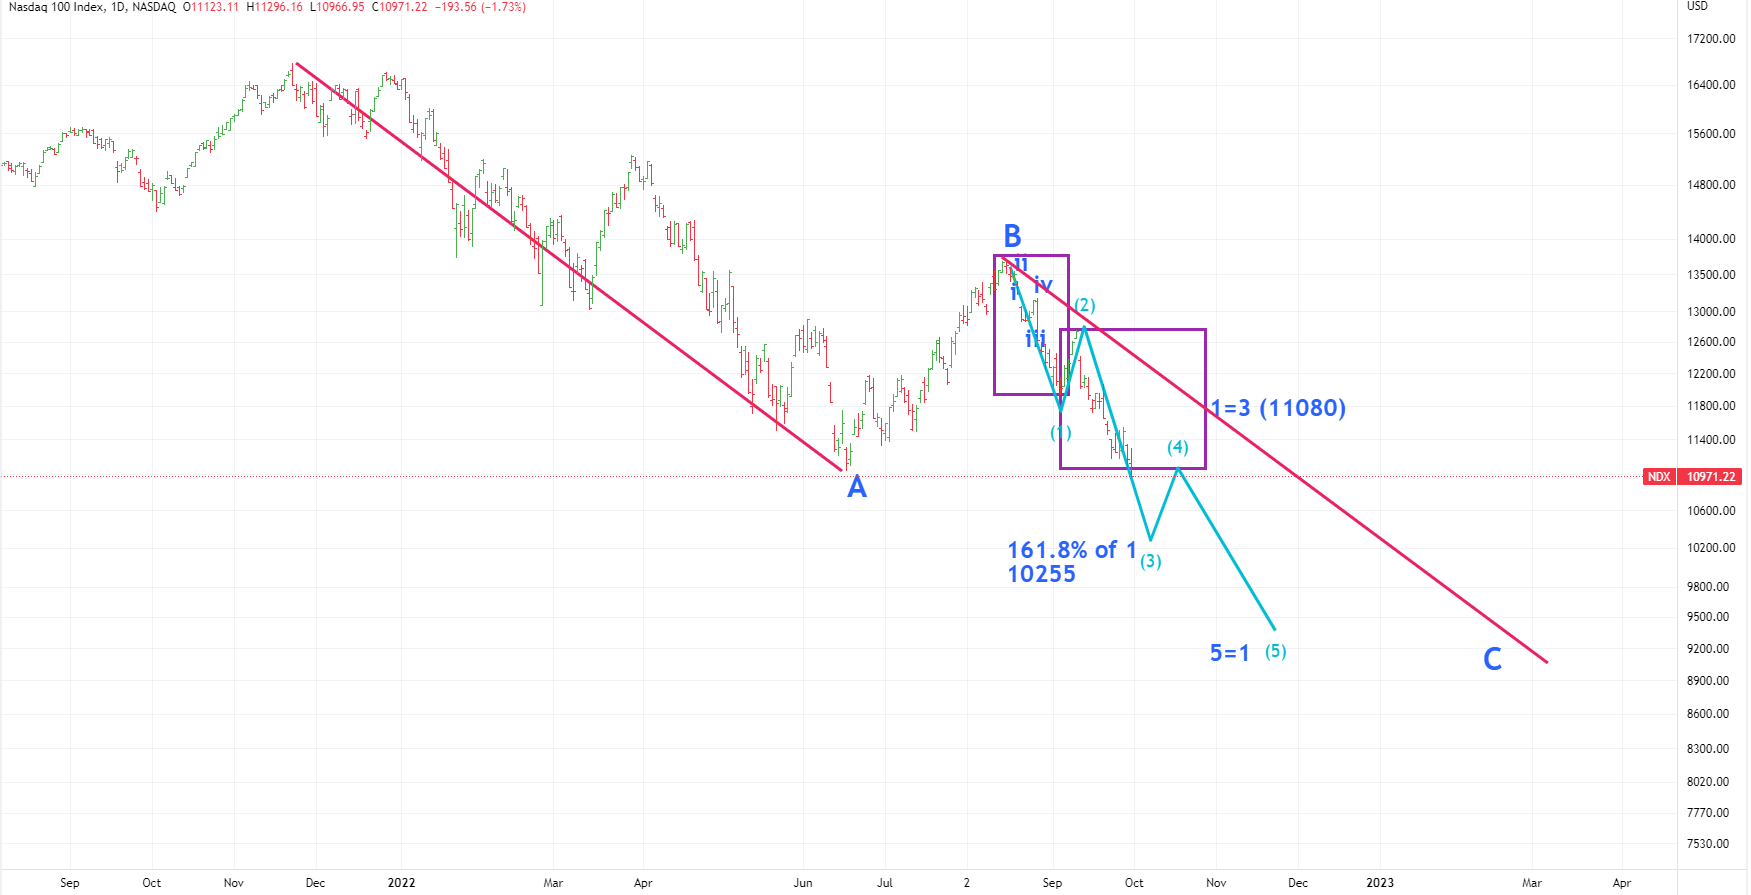
Why 18000-18500 - becuase everytime market has turned back from that level so it has become a key resistance.

Why March End - Because March gives us time for our view to play out. Most of the people loose in options (even though their view might be right ) because time goes against them i.e. view does not play out with-in a given time frame. By playing March-end puts , we’re making time our friend , not our enemy.

How this works out :
Our expectation is that market may go down lower. If our view plays right , the price of our Put would keep going up ( but if our view proves wrong , the Put price would go down,thus we would loose money) .In this kind of trade, one does make multiply his money, but there’s a chance of a decent return .

Other advantage of this simple strategy is that our downside is known to us. In these options, one might loose all the money invested in buying these puts. But that’s the maximum risk whereas in many other strategies, the risk can be unlimited.

Caution : a) Returns would depend on timing of buying the Puts, if someone buys these 18000 puts when market is at 16000 and market does not go down further, there is a chance to loose money.

b)Also other obvious risk is that your view may not play right and you end up losing value of your Puts.

c) This needs lot of understanding and experience , so don’t try if you don’t understand these instruments, you’ve not practiced enough and your behaviour is very fickle ( you loose your sleep over overnight movements and M2M losses)

d) Here one should be prepared to loose all the money ,just like when you go to casino. Know your limit before entering the casino (with no expectaions of returns)

e) This is our strategy and we can exit or take a U-turn any day without putting any post - so don’t follow us on our strategies. This post is just to make you aware about the way we approach tthe markets.

Note :We played on the other side between March 2020 to Dec 2021 i.e.we were buying long dated Call options of next levels of Index. E.g. In March 2020, we were buying 12000 Calls of July and we kept on buying long dated Calls of next higher levels throughout the bull-run.

Hope this helps .

6 Likes

This risk can be minimised by buying higher level long dated call options. For example , you are bearish and you’re buying March end Put options of 18k levels, at the same time one can buy 19K level March end Call options by putting 10% of the total money that was put in Put options. So if market goes to 19k , your call options price might go up by 3 to 4 X , whereas your Put options price may become half (it does not go to zero). That way , you have very less risk of losing money.

1 Like

@StageInvesting By this logic, ITC is in stage 2 and consolidating right?

57% stocks of Nifty 50 are in Stage 2 .

That does not mean that one can jump in each of these stocks .

This strategy is purely for fresh entries and exits (during corrections).

Granules

Let’s learn Stage Investing as we go along.

Weekly Chart :

(a small change here - used 40 wma in place of 30 wma , to be more sure about the stage)
Have a close look at the chart - it went above 40 WMA and then got stuck in a trading range (1st brown line) from 15th August to 25th September.

After that it broke the 1st trading range and closed above that ( last week ) . Also 10 WMA had moved above 40WMA .This means that stock has shown intial signs of entering in Stage 2.
WE TOOK OUR INITIAL POSITION IN THIS STOCK.
(Did not take full position because (a) we were expecting a retest (b) there’re lot of left hand side resistances as shown by brown lines )

Expected small pullback (retesting the upper level of 1st trading range) did not happen and it went up - this is a sign of strength).

This week on Monday, it opened and closed above the falling trend line (red line) ,this is called trendline breakout . We added some more stocks.

Now it is trading above 2nd trading range, we would wait for it to close above the 2nd trading range on weekend as it is weekly chart ( Friday ,3 pm we would take a call) . If it is clearly closing above 2nd trading range , we would add more.

Then we would wait for this to cross the major hurdle. If it crosses, we would keep riding over it by using trailing methods.

If it fails there and start moving down sharply , we would start exiting in phased manner and would book profits.

Volumes Check
Every trading range breakout should have good volumes otherwise it can be a fake break-out. Have a look at blue bars of the volume at the bottom. These show more than average weekly volumes.

MACD Check
Checked daily, weekly, monthy MACD indicators ( given on the top ), all are in buy mode .Grren line crossing above the red line.
RSI Check
Daily, weekly ,monthly RSI above 60 level (given below). Not a must but it is a good confirmation of momentum.

Sector Check
Pharma is showing resilience and good movement is happening in many pharma stocks.
Sector check is very important. Mostly stocks move in a herd ie generally same sector stocks move in one direction.So if the sector is showing stregnth, the stock has higher chances of having a successful S2 journey.

Let’s keep tracking this. It would help everyone to understand the Stage Analysis.

Hope this is helpful.

Disclaimer :This is just a post for learning a method. No buy/sell recommendations. These are probability study methods and chances of success depend upon various factors.

10 Likes

JB Chemicals & Pharma

In the series of learning Stage Analysis - here is the 2nd stock.

While Granules is moving into S2 from S4 stage , JBCHEM is moving in S2 stage from S1 levels.
Weekly Chart

Once a sector is showing strength, we try to find more stocks in the same that are showing intial signs of start of S2 .

We took a very small position at the trendline (red line) break in August -it was already trading above 40 WMA and 10 WMA has crossed above 40 WMA.
We were wiating for pullback and retest of the trendline. Once it started to move after testing the trendline, we added few more stocks.

Then it broke the trading range , we added few more and waited for a putll back - blue circle shows the same. We did not add during that week as we were not sure whether it would go down or would remain above the trading range.

Only on last weekend we added few more as it was closing above the trading range.

Rest of the factors remain same as in Granules - sector/volume/RSI /MACD etc.

Only one factor is different, montly MACD is yet to cross to buy side. So our exposure to this stock is lesser than Granules . Once that happens, we would add more.

Disclaimer :This is just a post for learning a method. No buy/sell recommendations. These are probability study methods and chances of success depend upon various factors.

3 Likes

Unichem Labs

Other stock in the series of learning STAGE Analysis

If you have seriously read the above posts on Granules and JBCHEM , by now you have understood a lot about early S2 entries. Hence won’t write much about this one as the stock is from the same sector.

Only thing to watchout here is that stock is re-testing the 2nd trading -range and daily MACD is in sell mode , so it might consolidate in small price range for few more days/week .

One has to be sure that it closes above the 2nd trading range in coming weekends so that one can enter fresh or can add to odd positions . if it starts moving down, that would be a time for exiting the old positions.

2 Likes

Update -Gland Pharma
In June ,we covered this stock. Price was near 2600 and one of the probability set-up was telling that it might go near to 2100 (as mentioned in the above post).

Well price went to 2050 and bounced back.But agin going down.

Can it go to 1300-1500 range (below its listing price -issue price was 1490)?

Well as per current price-action , that seems to be one of the possibilities.

Disclaimer :These are probabilties set-up studies . These are based on historical price patterns among different securities. But these can fail and there is no guarantee on either side. Use your own studies and discretion. We are just sharing it for learning purposes- please don;t take it a buy or sell recommendation.

1 Like