Bottomline :-All those companies are good when they start making money for the investors, they’re bad when an investor is losing money it. Everything else is noise.
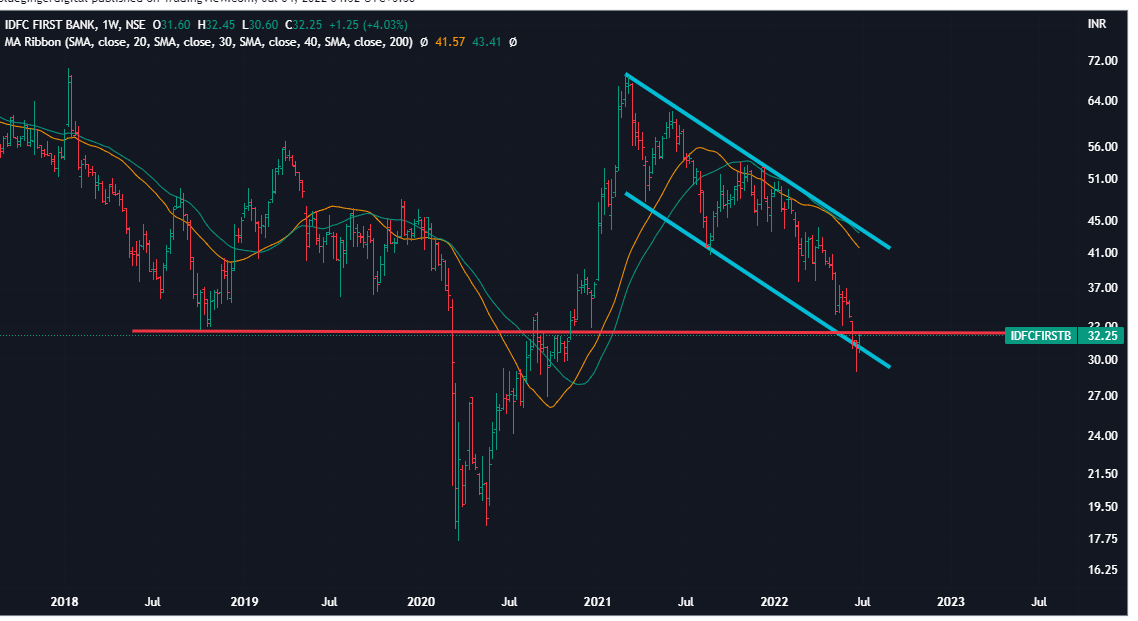
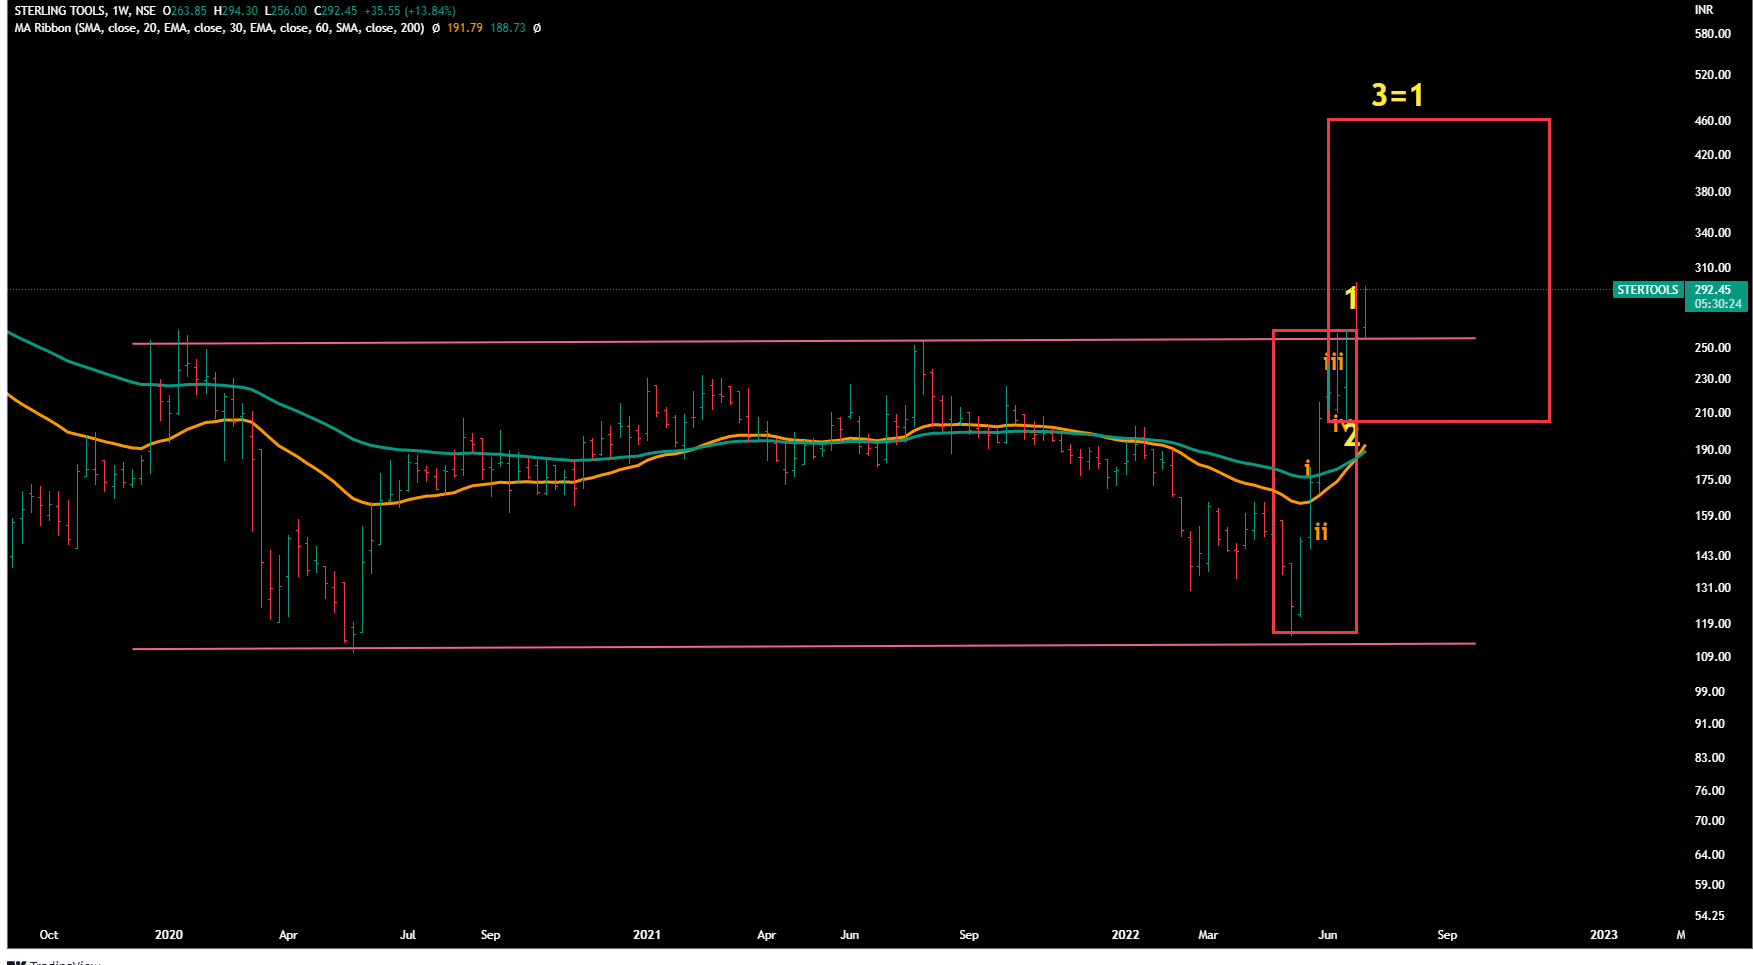
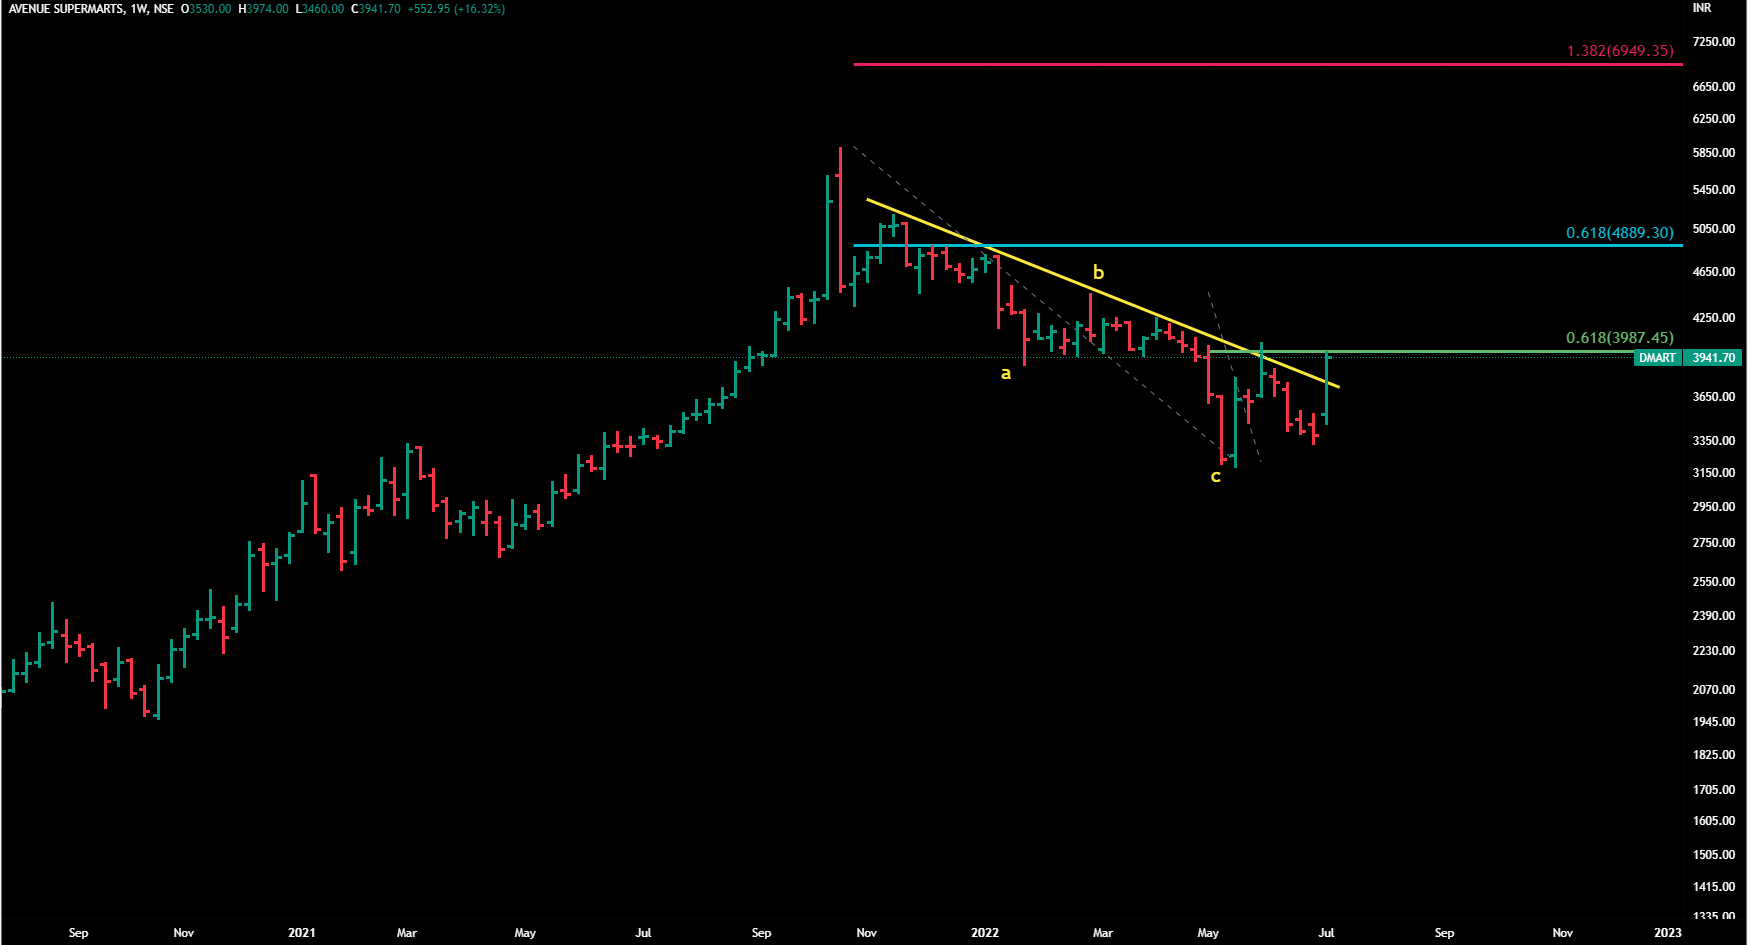
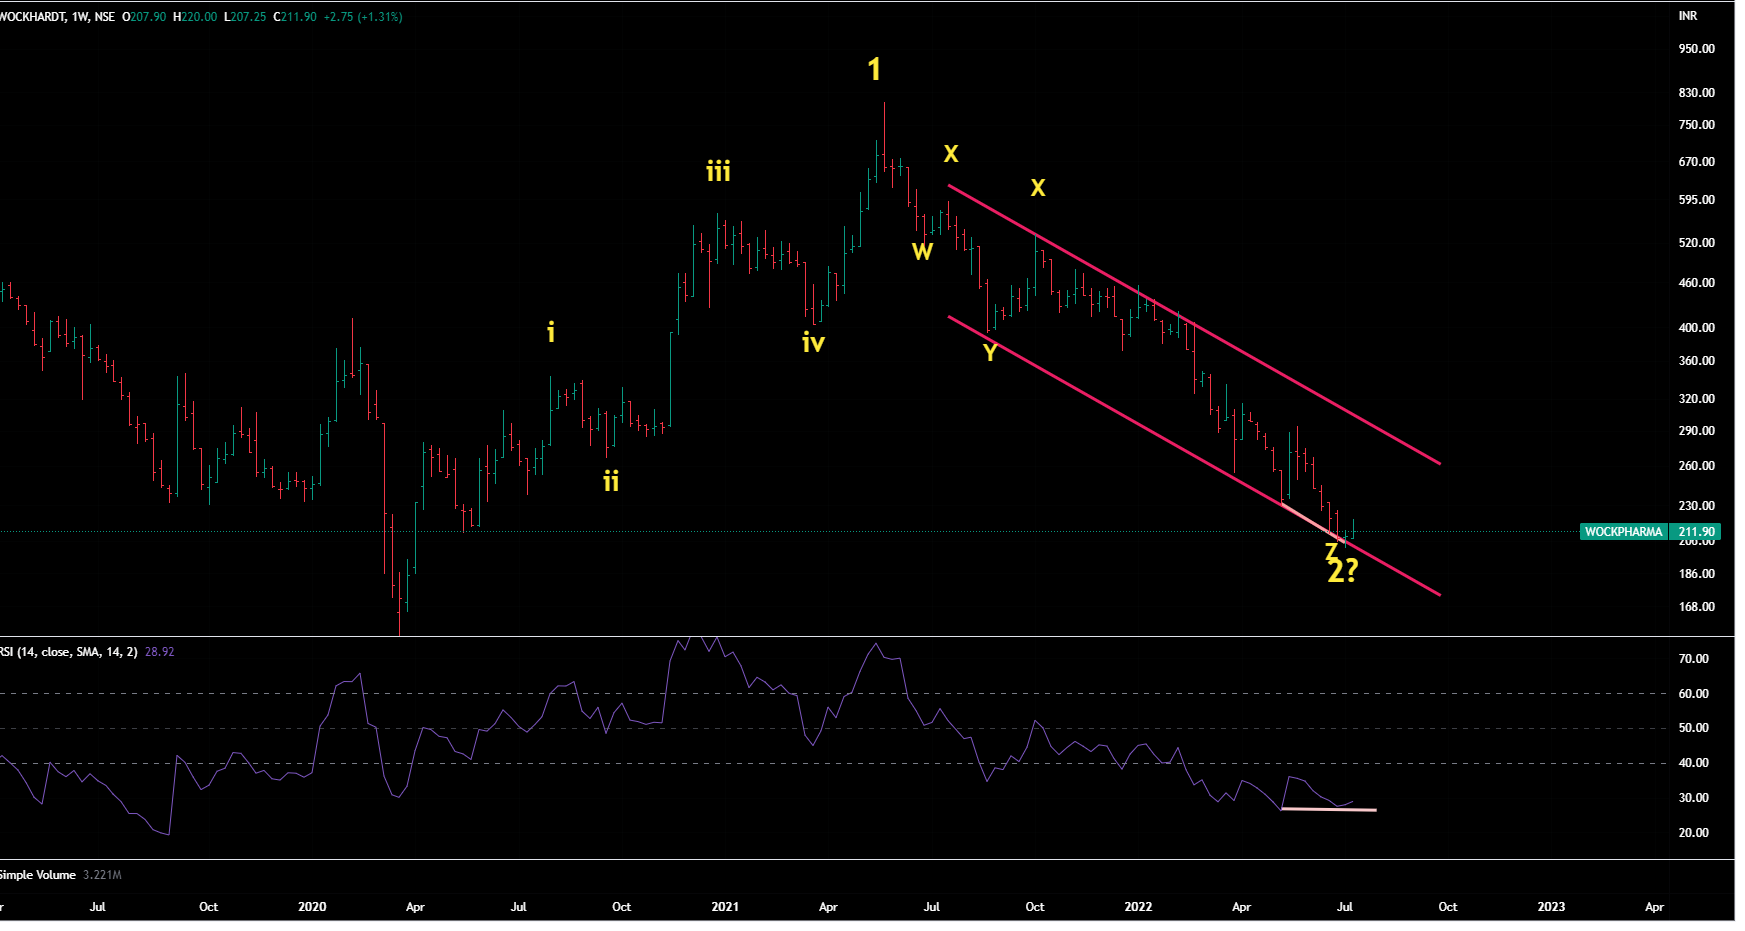
This stock moved perfectly well in a downward channel … now trying to move back in .If it fails to move -in , trade there for few weeks, further downside should happen.
Big move would only happen when it breaks and starts closing above the upper line of the channel .
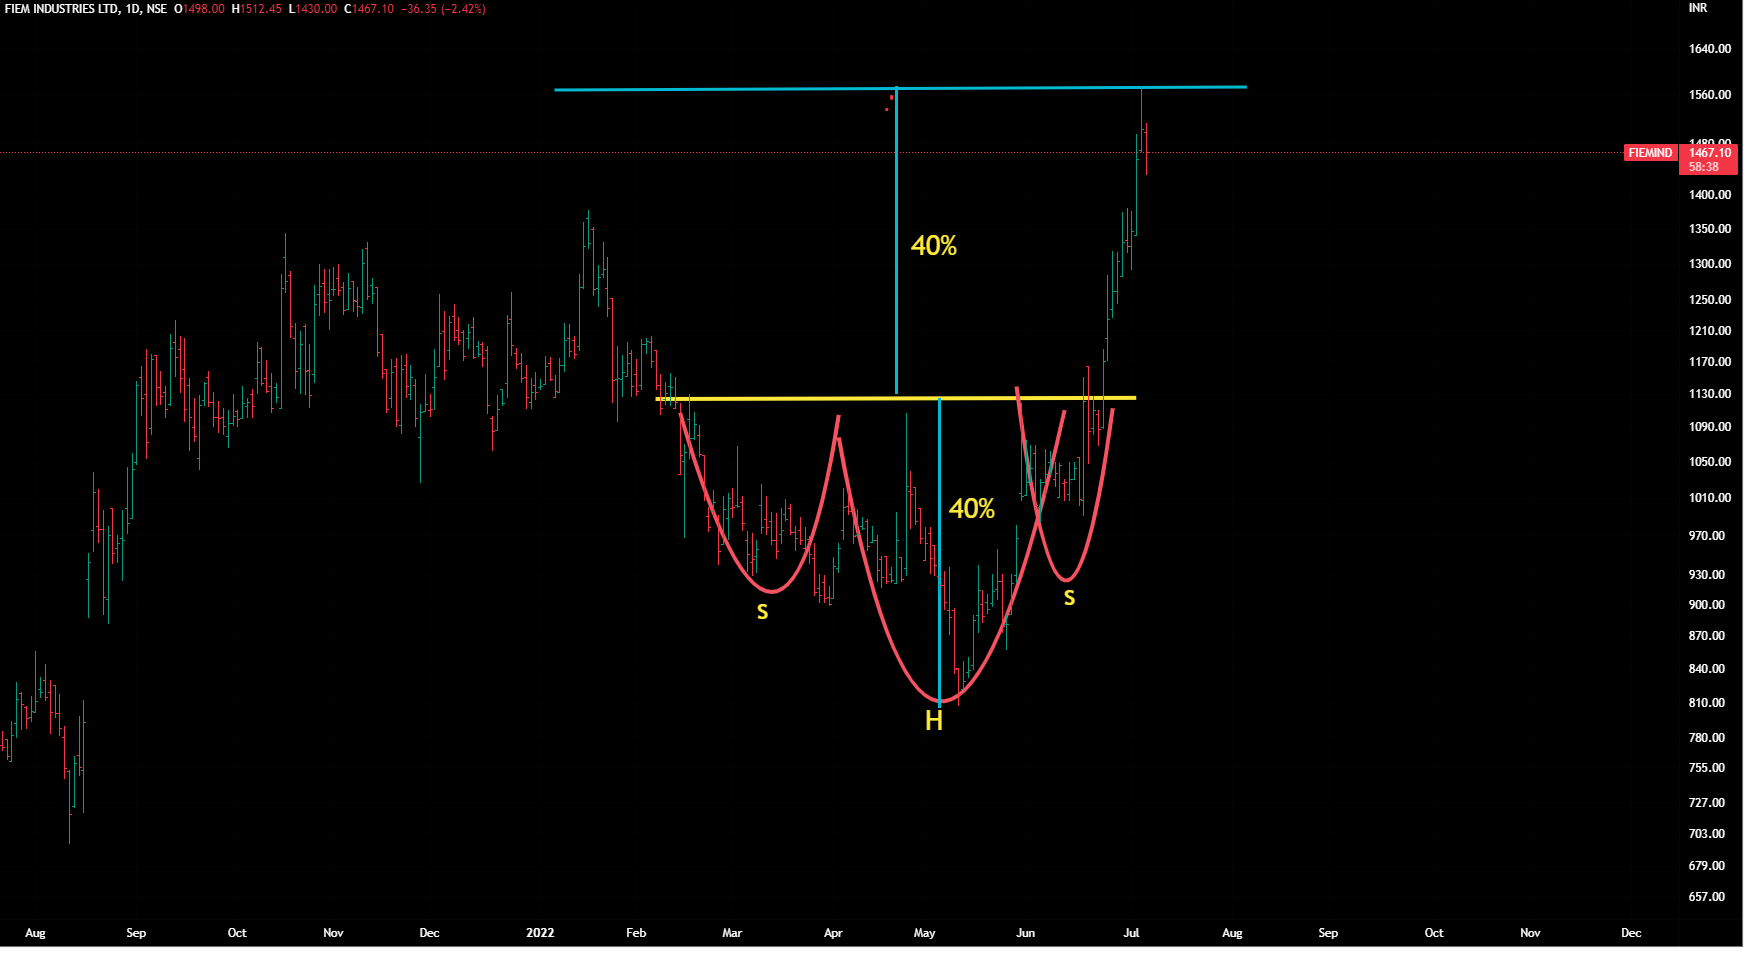
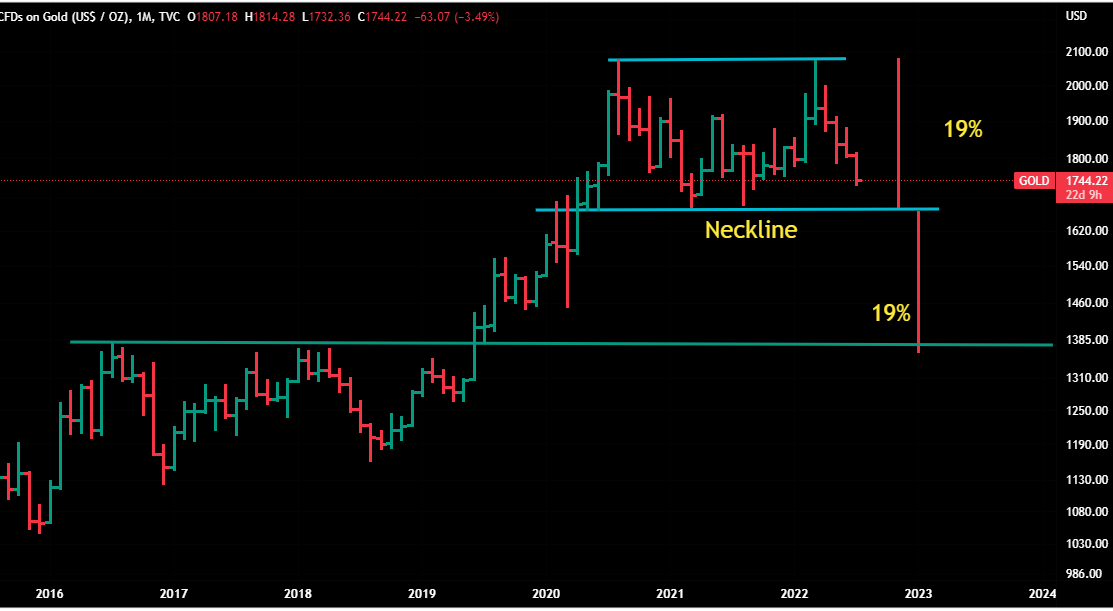
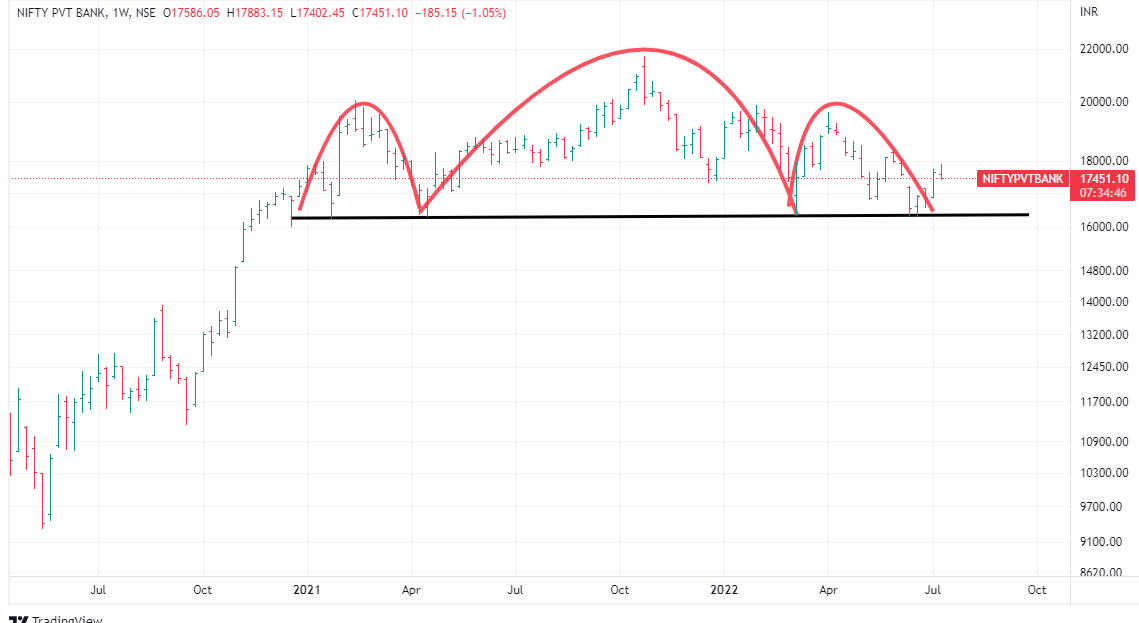
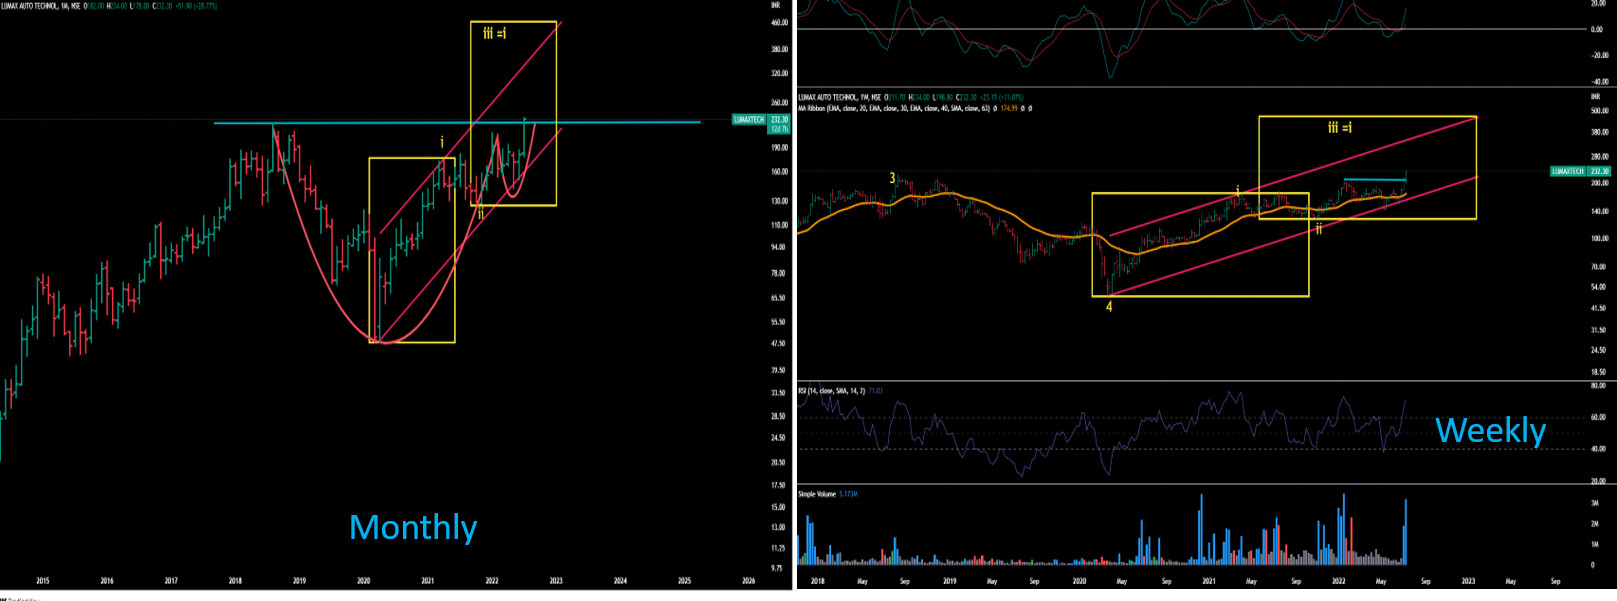
This is just to exhibit how patterns work ( if they work- matter of probability)
Head & Shoulder patetrn - if it is identified rightly and it plays out - target for H & S happens to be equal to the length of head from the neckline (in % ge terms)
I was thought this thread was stopped in May and hence not came back here. But today when saw the thread i am happy to see and when read this theory got more happy as had a good position in gold from March 22 and planning to be there till next 12 to 18 months at least (depend on technical charts). Would like to take this opportunity to THANKS for starting this thread, a lot of learning from your posts.
First of all sorry to intervein in this chat but its answers my questions too. Still i have 3 questions here would be great if you can answer as time allow …
How to get knowledge on inter market or asset diversions. like equity, gold, bonds, oil etc any book or blog would be really helpful.
For shorting do you use any hedging or its naked futures for long term (1\2 months) and do you use any collateral from existing positions like NIfty ETFs or MFs holding (can we use that for stock shorting as a margin).
What is best way to get 25% CAGR from now onwards.
Really …i feel like now its bit easy to see a notional loss with good companies in dmat rather than a cash in account …because it gives temptation…FOMO …and since cash in hand khujali on hand always to buy something since its down a lot from top …but technical and stage investing helping a lot to get away from noise and be strict to your plan … because most of the prices are getting down from last week …so lets learn and earn on this wonderful forum …Tx
While we are in a counter-trend bounce ( a bear market rally) , tried to analyse whether worst is over !
Well here are few data points :
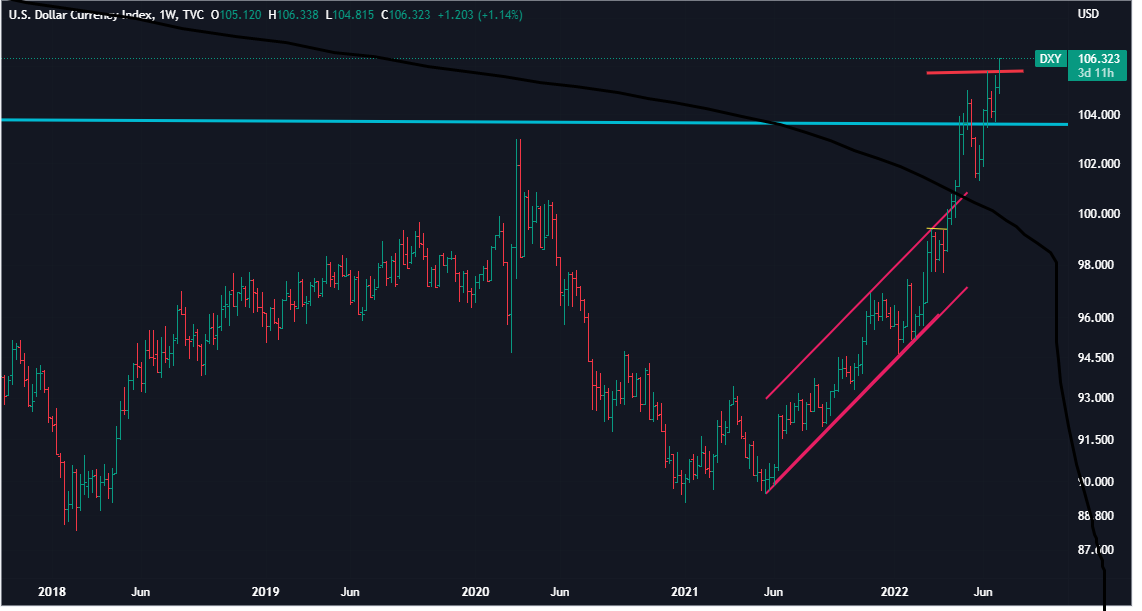
Point 1 Macros indicating the turbulence ahead
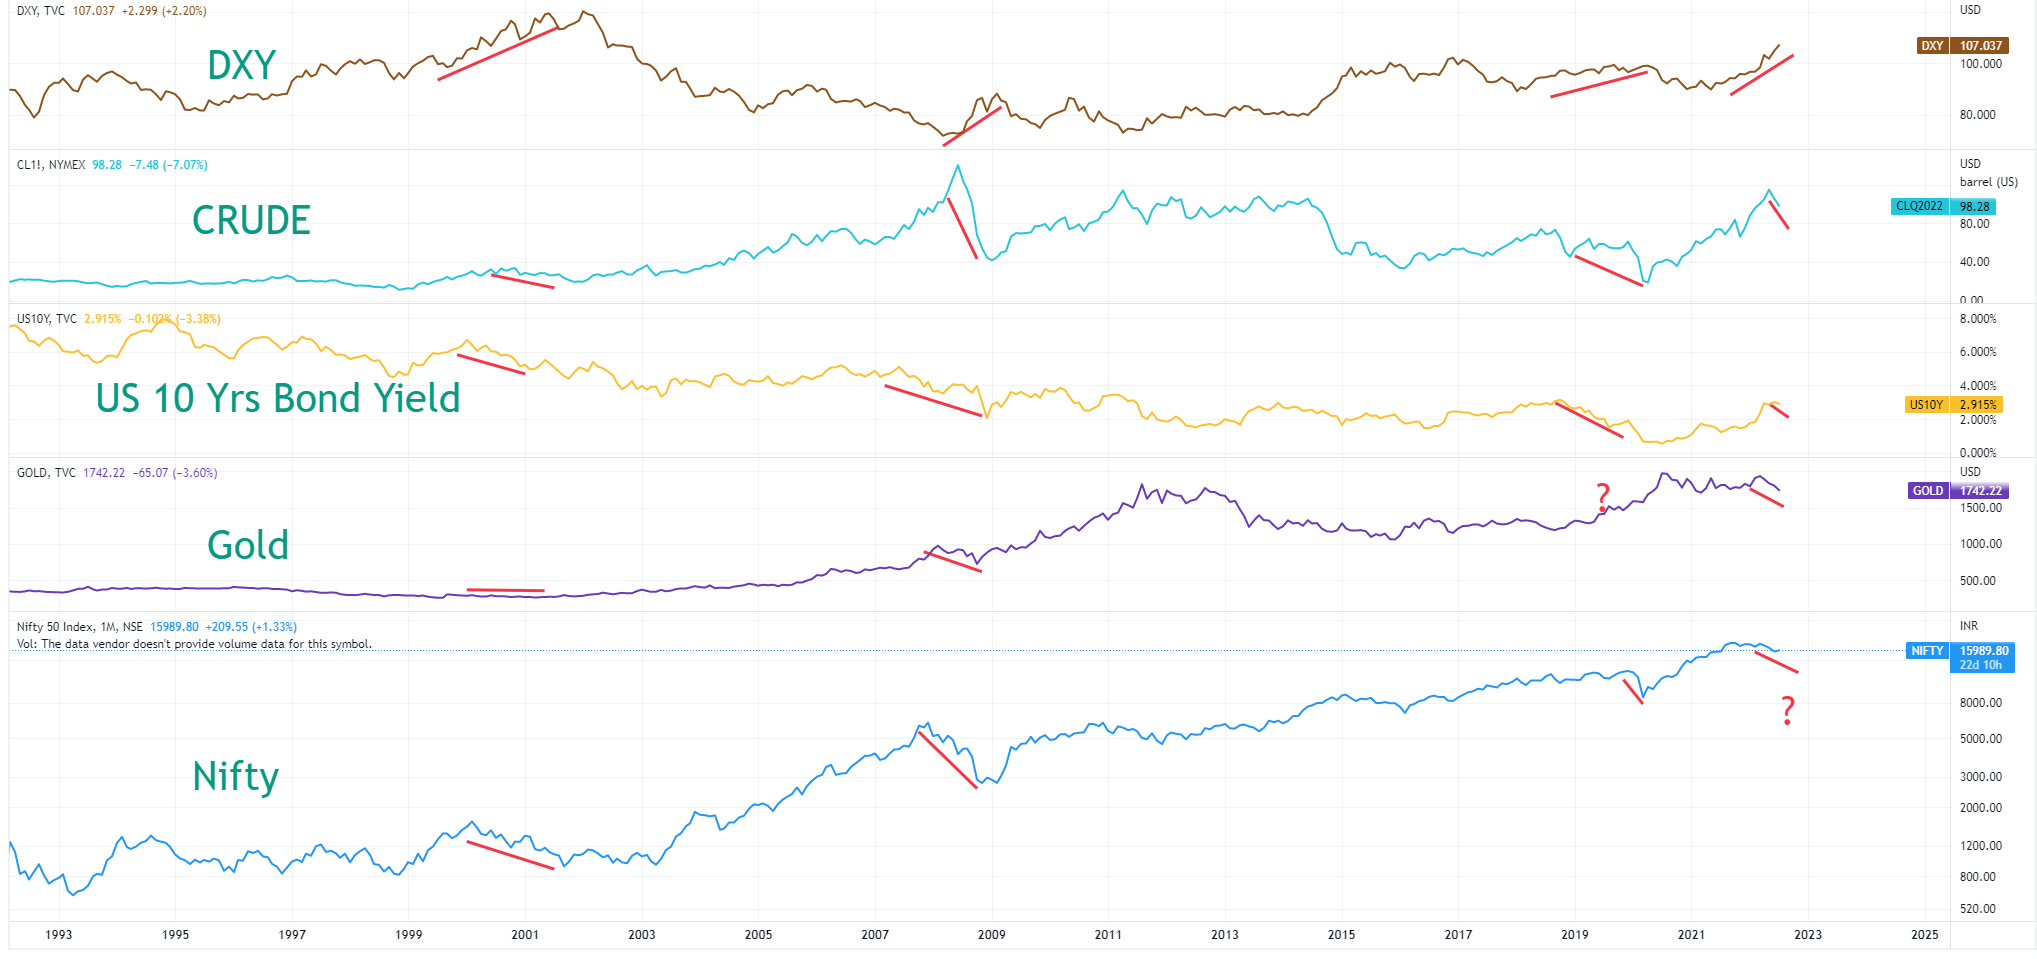
Whenever DXY goes up, US 10 Yr Bond prices, Crude Oil as well as gold goes down …Nifty also goes down ( although there can be a time-lag)
Here is a chart on inter-markets correlations - depicting the movement of various asset classes before the mega -falls - Dot Com bubble, Financial Crisis, Covid fall and current situation .
(After 2020 , gold has not been a reliable indicator , as Bitcoin emerged as a new asset class , hence lot of liquidity related confusion started happening )
Currently 3 of the 4 indicators are pointing towards a fall.
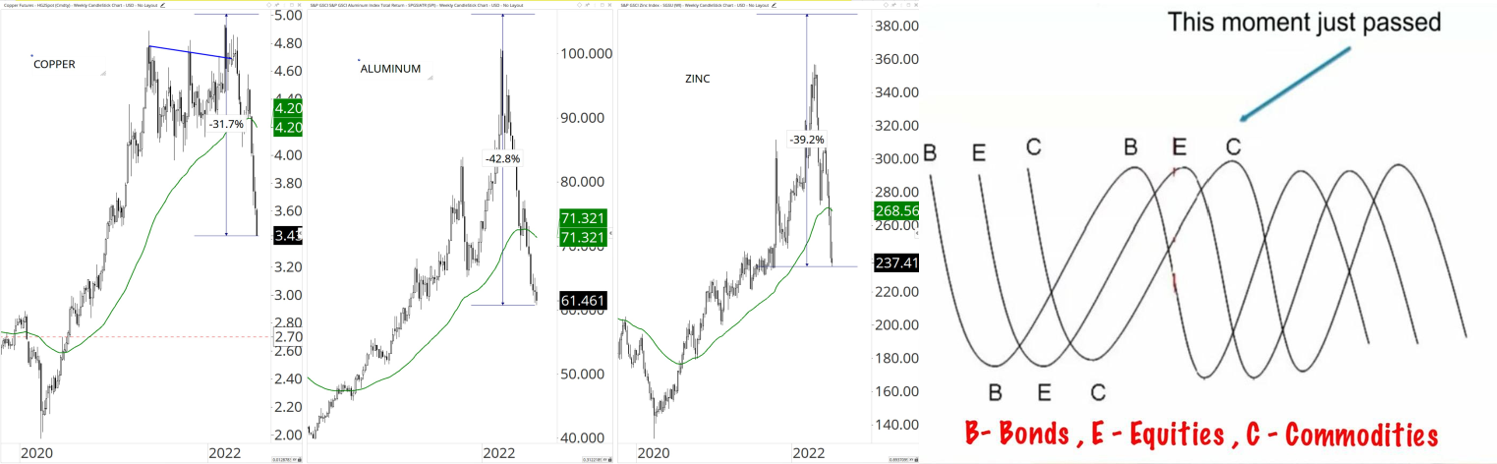
Point 2 :Commodity stocks has started falling just now
Historically it has been observed that commodities stocks are last to fall and that signifies the end of the bull market. Once commodities-related stocks start falling, then equities might fall more .
Caution: After a big fall, all stocks give a temorary bounce , so don’t feel that bull-market is back. Temporary pull-back happens due to short-covering, some buyers emerging who compare the fall from the top and think that they’re getting a bargain and some buying emerges from recent -bull market newbies who think every dip is a buying opportunity.
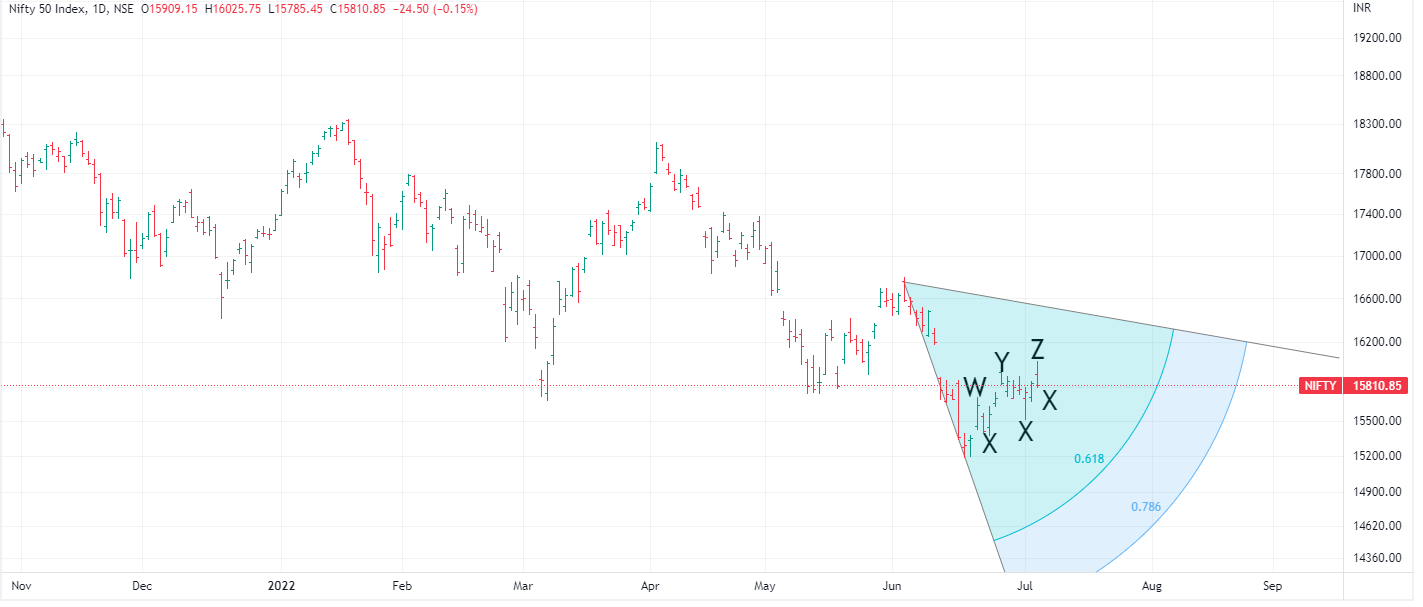
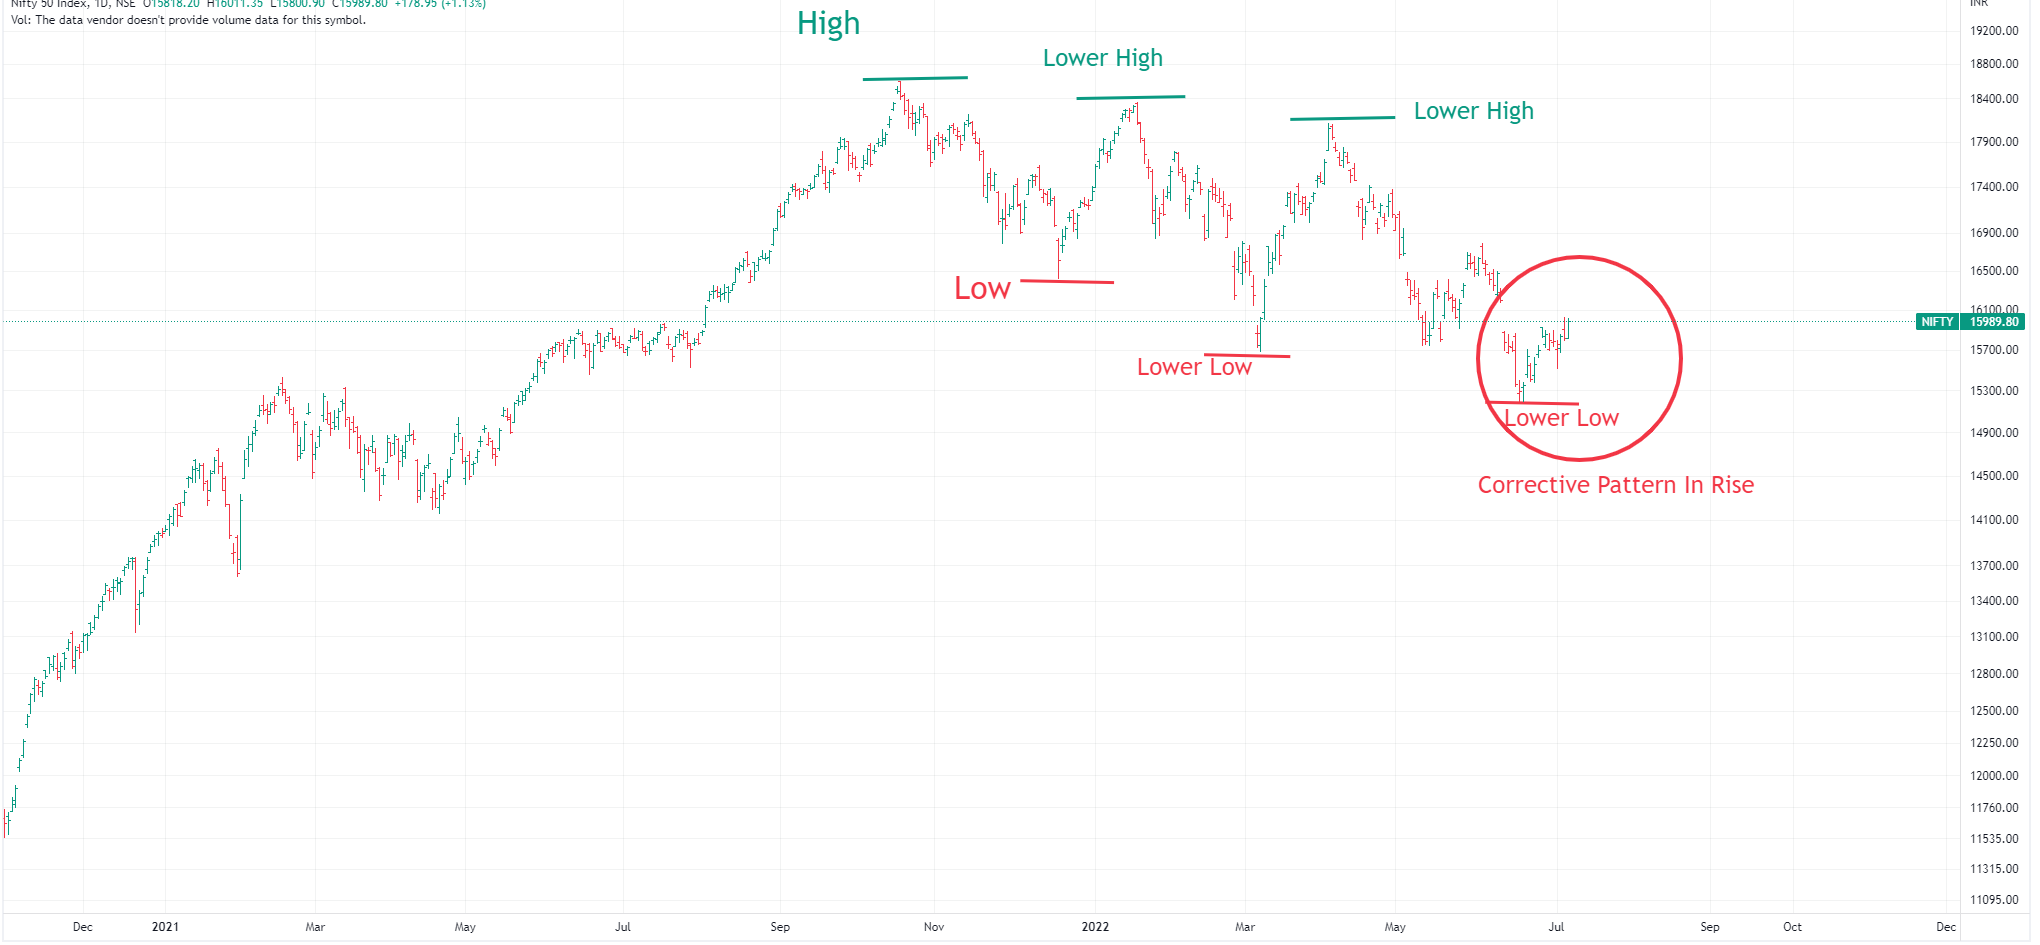
Point 4 -As per Elliot Wave theory , any long uptrend or downtrend should start with 5 continuous wave towards the trend.
Analysed recent bounce, it is still a corrective bounce ( 3 waves bounce ) , till the time we don’t see a clear 5 waves bounce , we’re not certain that we’re out of woods.
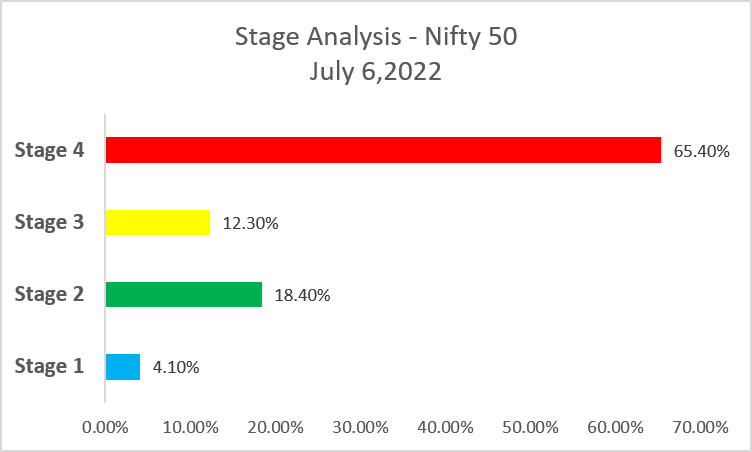
Point 5: As per stage analysis , majority of NIFTY 50 stocks are in Stage 4 (65.4%)
Stage 4 refers to a declining phase. To come back, they need to cross the resistance of 30 WMA ( not an easy task with a low liquidity scenario ). Need huge institutional buying to take so many stocks to back to Stage 2 .
(Note : as per yestrday’s closing data, in US Nasdaq index , about 72% stocks are in Stage 4 and in DOW index the stage 4 stocks %ge is about 62%.)
Conclusion Market might go up near 17000 in this counter trend scenario ( best case scnario ) but this is not a start of a new uptrend ( as per current data-points).
We think that we’re yet to make a bottom and a new wave of fall is yet to come.
In this counter-trend bounce, our strategy is to sell our mistakes ( yeah we are still keeping 30% money in the markets ) ,look out for something highly undervalued and we can see a clear 5 wave impulsive up-move in this bear rally ( but for that one needs to know EW well).
But mostly ( for 70% cash to be deployed ) , wait till we can see the whole scenario plays out or we see some uptrend in overall markets based on EW, DOW Theory, Macros and indications from stage analysis of the indexes.
Disclaimer : These are personal opinions. No recommendation, no suggestion.
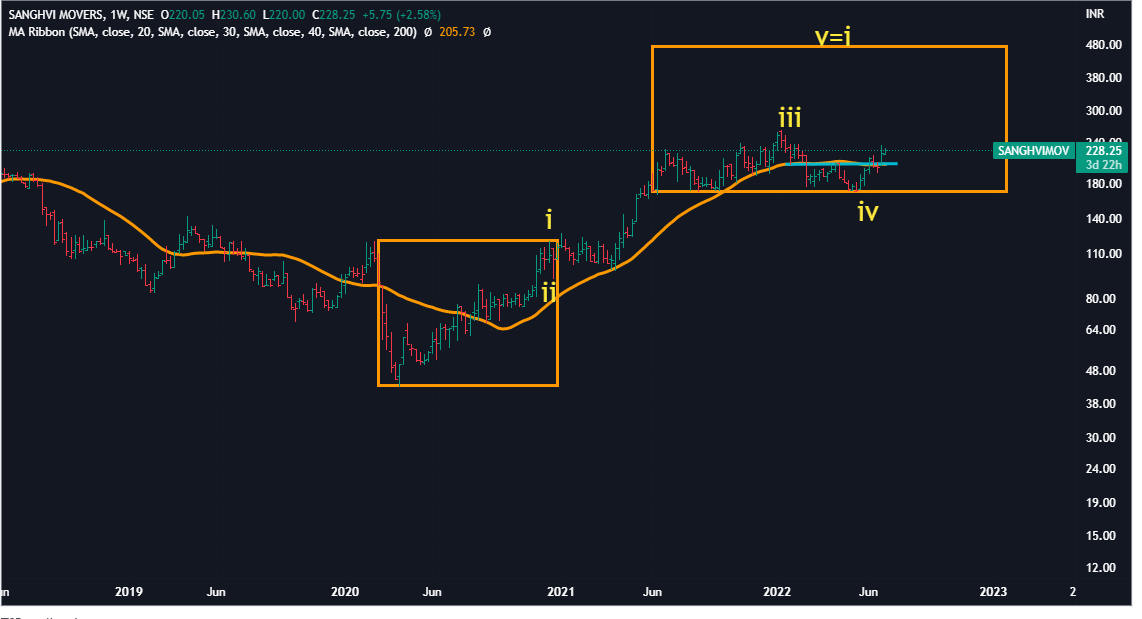
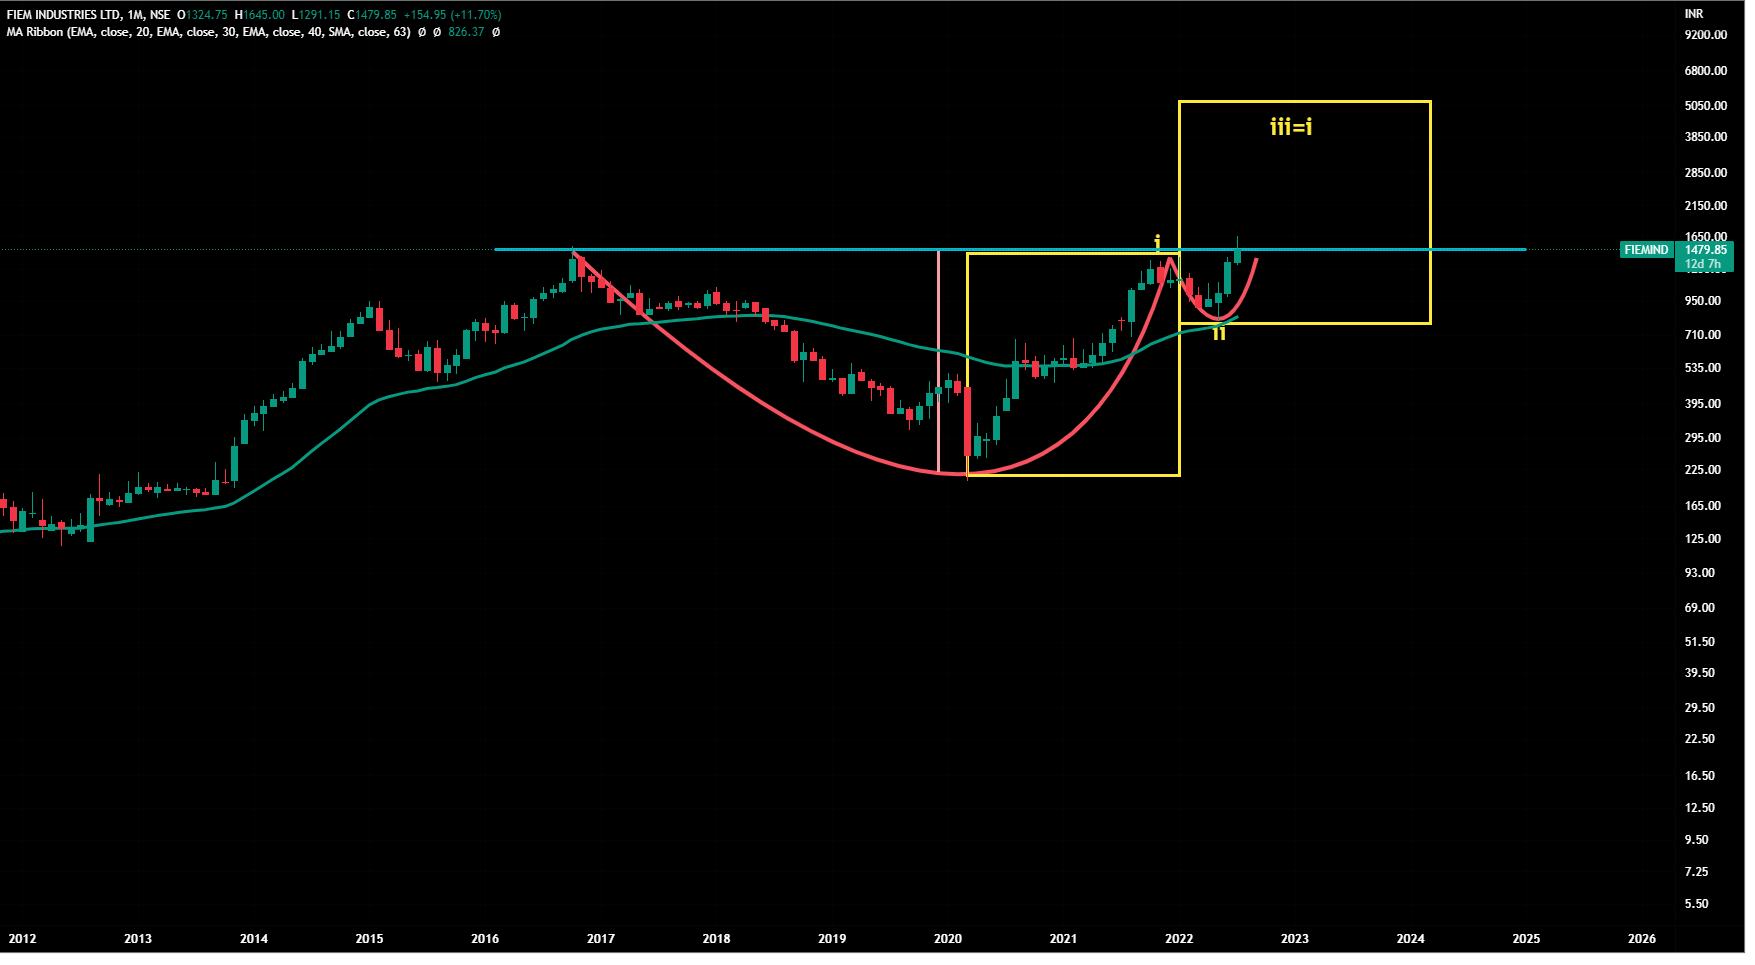
Apart from Fiem, Sterling Tools and Sanghvi Movers (all charts shared earlier), here is one more stock where we are playing counter -trend rally.
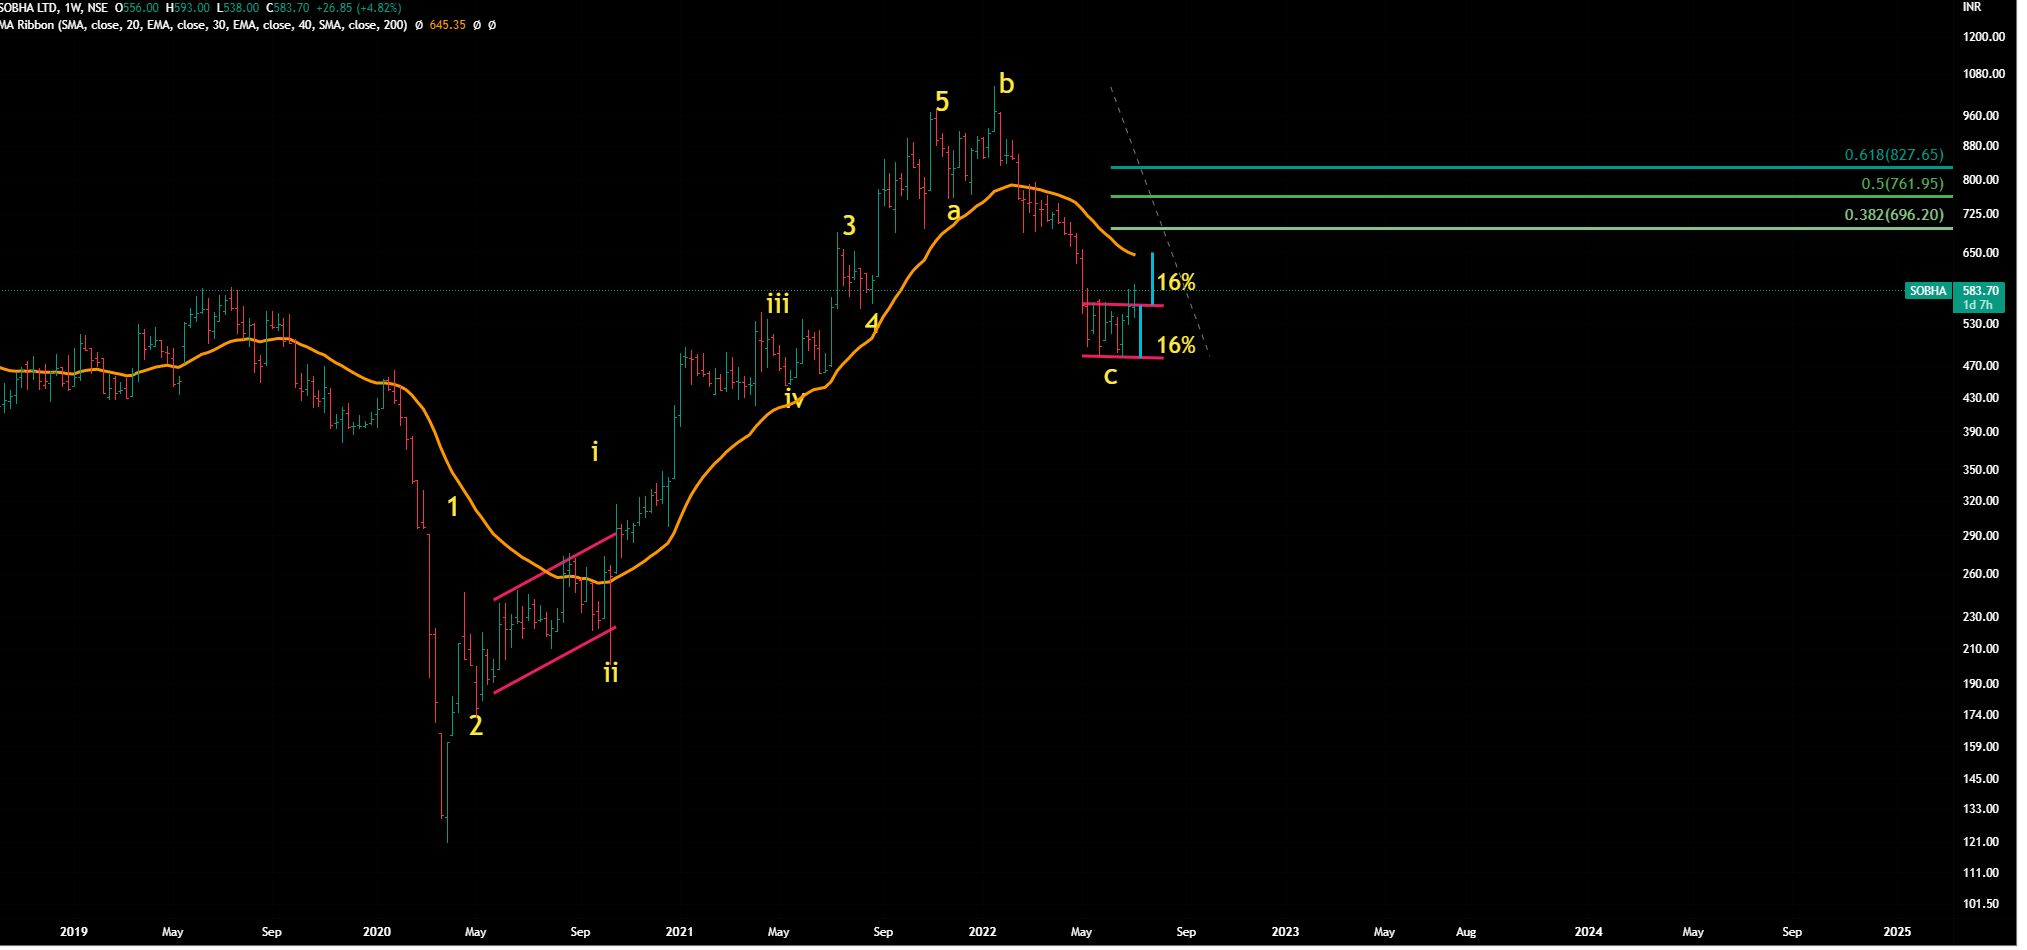
Sobha Ltd
We felt that it has done its first leg of correction (may be the final correction), when it bounced back in Wave 2 after exactly touching 61.8% Fibo retracement levels .
It moved in a tight range - made a Stage 1 base for 2 months and then came out of that trading range.
It was also a rectancle breakout - we expect at least a rally of 16% from the upper line of rectancle breakout.(near 645)
On daily chart, the rise from bottom seems to be in an impulsive wave ( 5 waves move as per EW )
It can retrace 50% (761) or 61.8% (827) , that is a normal expectation of from the bounces from the bottom.
It can rise further also but that would depend upon overall market sentiments.
For a technical-analyst, the watchout levels would rectangle top-line (560) , rectangle targets( 645), 50% retracemetn ( 760) , 61.8% retracemnt 820 (1-2% up or down), if it keeps crossing these hurdles, one would keep holding but if this starts returning back after touching these levels (closing for at least 1-2 weeks or a quick fall), one would be out.
Sorry to say that there’s no publicly available website for the same. You can do it yourself by on chartlink - just sort out stocks above 30 WMA.
But that alone won’t be of much use, one needs to check these manually to see the situation of trading range, left side resistance levels, time of base formation and breakout of the trading range.
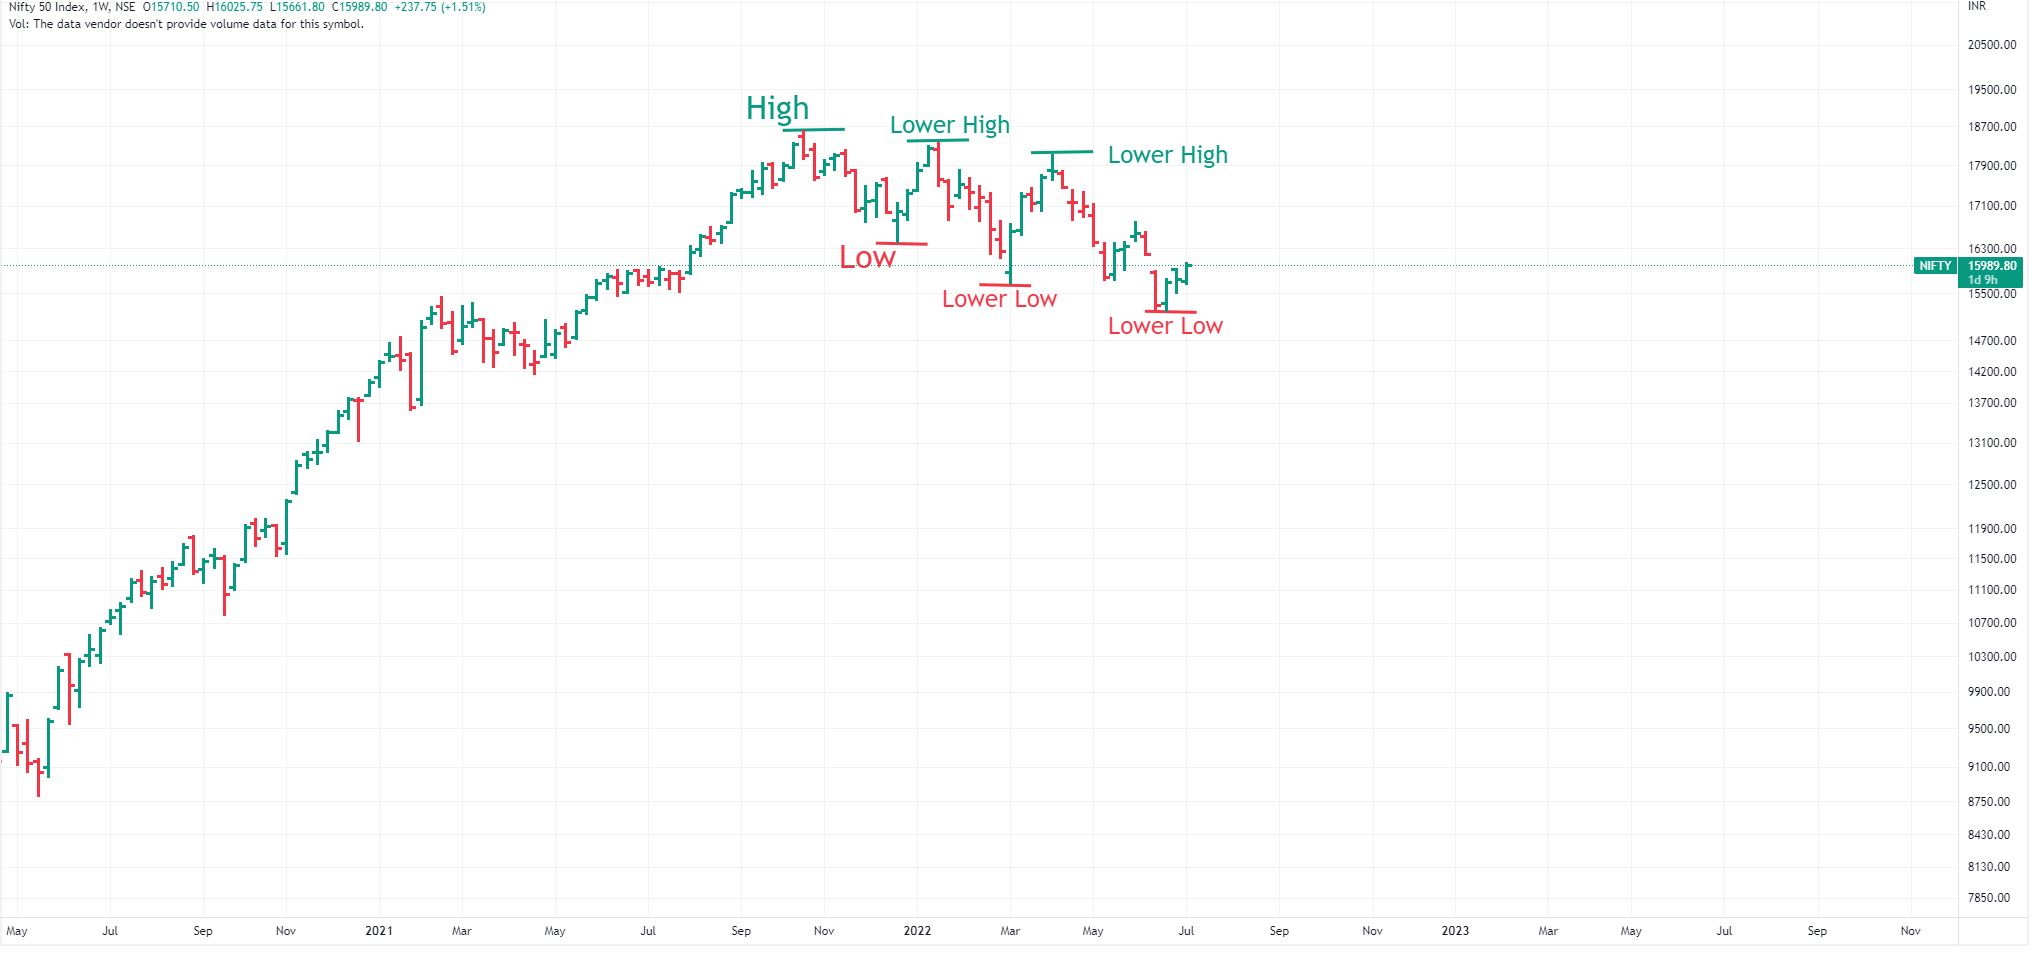
@StageInvesting Would appreciate your views on what do you derive out of such conflicting patterns. How to determine probabilities of medium term trends. Which pattern would you give more priority to determine those probabilities. Does this still show classic early Stage 4 pattern or confirmed trend reversal based on lower highs line breaks.
If your question is related to stage analysis , let me clarify few things.
1) Stage Analysis
i) Try to use weekly-chart to check weekly averages .
All MA indicators would give avearges as per the time-frame chose by you ( i.e. on weekly charts ,it would be WMA and on monthly chart ,they would automatically become monthly moving averages.
ii) If you presfer daily charts, can try 150 days average -5 trading days in a week- 150 trading days in 30 weeks.
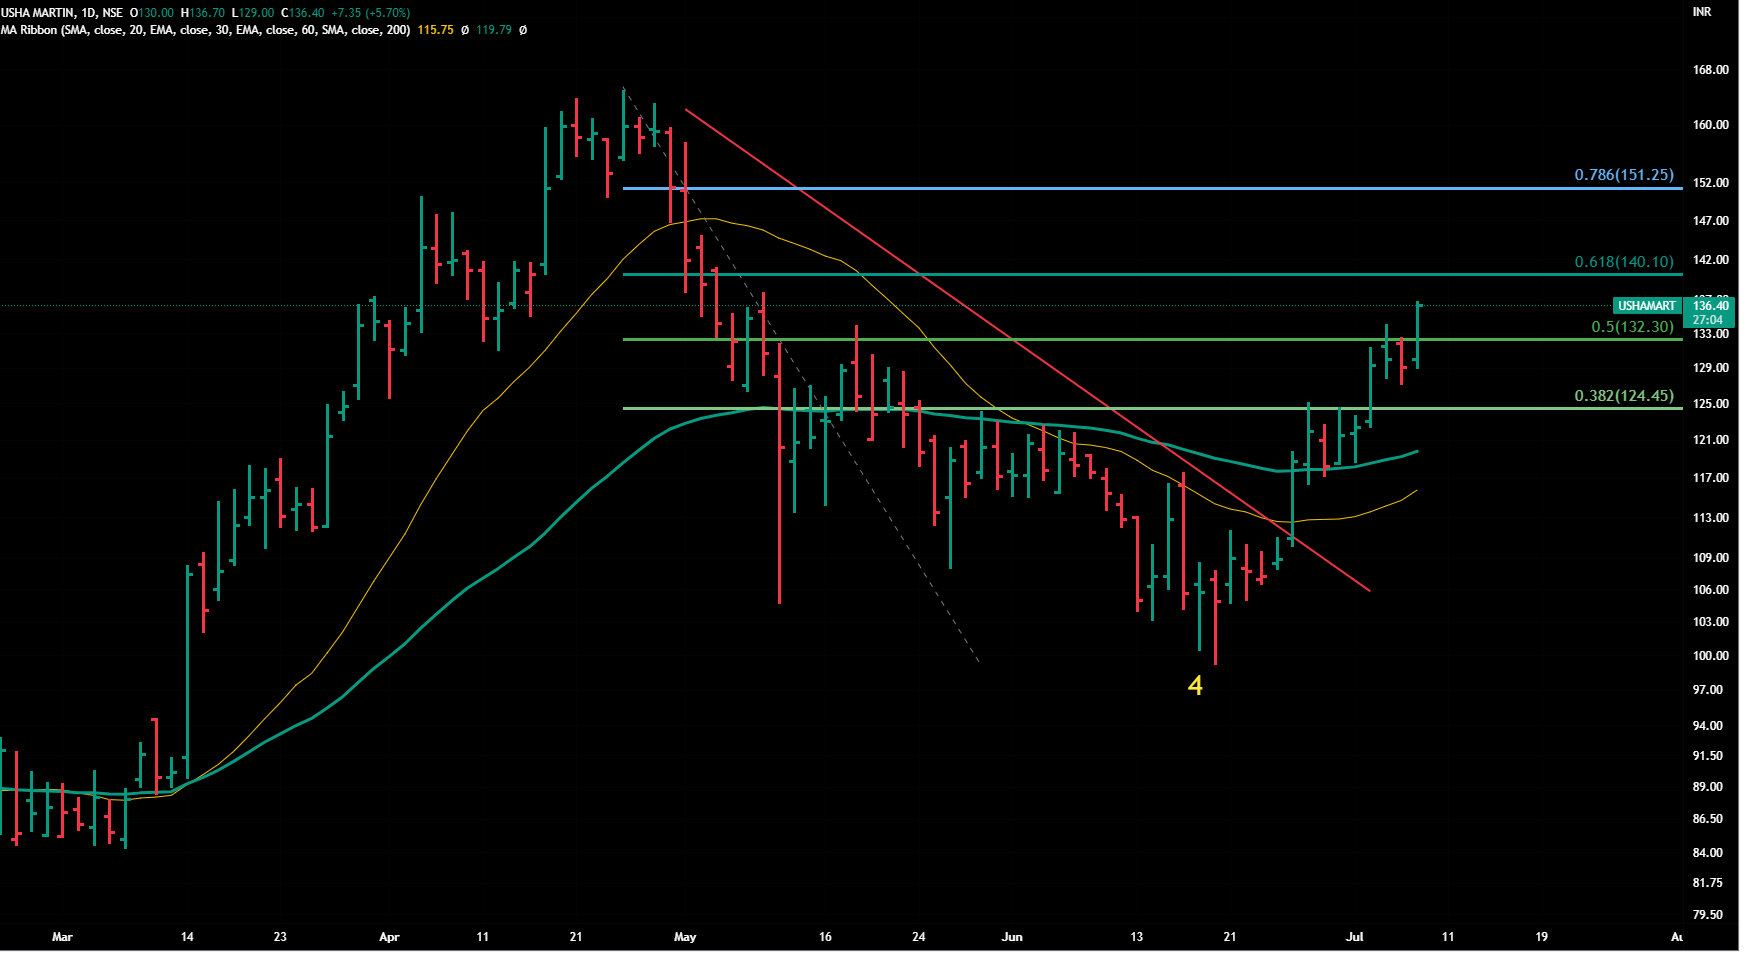
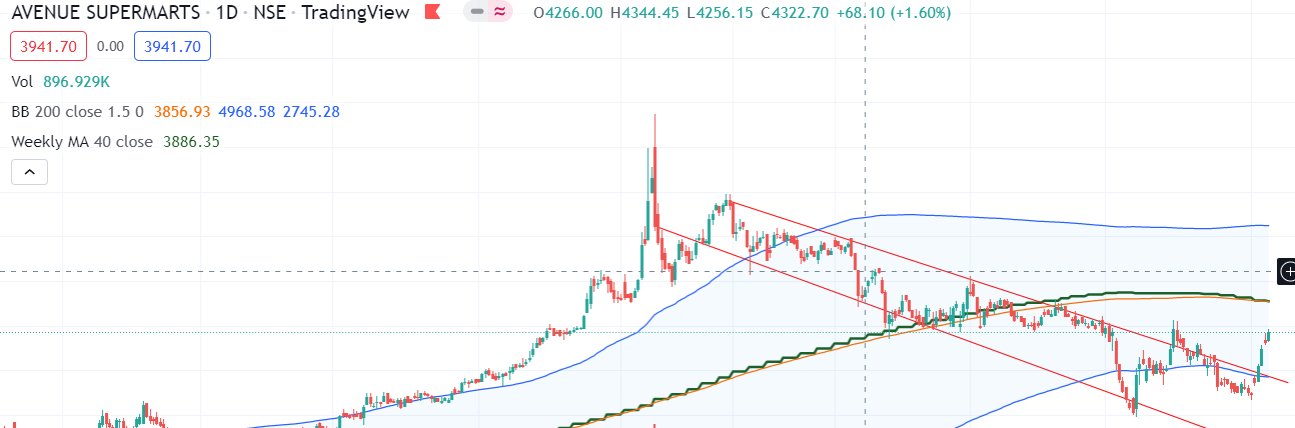
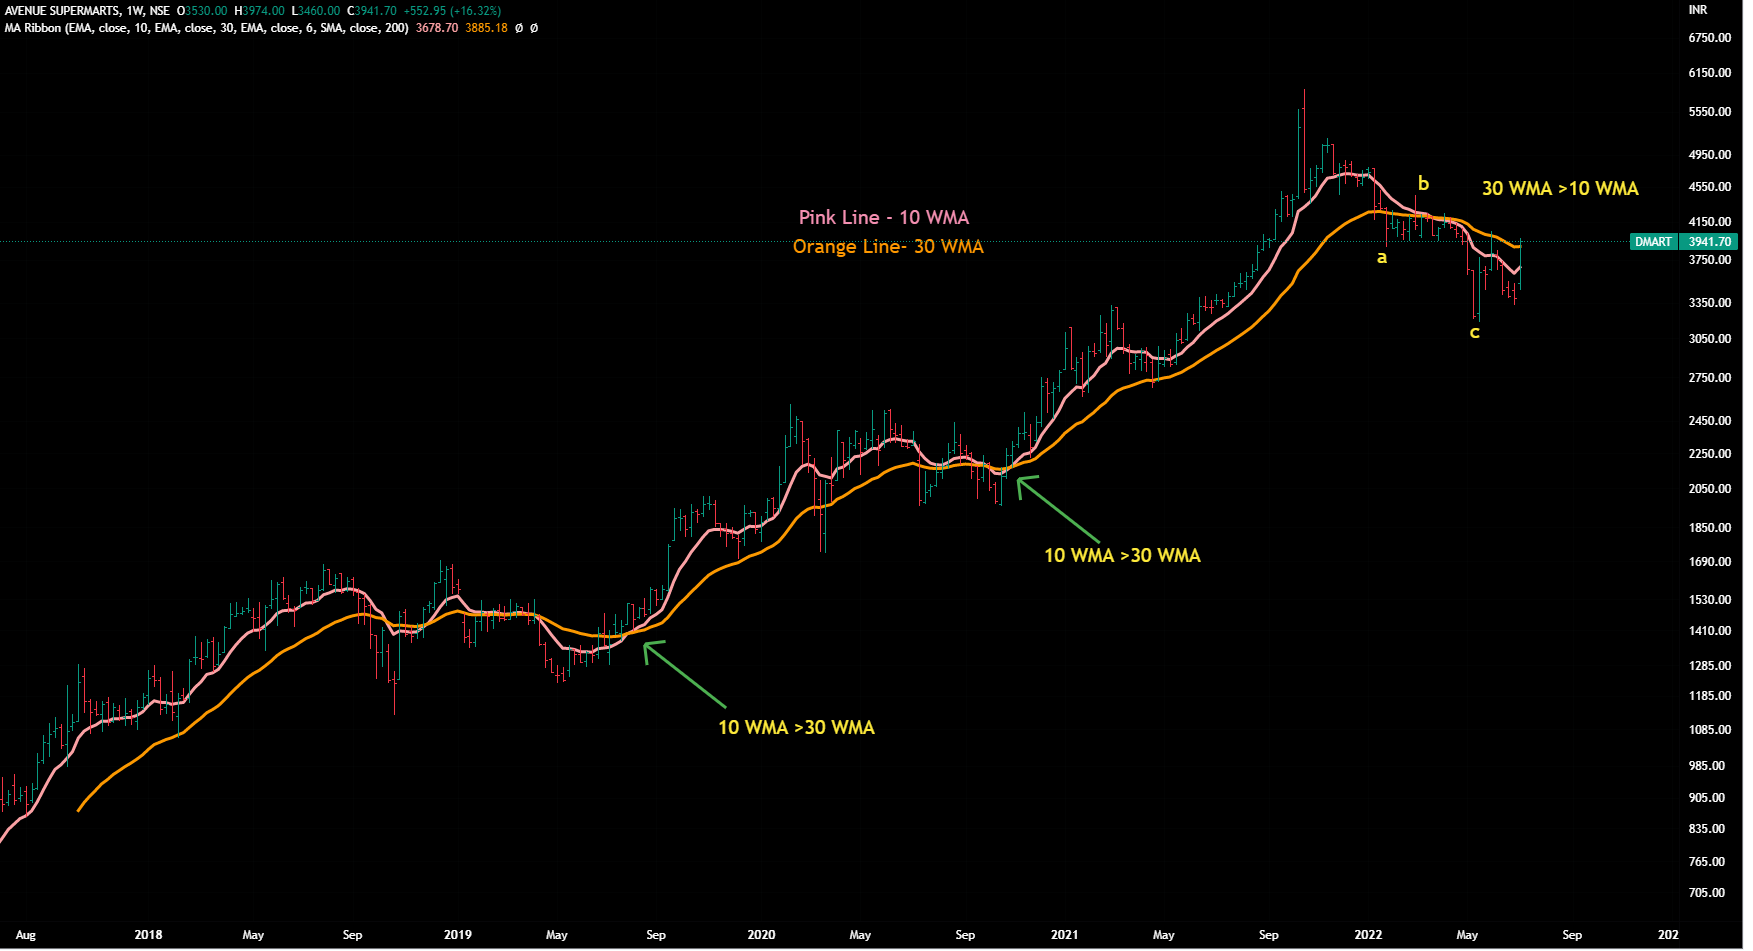
iii) Apart from 30 WMA, other important average is 10 WMA ( 50 days moving average on daily chart. For a succesful journey in Stage 2 , 10 WMA should be above than 30 WMA . ( you can see the following chart of your stock, currently 10 WMA is hovering lower than 30 WMA)
iv) Trading range break-out and overall market sentiments - stocks would keep going up and down for a long period in a bear market. No stock prcie would be static. Stock-prices would move up and down even below 30 WMA - but these are short -term trading opportunities , don’t have high hopes till the time it does not breaks above by following all the rules of base-formation as well as stage-analysis.
Like said before , there are always trading opportunities in the markets - every minute, every hour, every day, every week, every month . But the extent of gains become smaller and smaller with reducing time -frame ( may people trade too huge quantities too overcome the shortcoming of % gain per unit over a shorter time-period) . But one needs to master the same and it takes lot of time and efforts. And there are several methods to achieve the same.
In bear markets, we look for trading opportunities in following ways :
i) We wait for one leg of correction to be over . As we practice ELLIOT waves, we know that after every ABC ,there is a chance of 50 % to 61.8% retracement of last leg (C) or in best case scenario ,the retracement of 50% to 61.8% of whole retracement (full ABC - top to bottom) - you can see 61.8% levels of your stock in the following pic.
ii) We also look for left side resistances - of there are less resistances ,high probability of a higher move .
iii) Plus we check market as well sectoral condition - if market is bouncing back and a particular sector is in favor - retracement will be faster and higher (61.8%)
iv)Plus many a times we ignore all of the above if we see some pattern formation below 30 WMA. In that case, we can play for pattern -targets - knowing full well that it can ditch us any day as it is below 30 WMA. All bullish patterns become less reliable below 30 WMA.
Additional clarity on 2 (i) - what if retracement is higher than 61.8% and stock keeps going up , in that case we look for the following :
i) Is there a clear impulse move ( 1,2,3,4,5 ) as per EW rules
ii) Stage condition
iii) We don’t rule out trend-reversal till the time stock does not retrace 123% or 138% ( conservative basis) of the whole decline.
Little exhaustive but hope gave you a full prepective.
In short, every field needs lot of learning, hard-work and exeprience to make serious gains.
We have a good set-up for short-term bounce in coming 2 weeks ( lot of bad news already absorbed by US markets last week, DXY in oversold position, FED tone is little less hawkish , huge shorts in US - a short covering might come).
We’re closely tracking the follwoing 4 very closely ( few very risky).
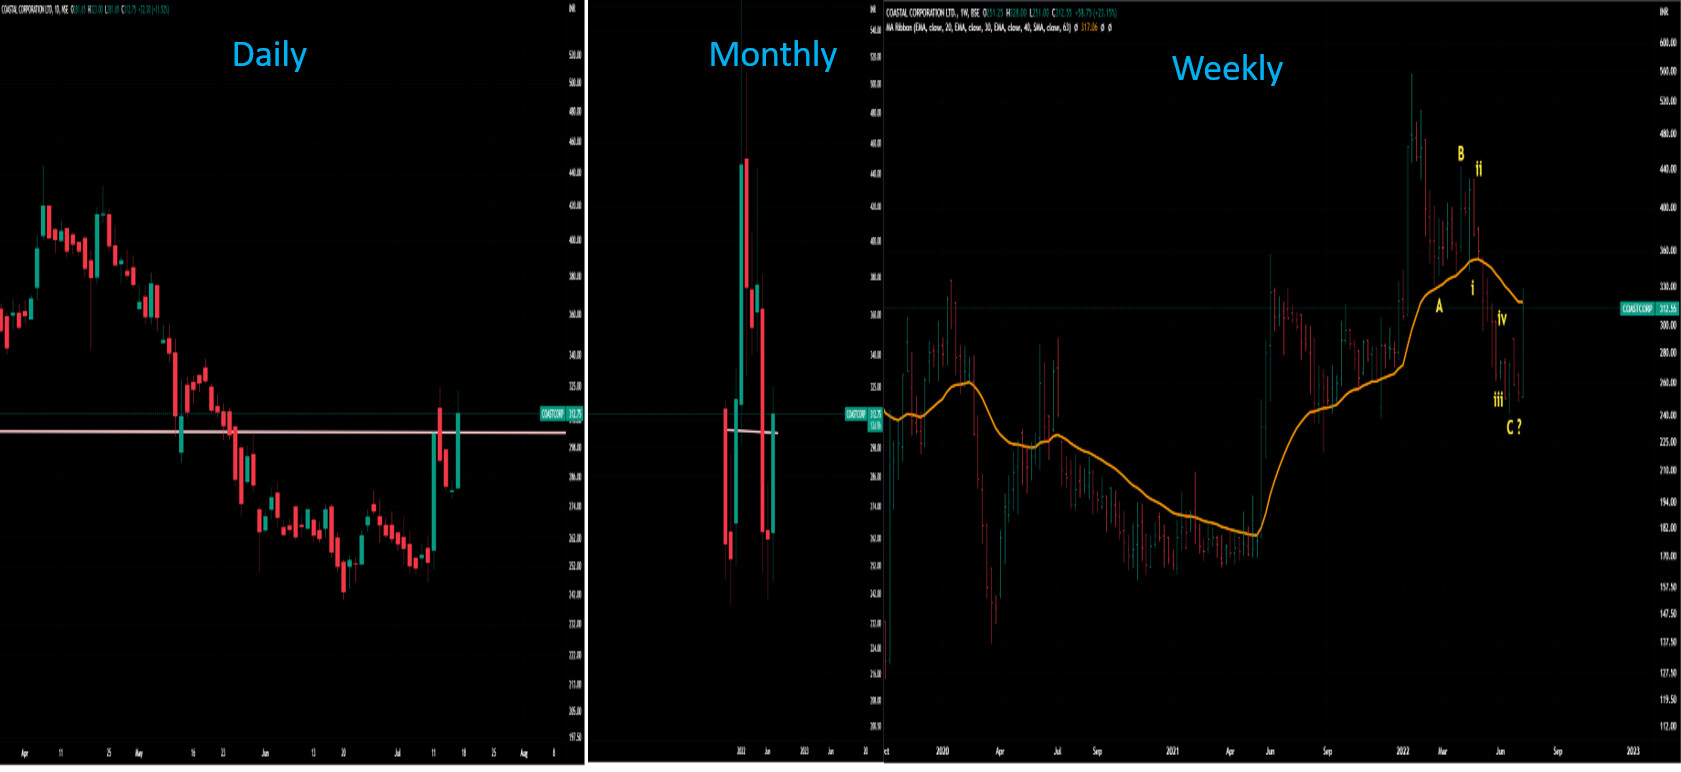
Coastal Corporation
A morning star on daily, also a morning star under formation on monthly (although month is yet to close ), and it seems that correction (ABC) is over in last week + huge volumes + good reports coming on shrimp exports.