StageInvesting +Elliot Waves

Hello Sir,
Can you please address the view on Greenpanel technically as the stock hasn’t seen much correction in its history but rn has broken major moving averages.

Want to learn from your view how to check these type of charts.

Not Invested, Tracking closely.

Redington :Adding to the series of long term holdings

Had made double bottom and a nice candle -pattern on the weekly chart on last Friday.

Broke the falling channel yesterday and today giving confirmation of the break-out. Also seems to be making a 5 waves impulse on daily.

We’re still not completely out of the woods - we’re very near to a resistance at 135 . And still hovering below 30 WMA.

To start its new journey on upside, it needs to close, start trading above 148 , otherwise the reverse journey migh start,


Disclaimer : Invested and biased. Charts are for study purpose, no reco, no suggestion.

4 Likes

Hi @StageInvesting Can you help me with the below chart of TD Power. As per me, it is forming a cup and handle pattern. Am i right in my assessment ? I am confused about the Pivot point is it around 480.

Is it ok to look at Cup and Handle for such a long time frame ?

Request your feedback

Only for learning, No positions.

for gufic Q1FY23 there will be huge yoy degrowth due to no covid related revenue. so can see gap down opening once q1fy23 results come. And by that time if price is already below 197 can expect further downside. but next year full indore capacity will come online and that has a size 1.5 times of present capacity. so big growth since next year.

We went upto 15900 -now retracing…there’s an expectaion that we might go near 16400-17000 but currently there’s a tussle in setiments -depreciating INR (negative ) and decreasing oil-prices ( positive) - very much divided paths — one pathcan take it to 15400 and other path goes to 16900… let the market decide in next few days.

Bear Market Traps

Bear markets trap gullible investors on its way down …market wants more and more people to get trapped. It gives short term rallis so that all the dip-buyers of recent bull-run regain the confidence that we’re back towards upmove.

Even technical -analysts get trapped - bullish patterns are formed on the charts when market wants to tempt everyone.

Thre key US indices - a bullish pattern followed by a bearish pattern … days are small and then nights become longer.

4 Likes

Acrysil crossed its first hurdle today …622 now…let’s see how far it goes.

1 Like

TD Power

Well we don;t understand C & H patterns very well so won’t comment on that .

Can give you view from EW prespective.

Caution : We’re very bearish wrt next 6 months prespective as far as overall markets are concerned (except some temporary counter-trend bounces) , so we take every bullish pattern with pinch of salt. These days we try to have bullish as well as worst case scenario - and we invest very less amount even if find something interesting from fundamentals and technicals -analysis prespective.

Here are 2 views on this stock :

Yellow one- Bullish Pattern - but it to succeed ,it first needs to cross its recent ATH of 519 and then should cross/close and trade above 550 for few days/weeks. Otherwise it fails ( this pattern will also be no longer valid if the price goes below 400 in coming days .

Blue one - BEARISH PATTERN - as per this ,we are still in correction and may go back to 385 and further below.

Sorry , we’re not sure about which will play out. That’s why we keep saying that investing is a game of probabilities ( fundamental or technical paths ) .We would ride a stock like this with small amount but would keep selling as soon as keeps breaking the key support levels ( on opposite side, we would keep adding as soon as it breaks & closes above key resistance levels ) One needs to have serious risk-management method ie. to exit if something is not working.

Disclaimer : Invested and biased. Chart is for study purpose only , no reco,no suggestion.

1 Like

Sorry to say that EW works on the charts where investors’s participation is high ( mass psychology ) ,hence won’t be able to comment on this stock.

3 Likes

Thanks for the revert.

Its wonderful - a) that you accept that you dont know about C&H and b) you cant say where the stock is headed.

Been a good learning.

We know about C & H but don’t rely too much on it during bear markets. And in a bull market, almost every so-called bullish pattern works :sweat_smile:That’s why everyne is a genius in a bull -market as even one’s mistakes are rewarded ( but markets are ruthless in bear-phases)

4 Likes

Can you post chart of RIIL ?
(reliance industrial infra)

thanks in advance _/_

I believe @StageInvesting is not here to post charts on request. Please read the thread, do your own deep dive, share your findings and rest will depend on the goodwill of forum. Kindly refrain from such posts as it mars the decorum of forum.

3 Likes

IEX - One of our other favorite stocks

Became close to 8 X from Covid lows to October 21 highs…corrected 50 % from the top .( now need to move 100 % to reach the same levels)

Is the correction over ? Or we would take support near blue line (near 150) or worst case scanrio (137-140).

Let’s wait and watch.

Disclaimer :Started buying the dip since yesterday with a clear understading that we might dip more as overall market sentiments are bearish, hence invested. Views are biased.Chart is for study purpose only, no reco, no suggestions.

2 Likes

Appreciate your views and inputs. Thanks for helping us out.

You’re right , we’re here to help others to understand the technical part of investing. It is a part of standard practice in most of the western countries but somehow not prefered by most of the Indian investors (except traders).
Our effort is to exhibit that even long term investing can be managed well if we combine fundamental studies with technical charts.That is the reason that rather than posting simple charts, we tend to provide additional points for others to learn.

On second point on replying to others on their requested charts, we don’t any objection unless :

a) People should understand the technical-analysis is rooted in studying the past patterns of several stocks,taking the lessons and applying those to current situation. These may work or may not work . So risk management is the key. Like fundamental analysis , technical analysis is also based on certain assumptions ( these assumptions don;t come out of this air, rather manay of these theories and mathematical models are based on studying past 60-70 years patterns of various stocks )

b) We don’t have any objection to reply on stock queries as this also gives opportunity to study new stocks and manay a times we might find something worthwhile for ourselves too. So this is a win-win proposition. Yes , but if too many queries come, we might not be able to handle in a quick fashion and would be slow in responding.

5 Likes

RIIL

Please take our views after reading the following caution.

Caution : We’re very bearish wrt next 6 months prespective as far as overall markets are concerned (except some temporary counter-trend bounces), so we may sound more bearish and that might come out very wrong view

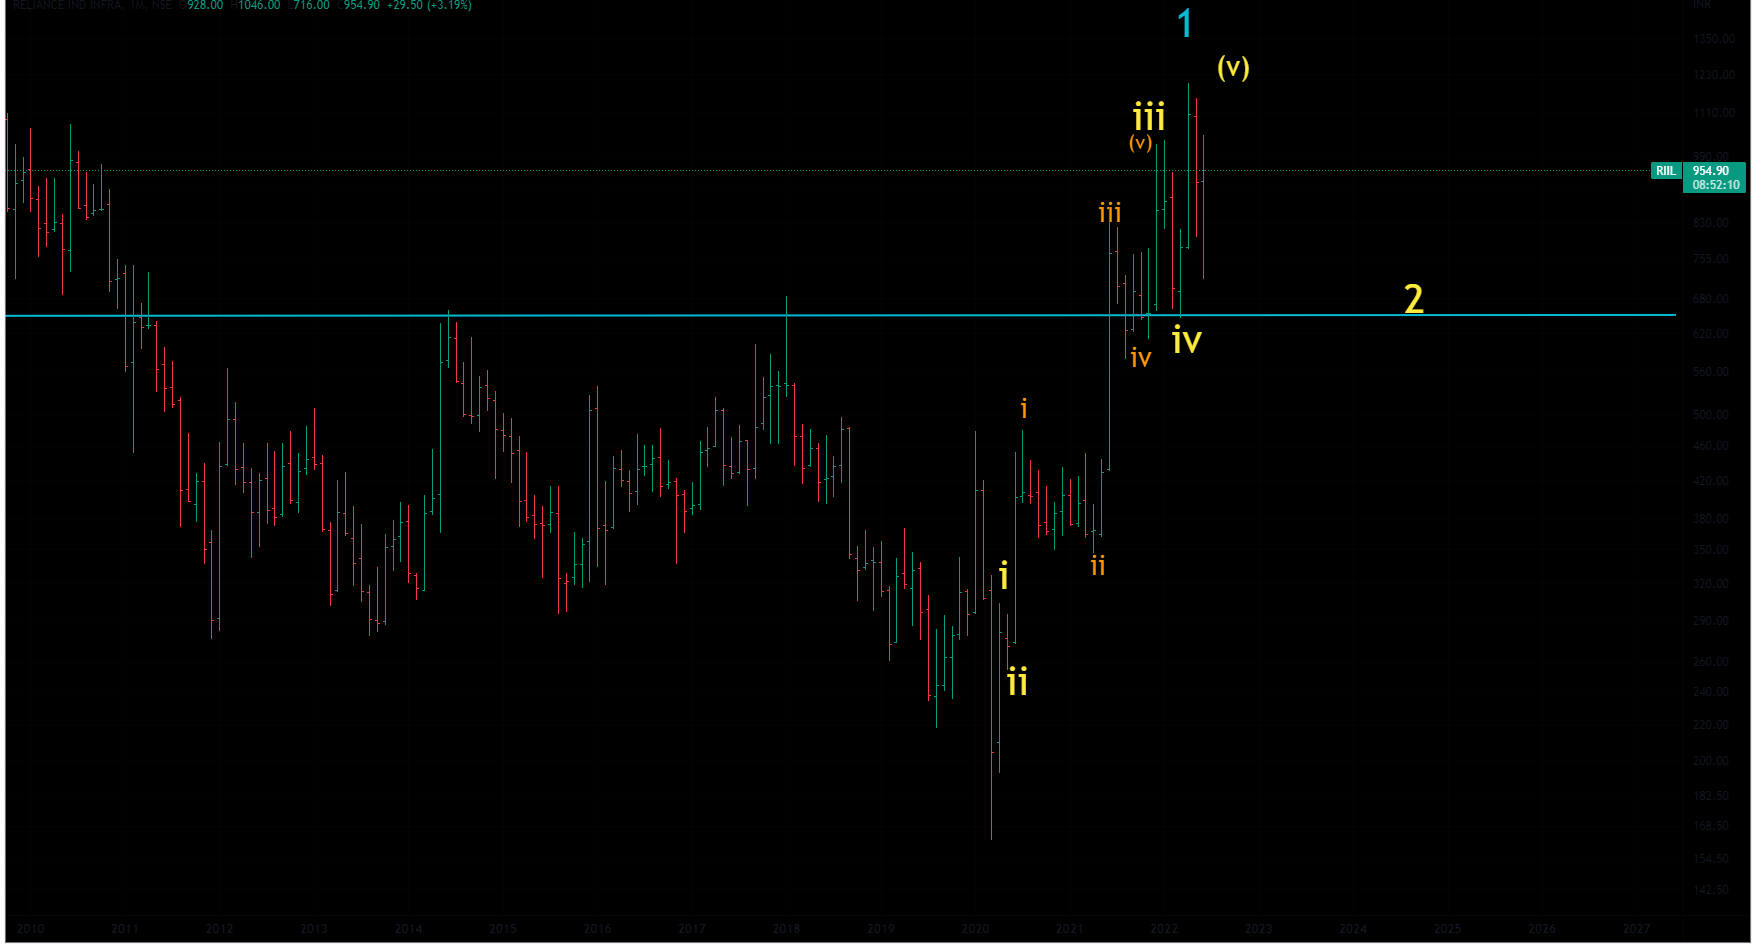
Here is the monthly chart of RIIL

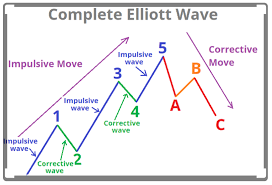
The analysis is based on EW theory.Just read the EW material in this thread for better studies . But for a brief overview of EW theory have a glance on the following picture .
download

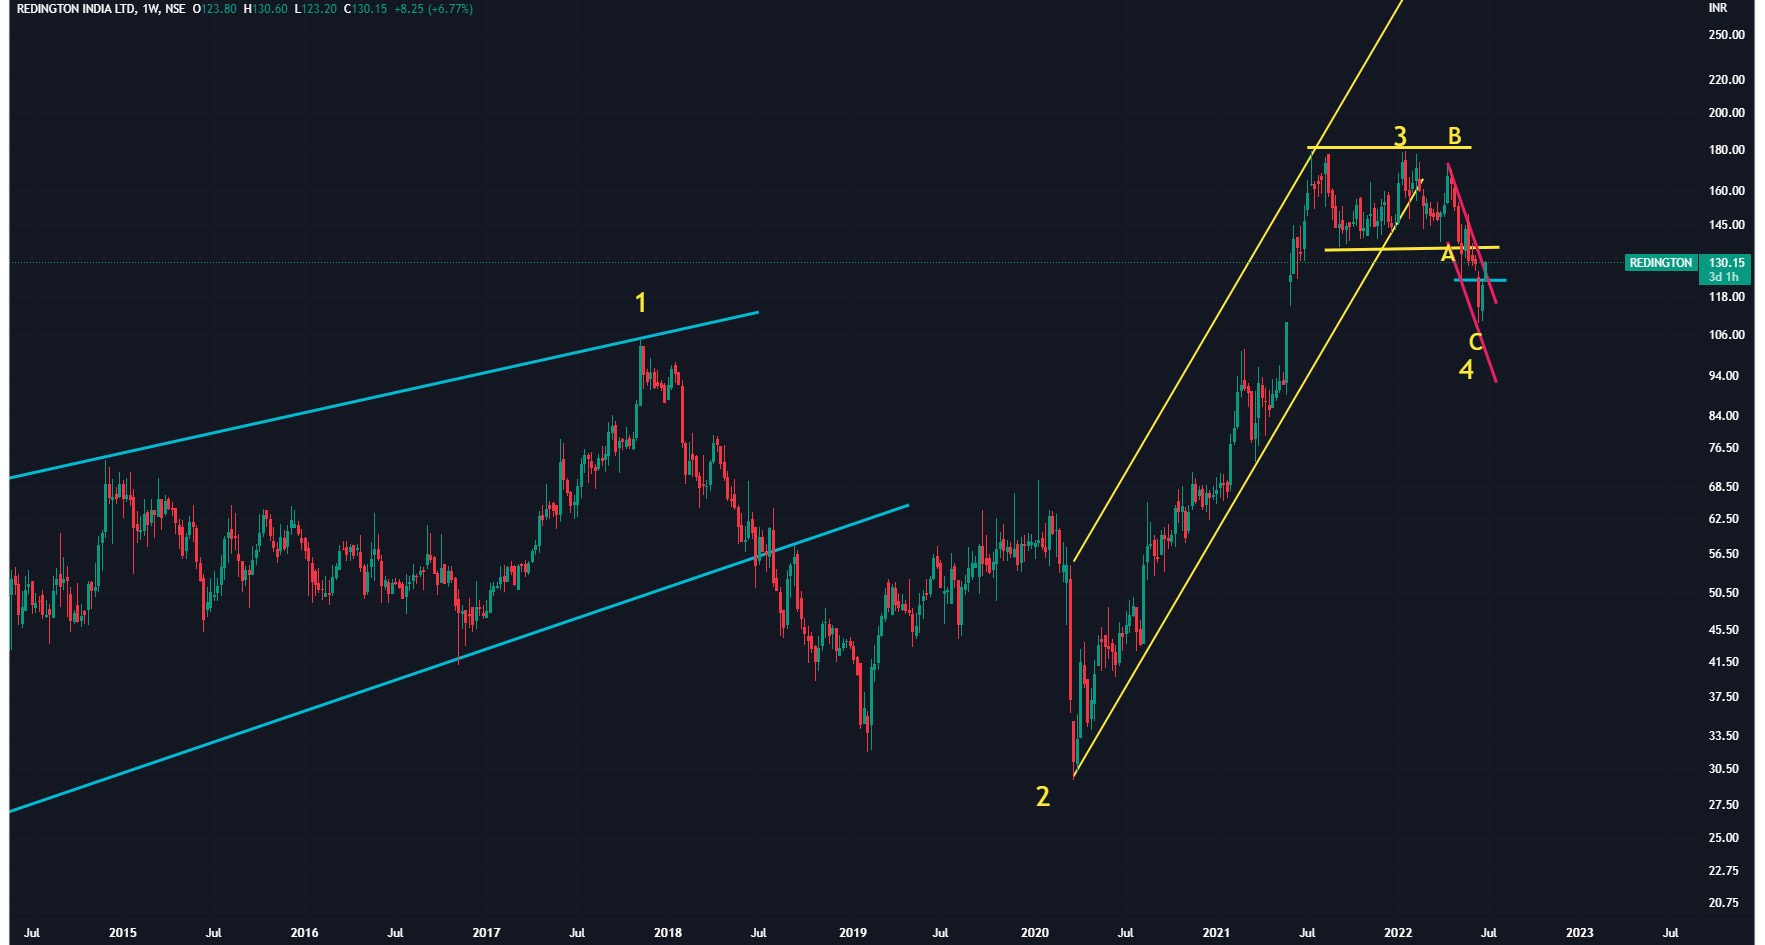
So as per the monthly chart , RIIL has completed its bigger wave 1 (contains 5 waves) and now is wave 2 correction (ABC) - a bear phase.

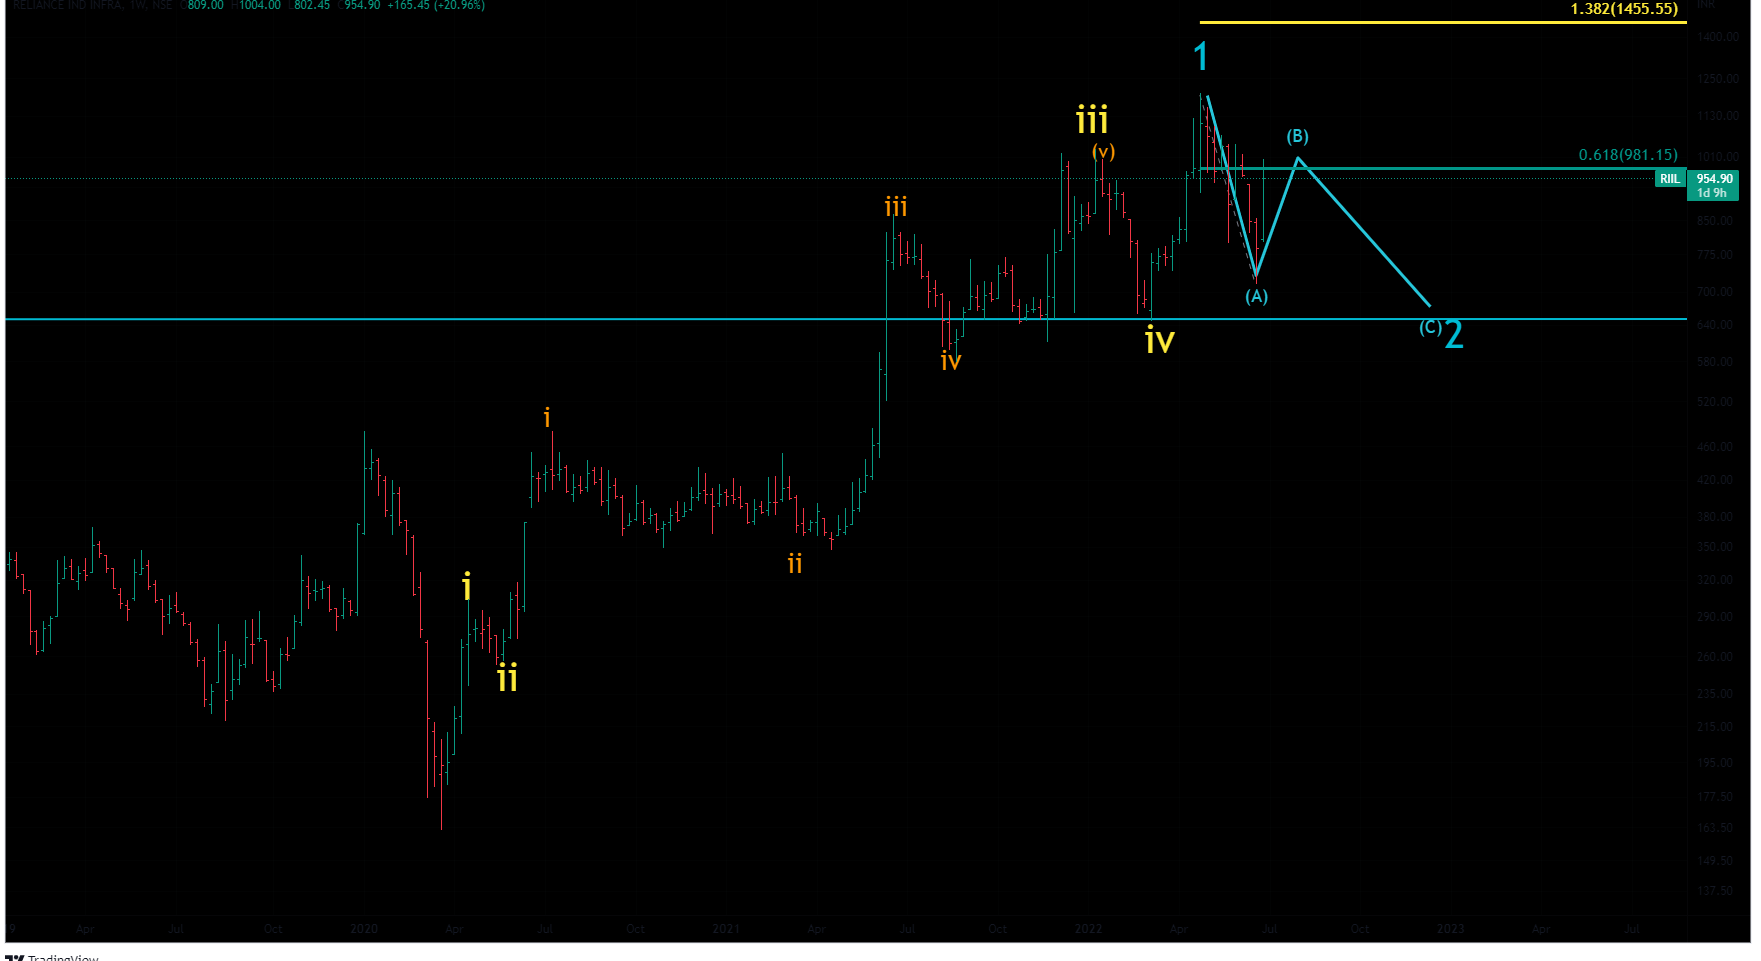
Now let’s got to the weekly chart to understand it better.

As per this ,yesterday’s bounce was a B wave bounce.

This assuption would become invalid if the stock closes and trades above 61.8% retracement of A wave ie above 980-1000 on weekly basis.
Yesterday ,it bounced but did not close above . Here we need to check weekly close above this level for at least 3-4 weeks.

But can we consider that stock is out of woods once it starts trading/closing above 61.8% of retracement.

Nope, we don’t consider correction to be over till it trades and closes above 123% or 138% of retracement levels - 138% levels have been given in the chart and the stock also needs to show the signs of a new impulse move.

In short - we would be very cautious if the stock keeps closing below 980-100 levels .

That would mean that the stock may correct more. Here the correction levels can be upto blue line (wave IV lows, that has been a good support for many months) But no -one can predict the top and bottoms, so take this opinion with a pinch of salt.

Disclaimer : These charts are for study purpose only. These are studies of probabilities, can go very wrong. No recos, no suggestions.

1 Like

Here are few more macros technical indicators that are suggesting that we might not be out of woods for next few months.

DXY Monthly Chart
DXY is trading above a certain level (blue line) - if it stays and closes above this in July also ,not good sign for all other currencies of the globe. If DXY goes further up ,other currencies may depreciate more.Not good for the equity markets.

Nifty -Half Yearly Chart

Every candle is a 6 months candle. Currenly it is forming a Twizzer Top (last 2 half yearly candles) -It is a sign of forthcoming bearish times.

If we combine the insights from the past, current technical structure of DXY , Nifty 6 montly chart … things don’t look good…July can be a decider month for DXY.

Disclaimer: Take these charts with a pinch of salt. Many a times these pattterns fail. So no reco,no suggestion.

3 Likes

Thanks for the analysis. Are you adding it purely from a trading point of view or do you think the stock is fundamentally strong and also at a good level technically.

All stocks mentioned by us in long term holdings/favorites are fundamantally strong stocks as per our own assessment. But we’re not perfect , assumptions can go wrong and we can be completely wrong.

Please do your own research as well as please do refer to the threads specific to those stocks where many great personalities have been updating several aspects wrt fundamentals.

More money is made by developing own conviction rather than having a borrowed conviction. Others views can be taken as 2nd opinion.

4 Likes

Credit Risk Spreads

Higher credit risk spreads tell us that big money is trying to stay away from risky assets ( equities, botcoin etc) and trying to move towards less risky assets ie bonds .That is why bond prices are rising and yields are falling.This is known as risk-off period in economics.

Credit risk spreads are going up gradually unlike Covid days but are above 50 and 200 DMA and rising. That means ,risk is still not off the table.

There might be small time bounce as huge number of shorts are build up in US and the short-covering can lead some short-term bounce.

Yesterday’s night COT data of S & P 500.

In summary : be light, don’t get too tempted by short term bounces… the bottom is still far-far away.And pray that the following does not play out.

3 Likes