
Please have look on power India chart and give your idea
2 Likes
also can u have look at Gland Pharma?
Power India
It is a beautiful company - one of my very long term holding.
Had a smooth run in a channel in recent bull market.Never came down belw 30 WMA (a sign of great momentum and stregth for any stock in a bull run).
Not it is correcting in B wave (ABC correction)
Overall Power sector has started to correct so all stocks will get affected.
Expected to go in the range of 2400-2500 ( where A will be equal to C) . Many a times C waves turncate and don;t achieve the targets. This level also happens to be wave iv levles of the previous impulse wave where wave 2 corrections generally end.
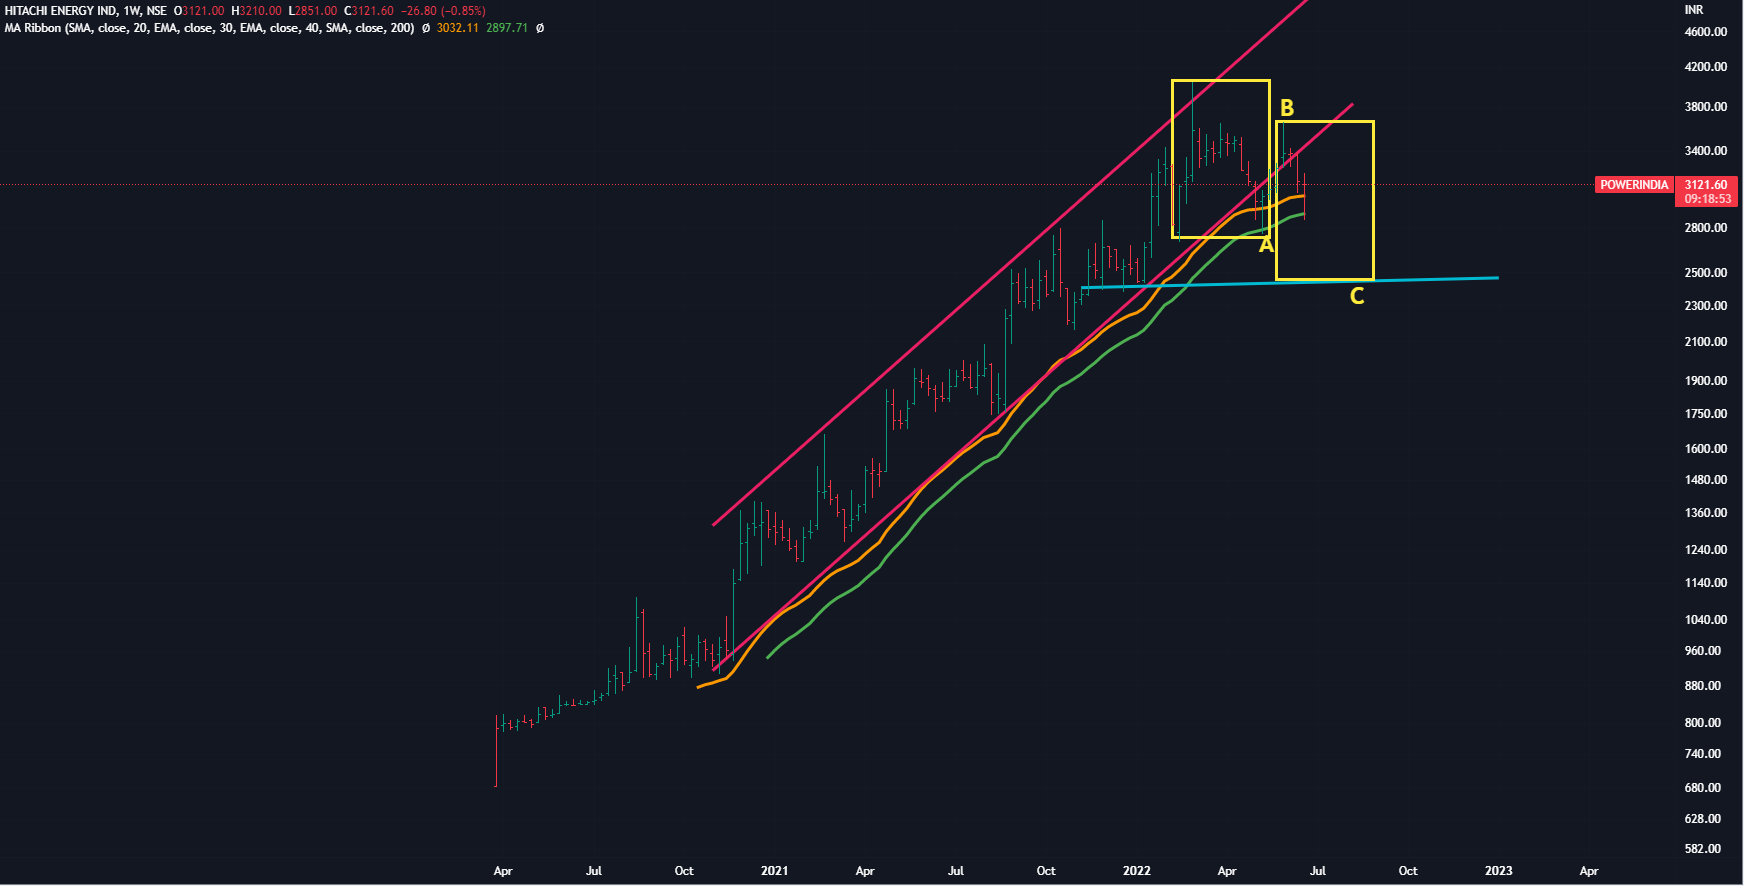
But the fall (if it happens) might not be in straight line as C waves also have their own structure. And currently we’re experiencing a bear-market rally , a counter-trend bounce, it might go up and then start its downward journey to complete its wave 2 targets. ( or in best case scenario it might stop at 40 WMA , where it is standing now - highly optimistic and baised view ![]() )
)
Disclaimer: (a) I am holding it in my long term portfolio so view might be biased, we see what we want to see ![]() ), Power sector gave a break-out after 10 years. These are long term cycles, so it might be just wave 1 and wave 2 in power sector stocks. Wave 3 (whenever it starts , can take these very high) .That 's why I am trying to hold it for long term.
), Power sector gave a break-out after 10 years. These are long term cycles, so it might be just wave 1 and wave 2 in power sector stocks. Wave 3 (whenever it starts , can take these very high) .That 's why I am trying to hold it for long term.
(b) Charts are for study purposes . These charts are based on the study of similar patterns in other stocks , but they might or might not REPEAT in this specific case.So no reco, no suggestions.
3 Likes
Gland Pharma
This also used to be my portfoilio as I like the business but got out near 3500 in January when it broke 30 WMA and trading range (S3) in January.
The ideal time of exit was when it gave climax move on monthly charts in August 2021 ( but till that time, I never looked for climax moves on monthly charts ,I was looking for these kind of moves on daiily charts)

Sorry to say that the chart history is limited ,hence not so confident about what I see (For EW to work ,one needs to understand masses behaviour over longer period of time - at least 2-3 years) So take every word with a pinch of salt.
Stock is in C wave, has broken the falling channel also . But seems that it is yet to complete its correction ( the blue line level near 2100 may prove a good support)
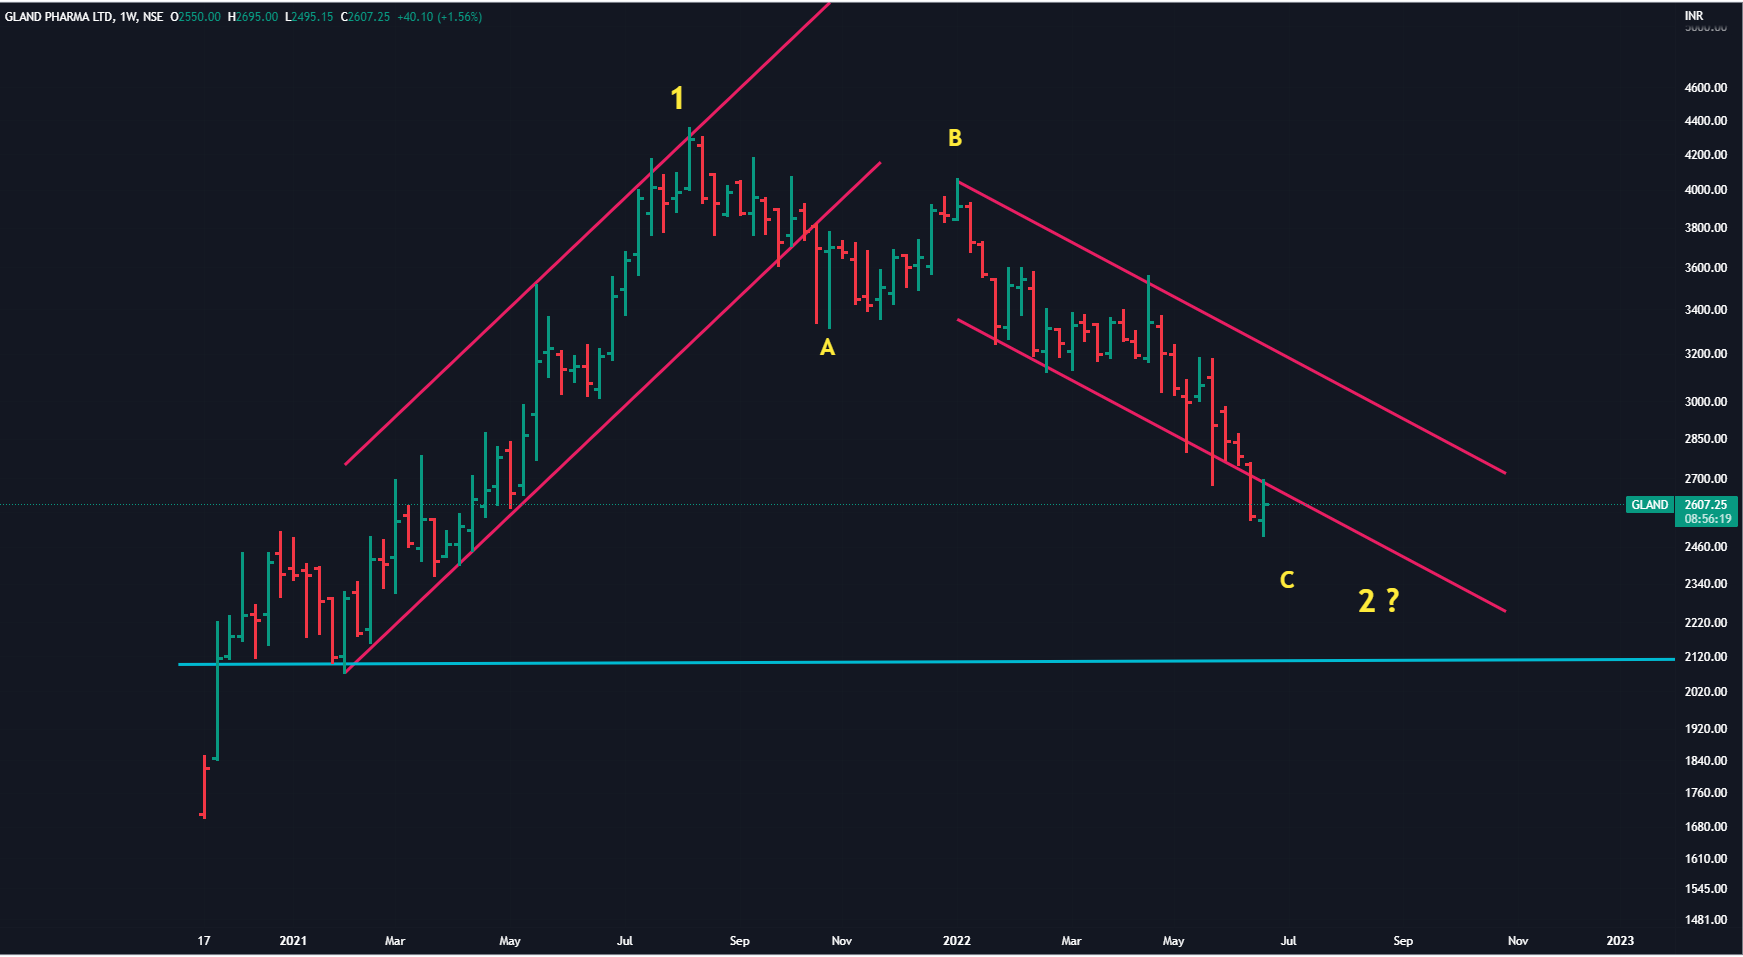
If I was holding it now and was planning to exit, I will use current bear rally ( counter-trend bounce ) for a highe price exit.
For entry - (a) If I was planning to enter, I might make a small entry if it holds near blue line & make a 5 wave impulse move, or I may plan an entry w when it breaks the falling channel, but major entry can be when it goes above 30 WMA. But my entry & position-size in this stock will be based on overall market -situation and sector- momentum.
Disclaimer : The charts are just based on similar patterns of the past on various other stocks. These patterns may or may not work on this specific chart.So no recos, no suggestions.All the text here is just a personal view.
5 Likes
Past 7 months: Commodities ripped, stocks & bonds fell.
Could see a retracement to these moves as explained in big picture above.
DBC- Commodities
SPY- Equities
TLT - Bonds
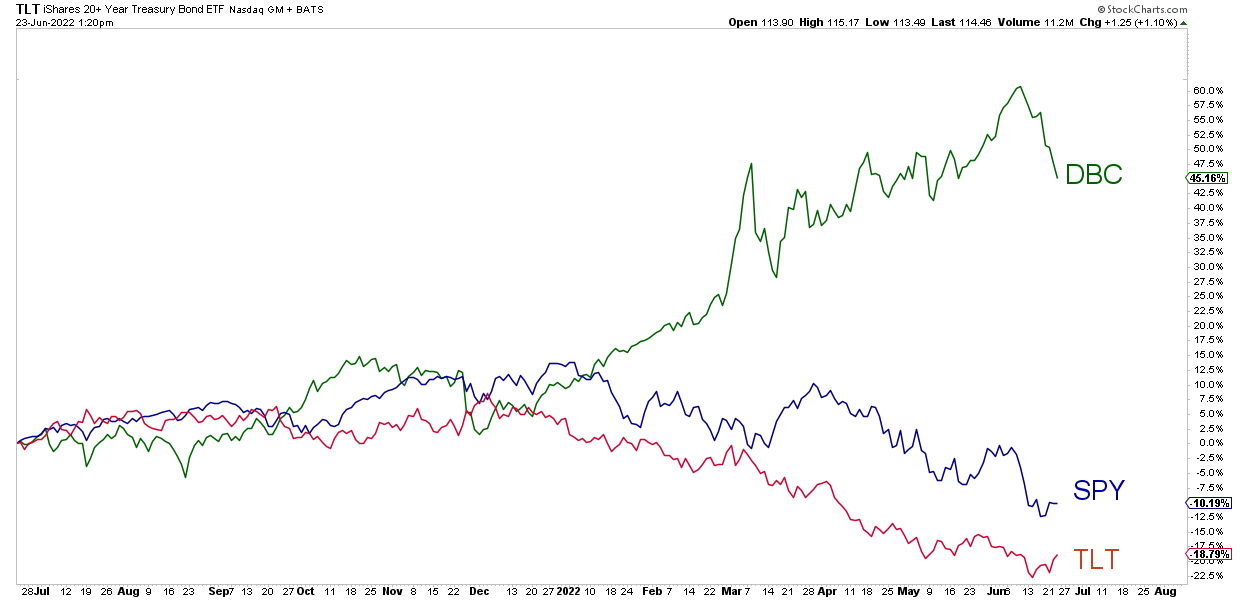
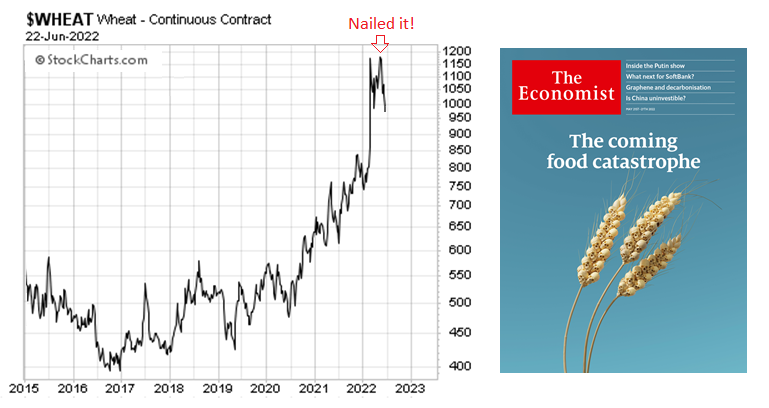
But as usual , the media is always one step behind ![]() now commodity prices are falling & The Economist is predicting on the other side - they always catch the trend at the top.
now commodity prices are falling & The Economist is predicting on the other side - they always catch the trend at the top.
2 Likes
Same here . Holding Power India / Hitachi Energy for long term. I guess we should bump the dedicated thread up for further tracking / discussion ![]()
Since you are sincerely responding to technical queries and Elliott Waves being my favorite weapon too in Technical world, may I also put my queries, understanding of charts of other stocks and get your precious comments/inputs/feedback please?
Thanks,
Vimal
Tradable Rallis
For full -time market players, it is not always finding long-term picks or just buying and buying.
There are many ways to make money in the markets.
And it is not that one can;t make money in a bear market- one can make money by shorting in wave A , going long in Wave B and then again going short in Wave C. These might be called as tradable rallis.
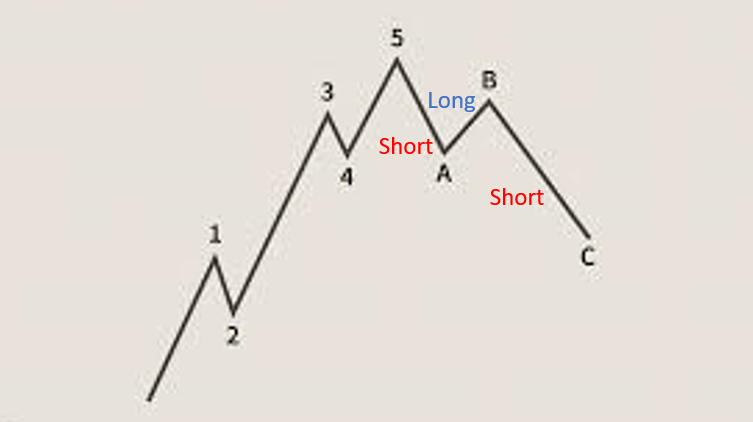
Here you’re not buying or selling for long term ,but you’re getting-in and out as per the short-term trend. ( this is generally done in bear markets till there is no clear uptrend is visible.)
One way is to earn in bear -markets is trade in whenever market gives a good trade-able rally ie. a good counter-trend bounce expected.
As mentioned on last Saturday, that we could expect a good bounce in Indian market.
Chances of this short-term bounce also were confirmed by SPX & Nasdaq - you can see an MORNING star on SPX and 3 inside bars on Nasdaq.
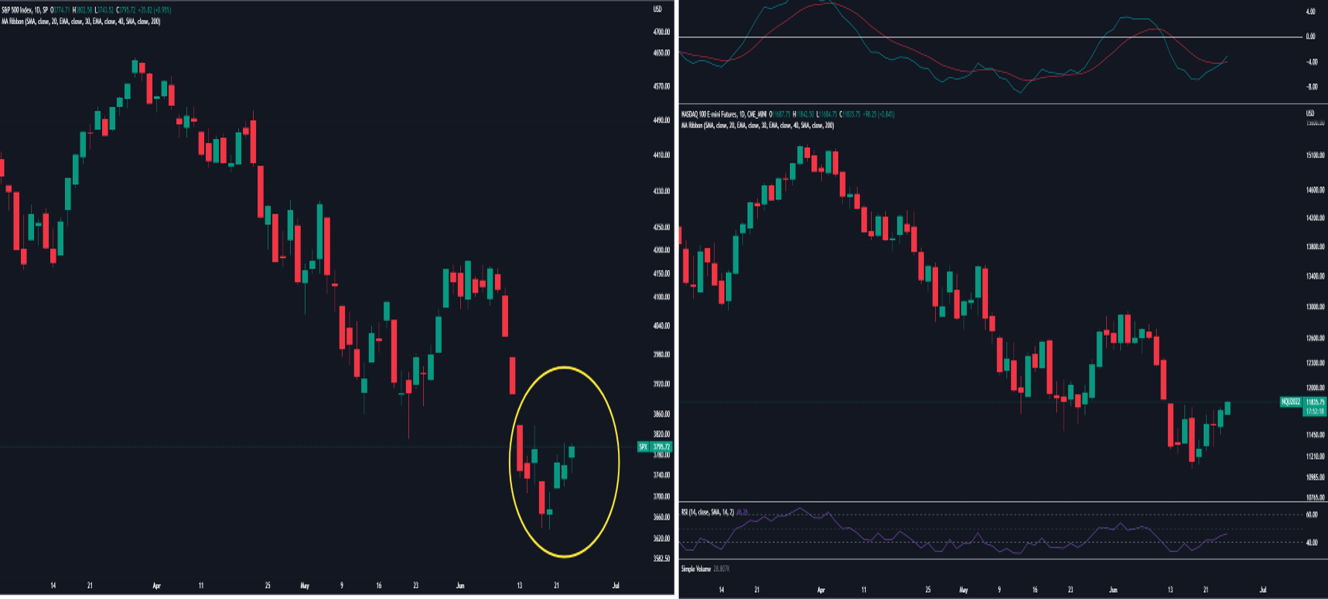
Based on the above , went long on Indian indexes, enetered Fiem in cash , and entered in NOW and Amazon in US market ( these are for short-term trading,but if the trend changes to upside for longer term, would stay in these longer)
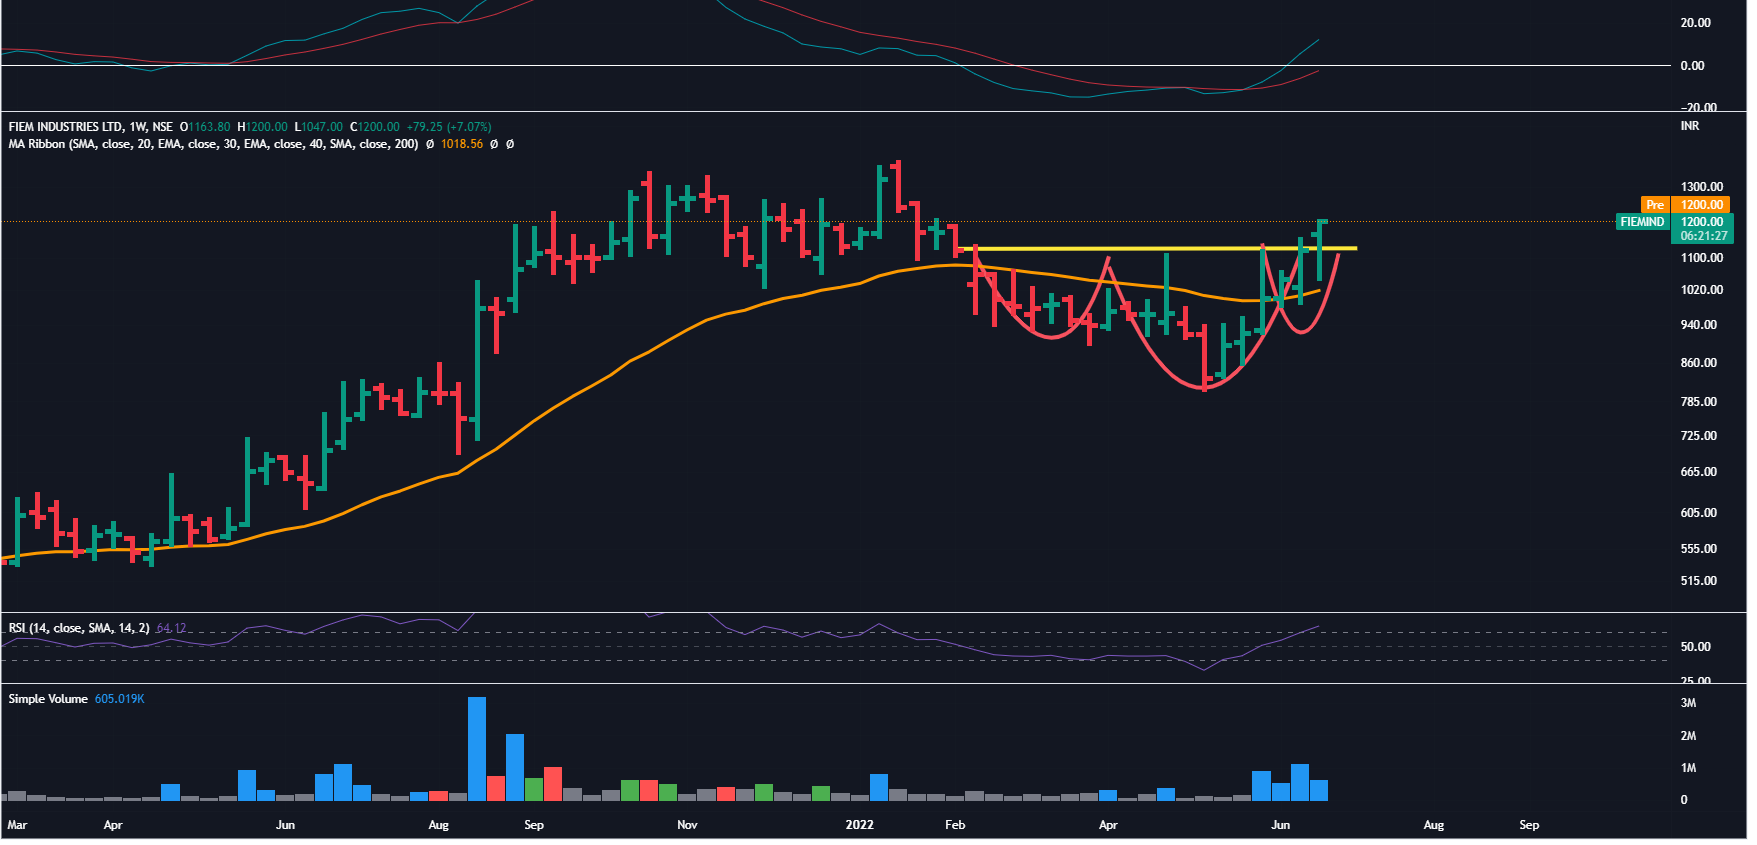
Fiem
Trading above 30 WMA, seems to a breakout of trading range, also seems to be a break-out of inverse H & S (targets seem big) + auto-sector looks good in short-term
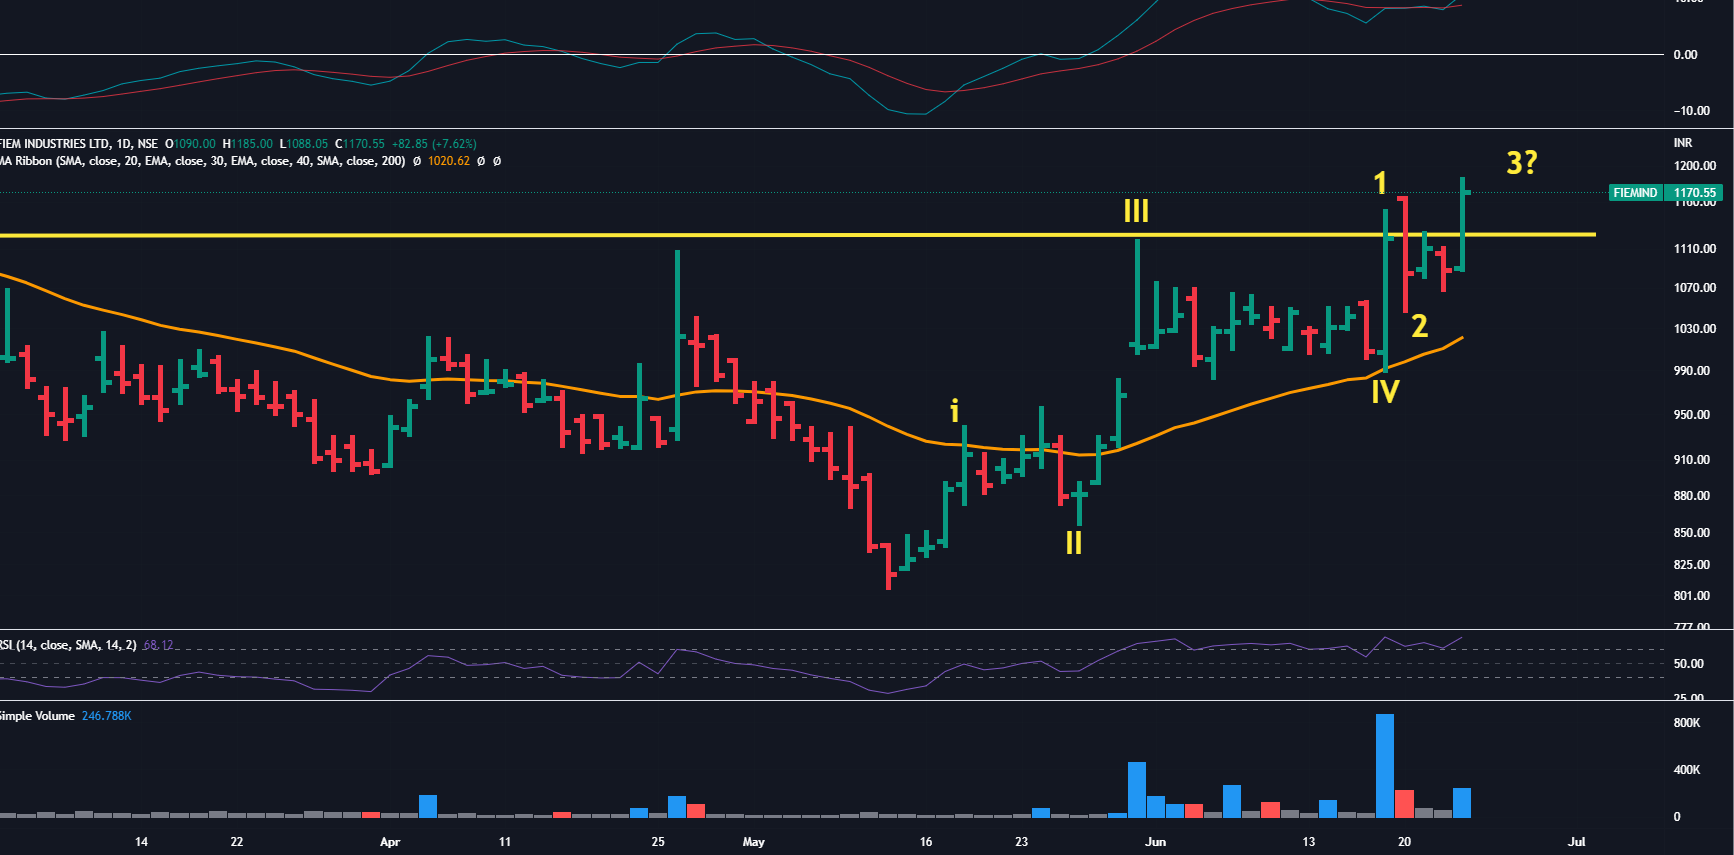
On daily charts ![]()
Seems to have completed wave 1 & 2 , now it might be starting wave 3.Would review as we progress.
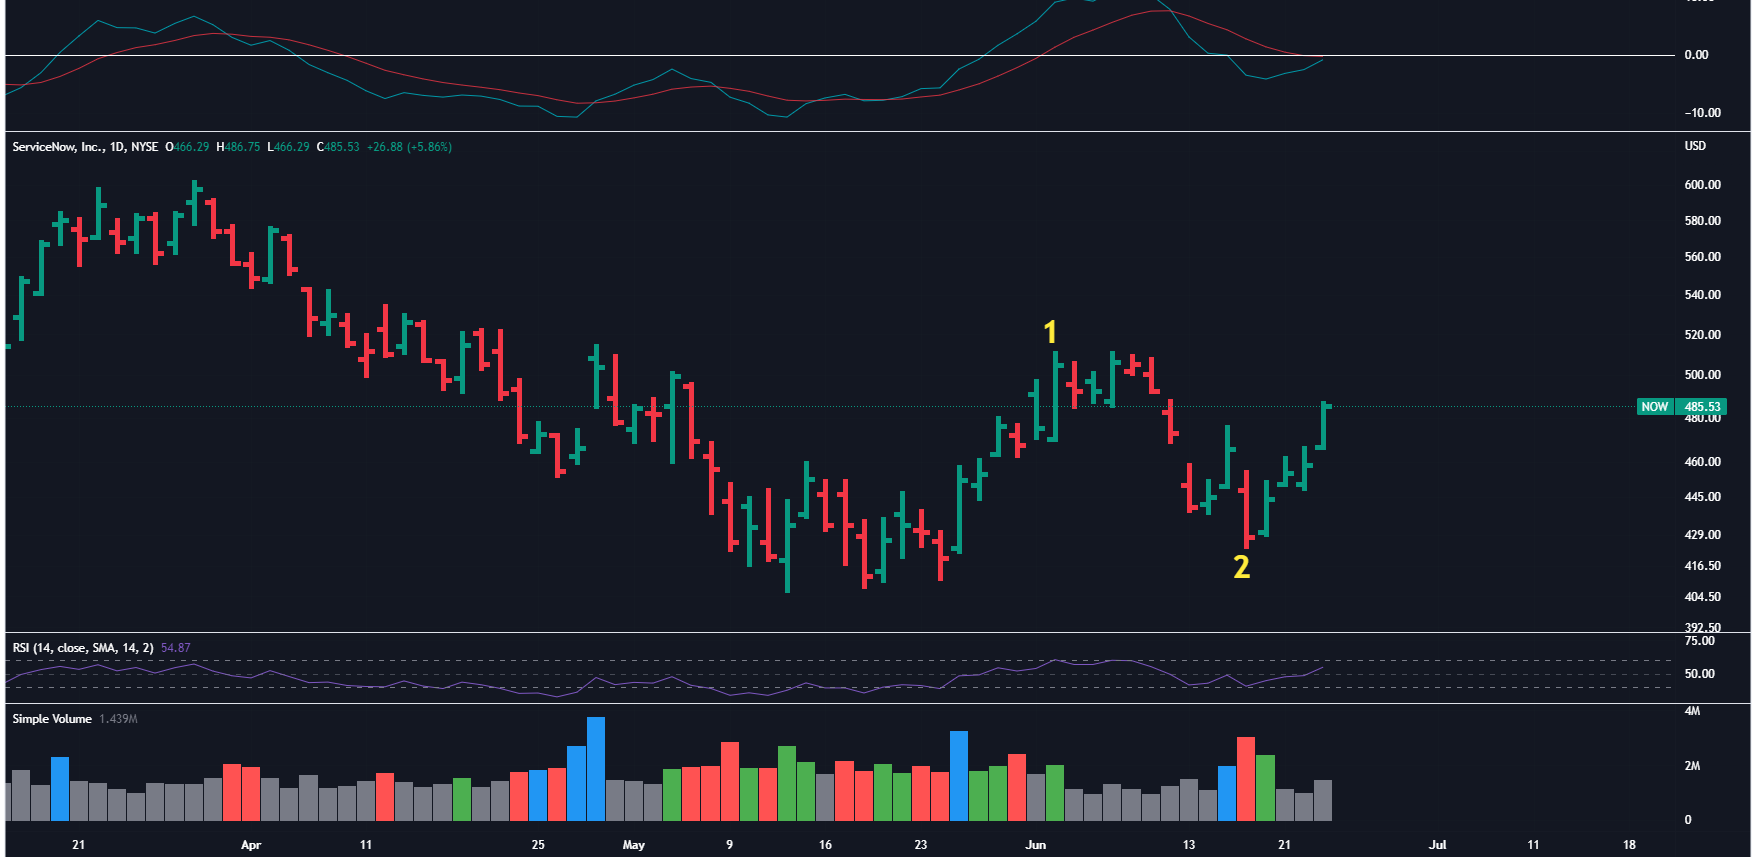
NOW
Expected bounce in Nasdaq and a 5 wave impulse on daily charts ( althouth these can also be part of corrective bounces ) - MACD turning to buy side- took a risk for short term trading.
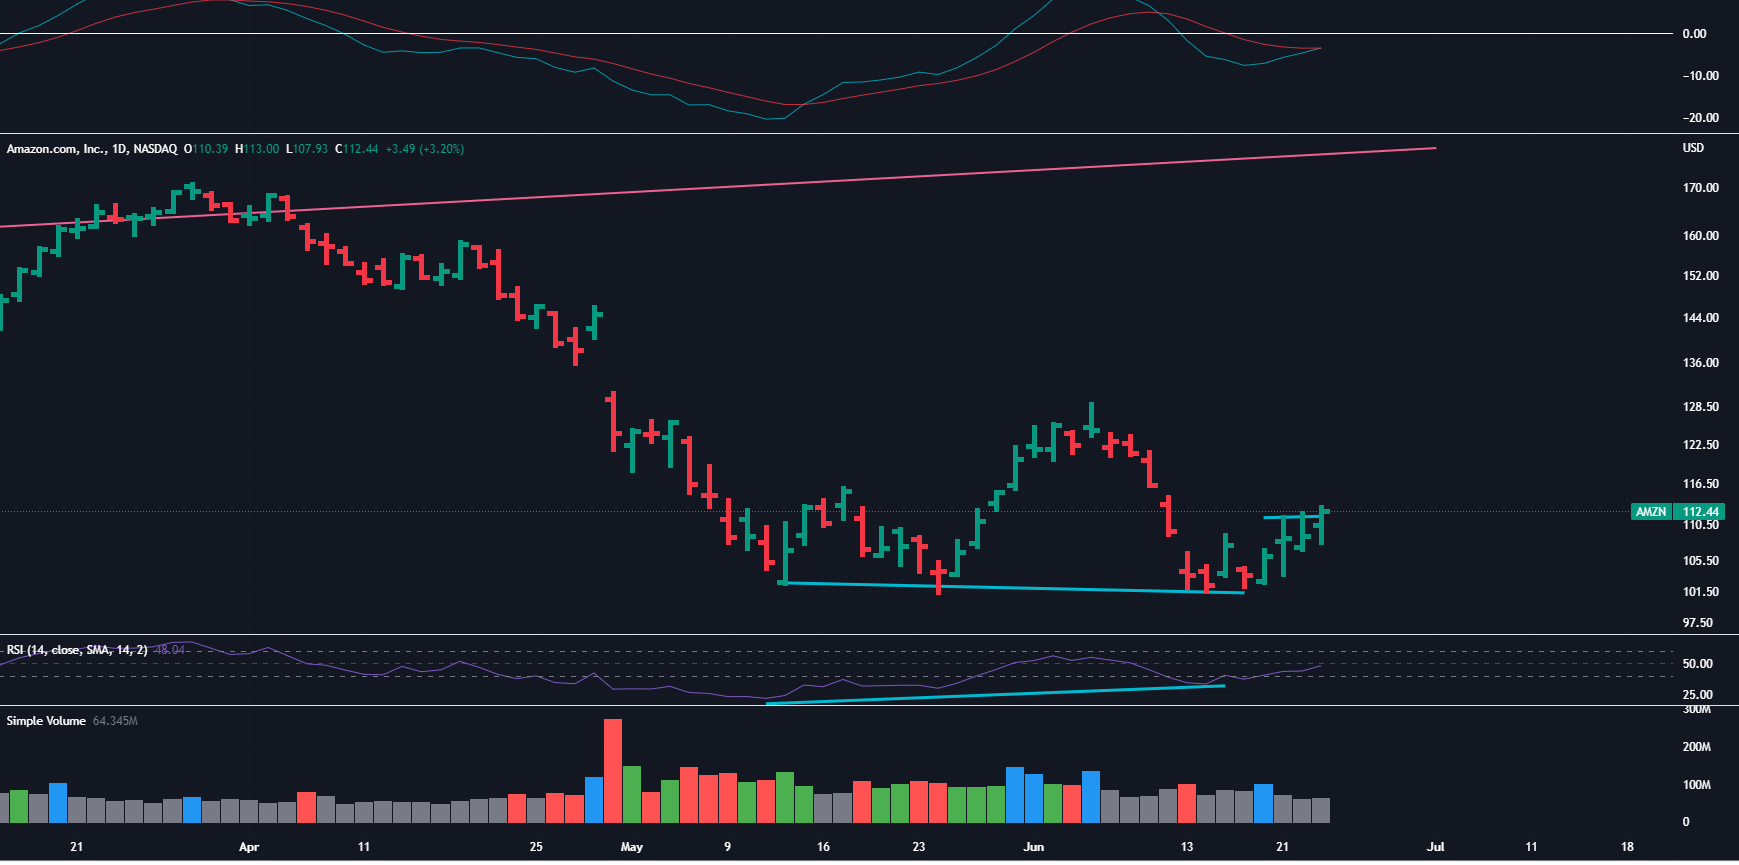
Amazon
Again positive signs on Nasdaq index for short term bounce + double bottom on daily chart, divergence on RSI , MACD turning to buy-side ,took a small bet for short term trading.
Disclaimer :These are personal opinions. Sharing the charts to share learning on how one can navigate different markets. No recos, no suggeston. Please be aware that one needs to practice, have experience and should have proper risk-management method to naviagte these kind of markets.
3 Likes
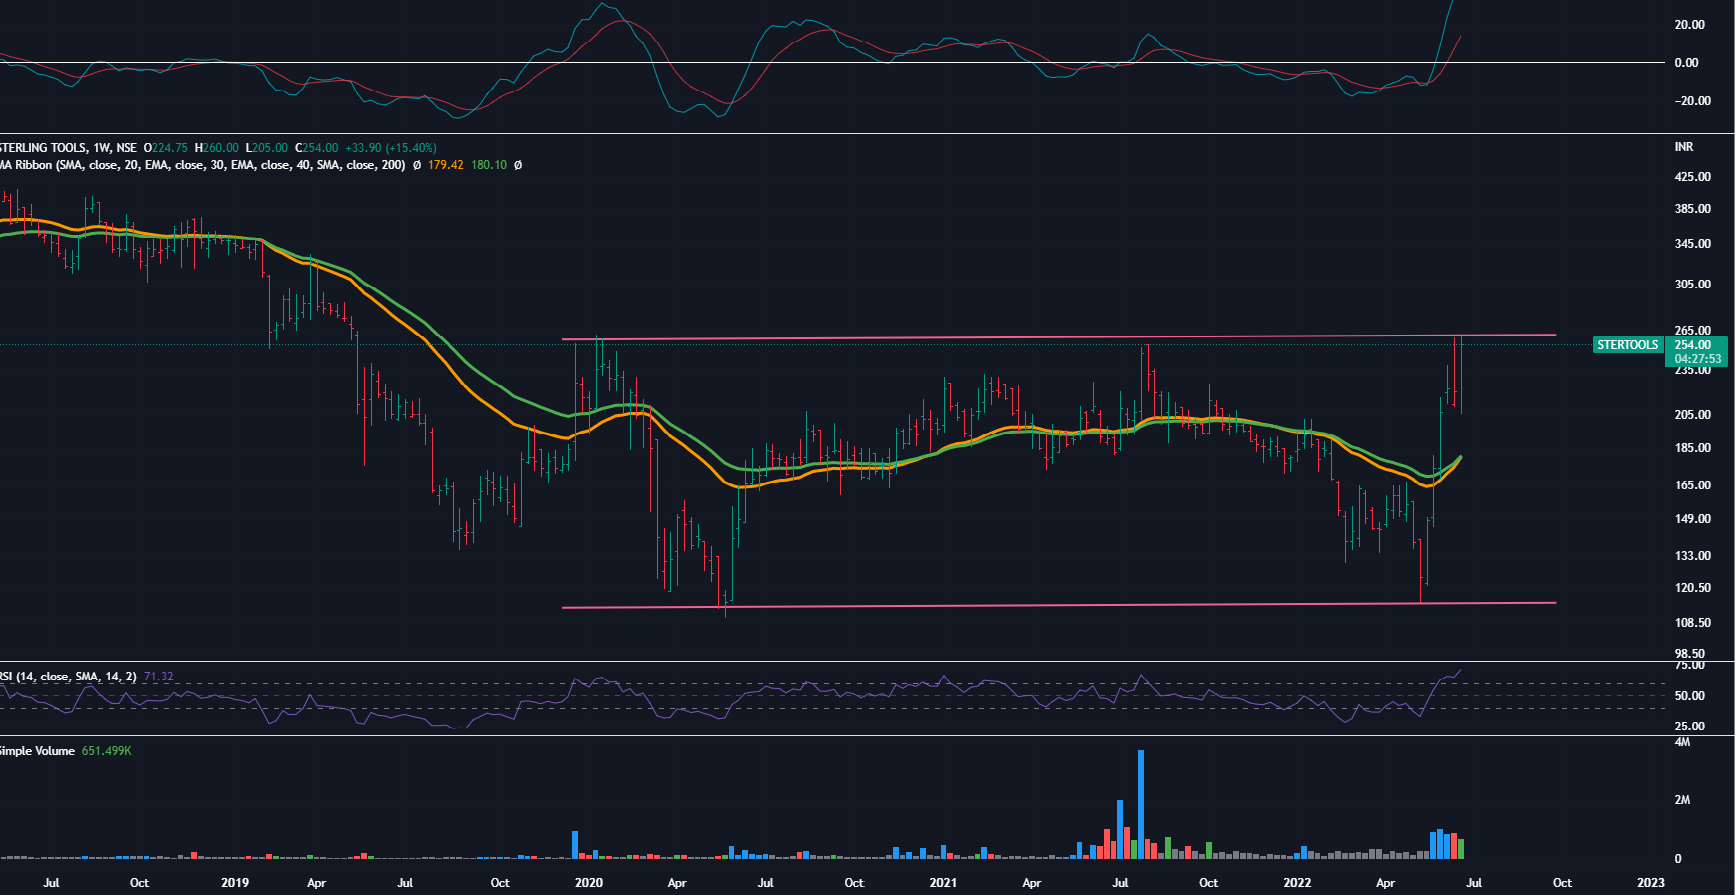
Sterling Tools
Took an early small entry in this 2nd auto stock .
Reasons:
Weekly Chart :
a) Trying to break a trading range after two and half years
b) Trading above 30 WMA
c) 3rd try with good volumes ( the resistance should become weaker)
On Daily Charts
a) Seems to have completed 1st impulse and correction- seems to be starting 3rd wave
b) Trading above 20 SMA from May ( in this run) - a good sign of momentum
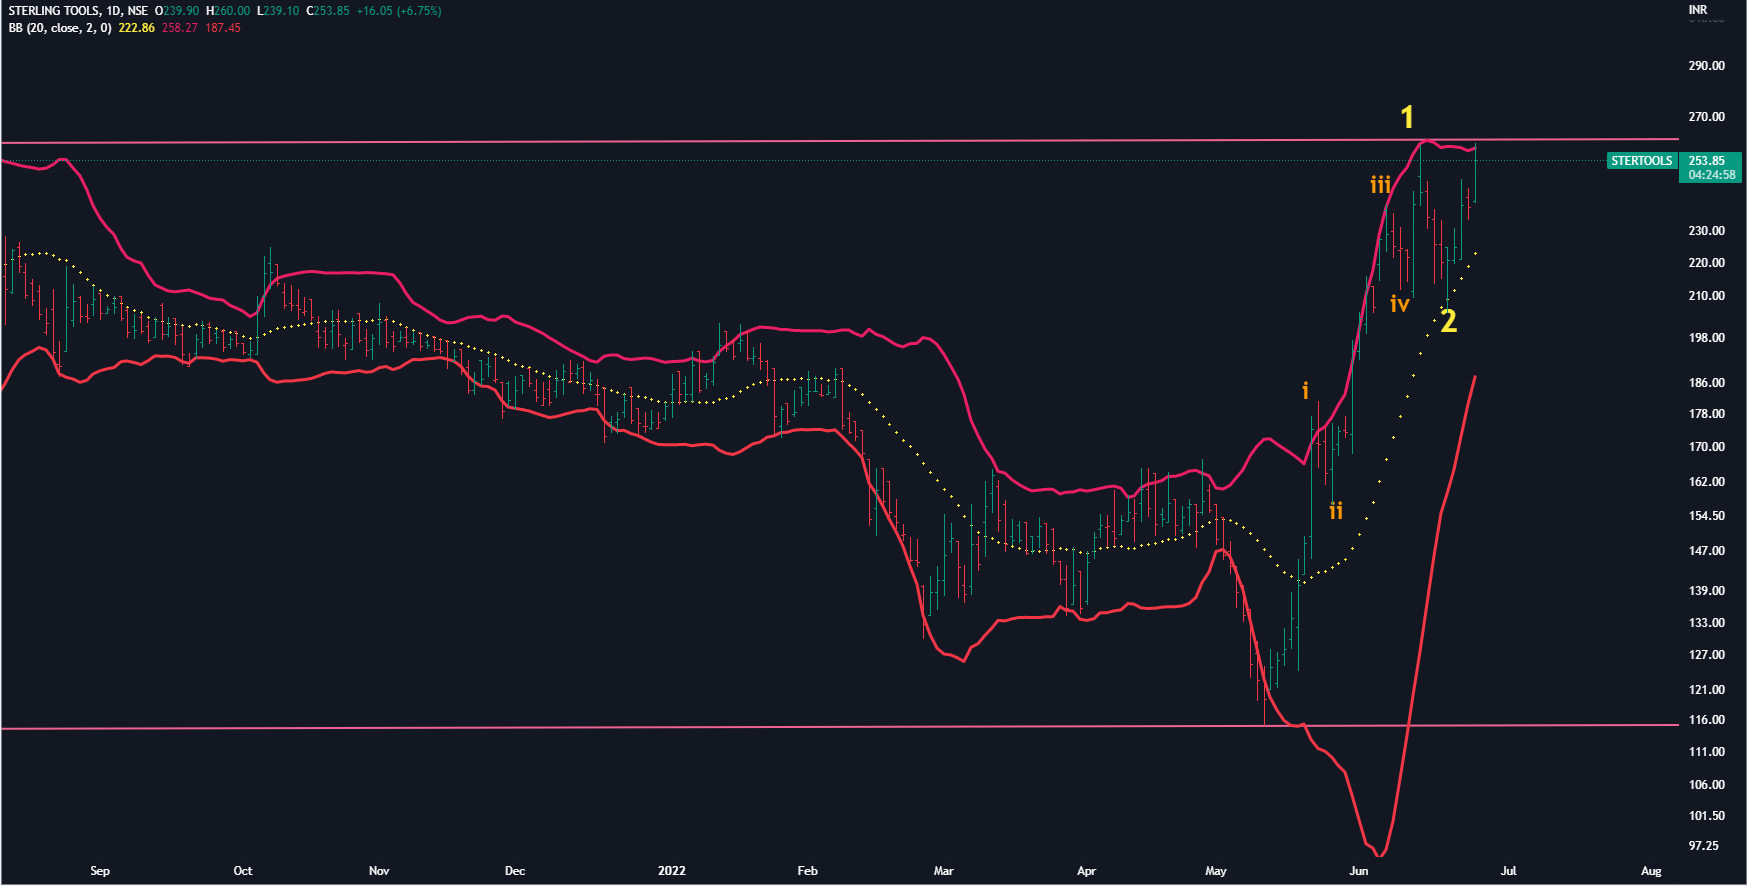
Why not a bigger position as of now :
i) Yet to break the trading range…last 3 attempts failed despite good volumes
ii) Daily MACD is in sell mode
iii) Should close and trade well above Wave 1 high for few weeks
iv) Trading close to its 2017 resistance ( thouh older the resistance, weaker it becomes)
v) BB is still wide and trading near the top of the band.
Let’s see how it goes, would increase the position if it breaks the range ,closes and trades above it for few days …otherwise would exit after waiting for few days.
Disclaimer : The post is about our entry strategy and how we build new positions. This is our personal menthod, may not work for everyone. And chart is for study purpose, no recos , no suggestions.
3 Likes
A candle-stick look-alike pattern called Bullish Harami is visible on weekly charts of Nifty.
Bullish Harami is a trend reversal pattern.
So rally might continue next week too.
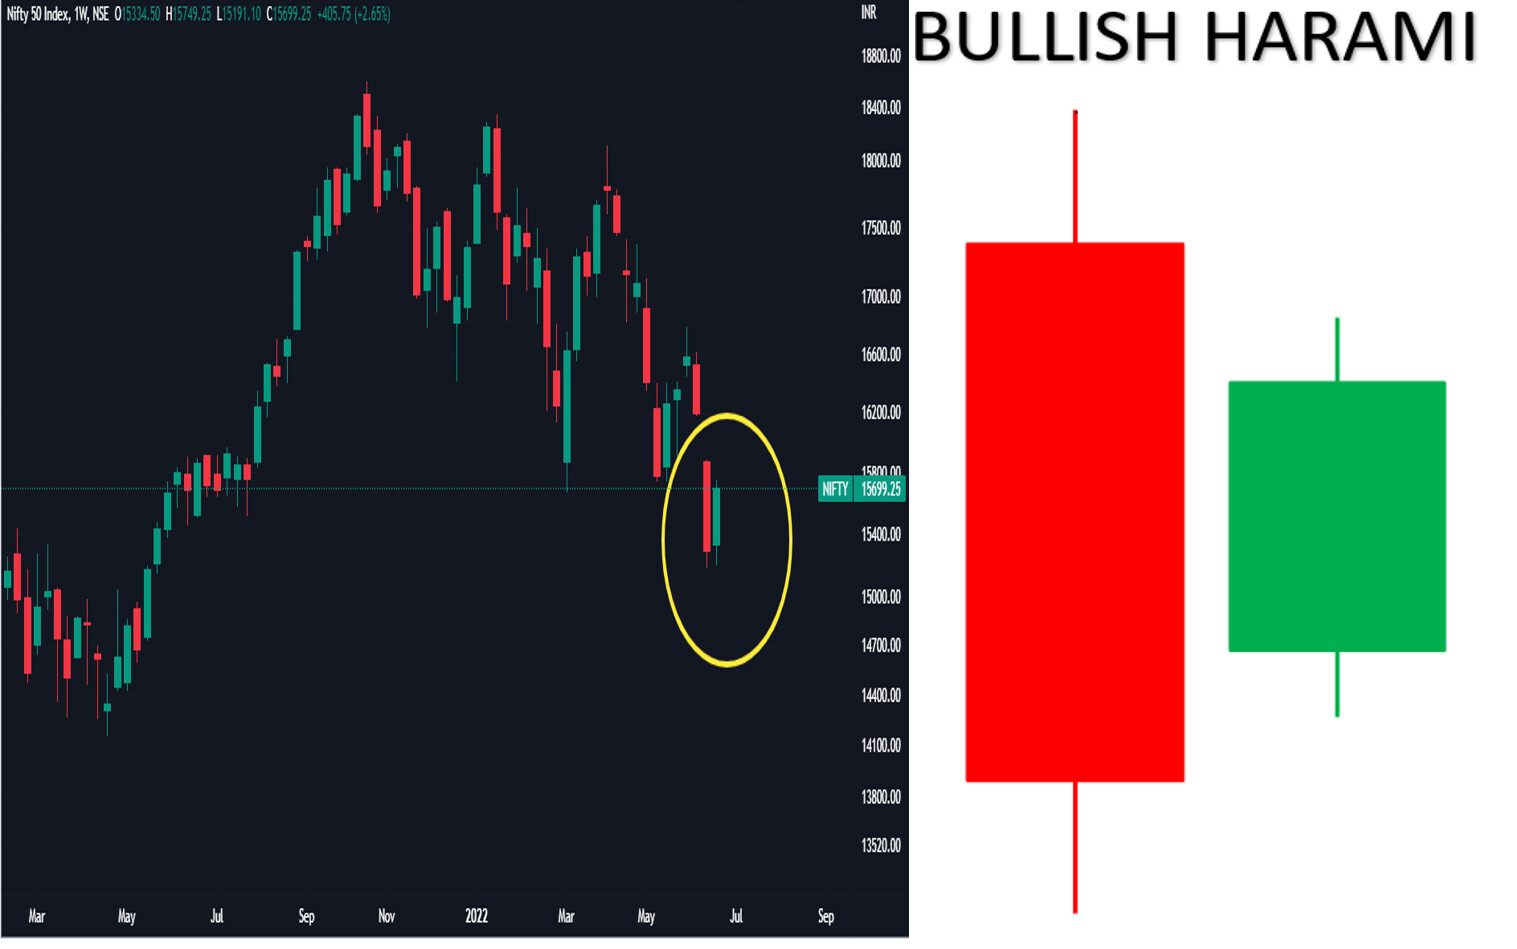
Disclaimer- this is just a probability set-up and probabilities are just probabilities - may not work many a times.
4 Likes
US Markets & Nifty
Last week ,the patterns on daily charts worked as per the set-ups.
Now on week-end, all 3 key indices of US ( Nasdaq,DOW ,S & P 500 ) are showing two key things :
a) A sort of bullish engulfing patterns
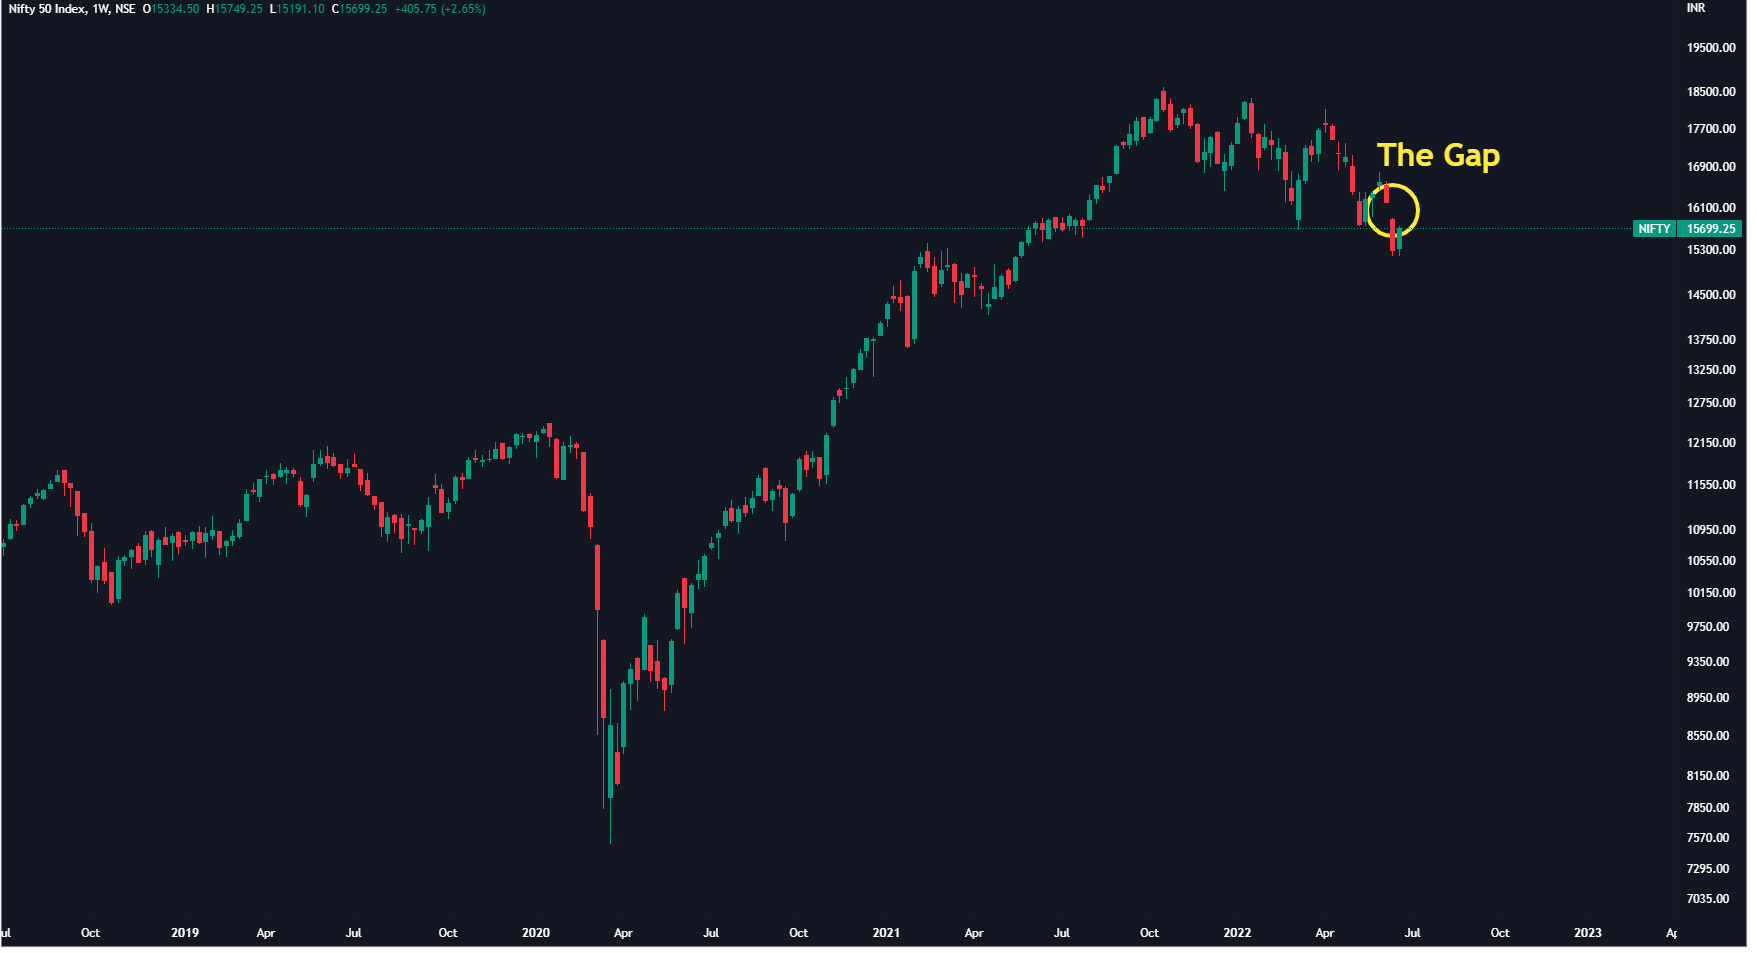
b) Filled the recent gap

These have 2 implications for Nifty (India):
- US Market may continue its uptrend next week also (Nifty also have a bullish harami pattern on its weekly chart).So overall positive sentiments across the globe.
- Nifty may also fill its recent gap . Once this gap is filled (crossing over 16100) , we might attempt a biiger rally ( may be upto 16400, 16900)
Apart from above , DXY and Oil are cooling, giving some relief to negative sentiments vs inflation on temporary basis.
We still consider it to be a bear market rally . Bear market rallis can be big , fast and furious.Here is some historical data from Nasdaq of the largest one day rallis .
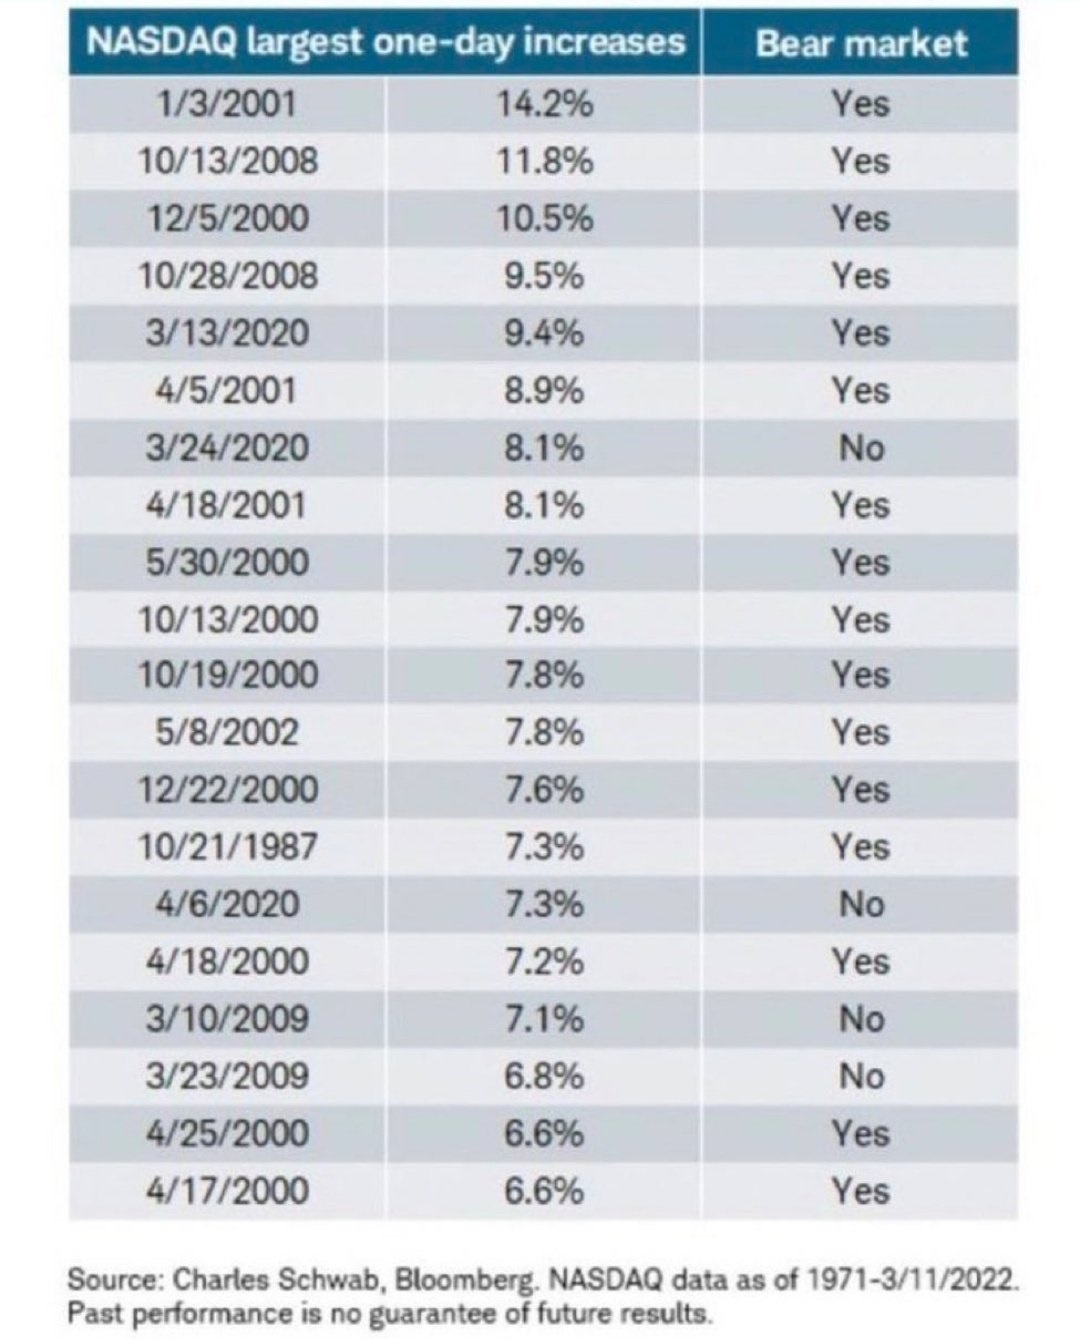
Disclaimer :These are probability set-ups. May or may not work.
5 Likes
3 Likes
Seems like US, India ,China are having a couter trend rally after a long drawdown.
Sharing few charts from US & China where we can have 10-15% upside in certain stocks in coming weeks . ( just for short-term trading , but who knows rally may go little longer !)
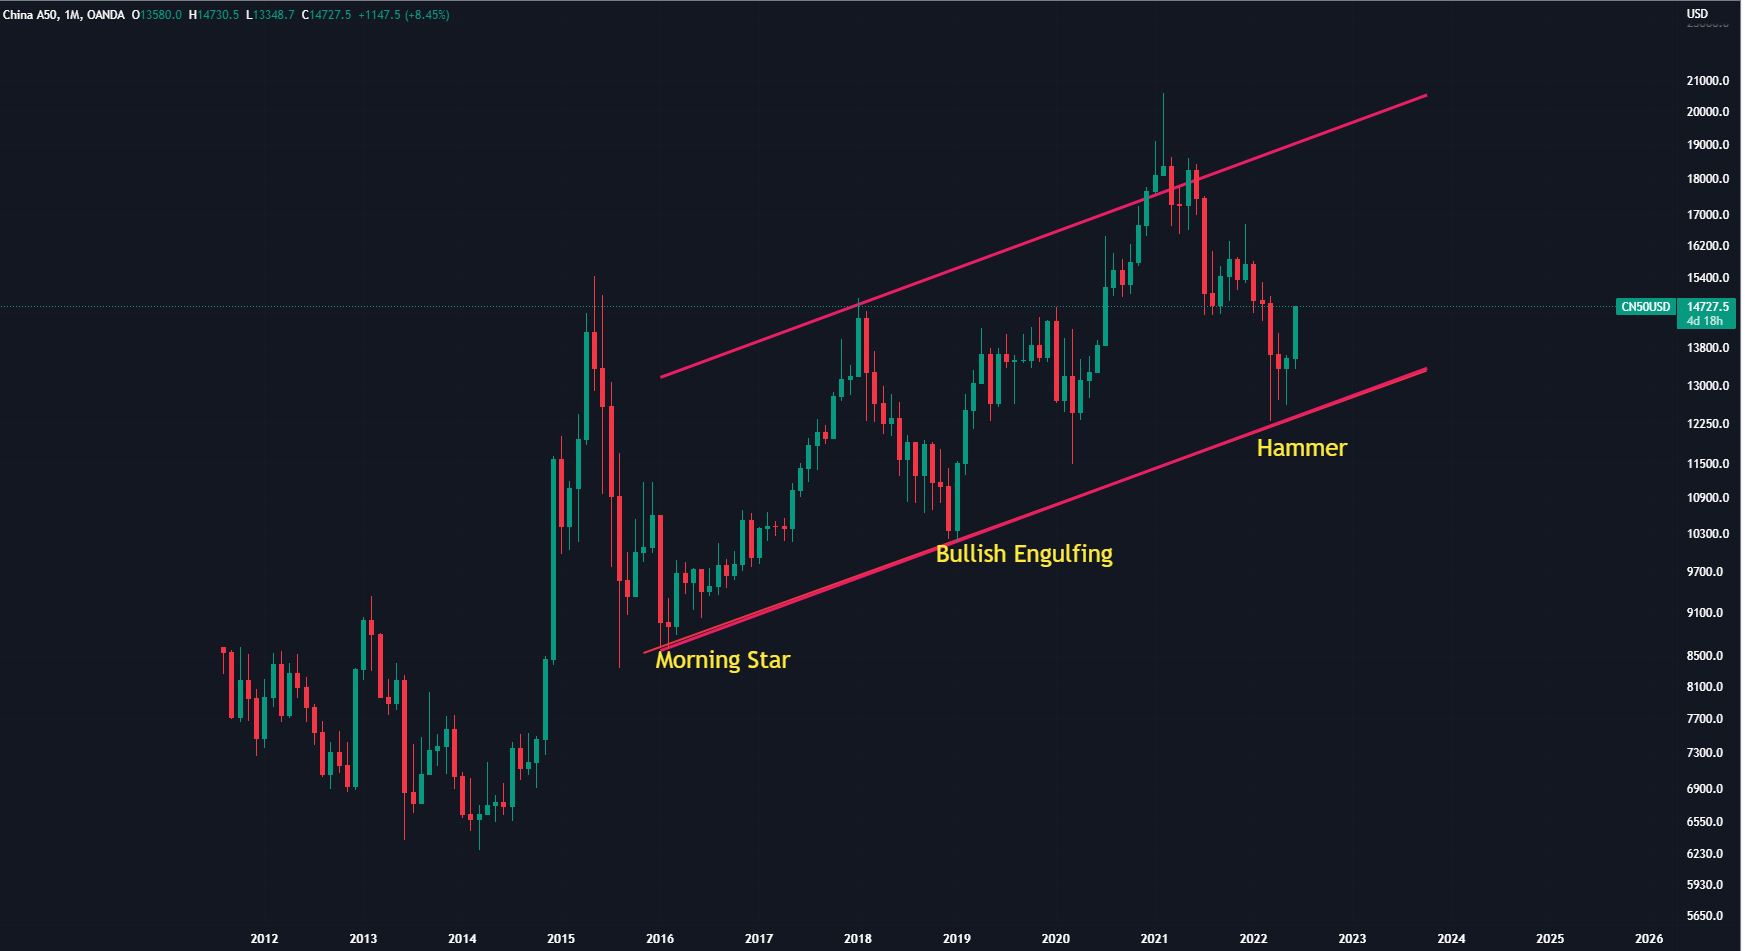
First China Monthly Chart
Seems to have taken support on bottom-leg of rising channel.
One way to get first confirmation of support is bullish candle -stick pattern at the suppirt level ( as in all of these charts , 30 WMA is far-far away. This happens after a big fall. So this is one of the method to take early entry .Other method is count Elliot Waves to see the stage of the fall, one more method is DOW method,whether prices have started making higher highs and higher lows,)
One of the Chinese stock that can give some more bounce is AliBaba
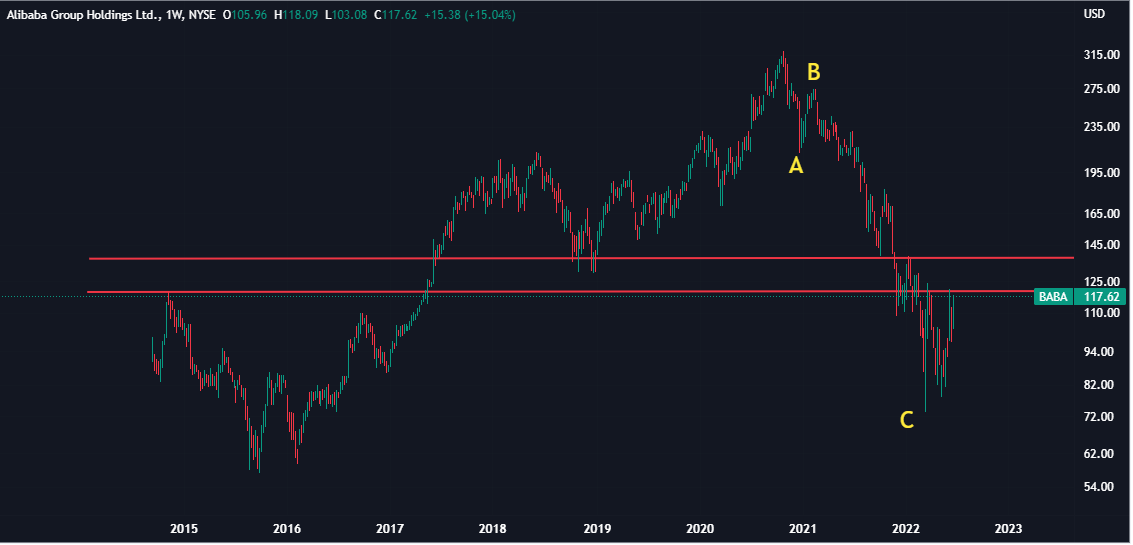
BABA Weekly Chart
Seems to have completed its ABC correction and is now making a counter-trend bounce. Currently at a key -restance level ( 1st red line,119 ), but next resistance line is also very close.
A good candle last week and if it crosses its first resistance next week, chances for it to rally till next resistance are high (140) - ie. 15% tradable rally.
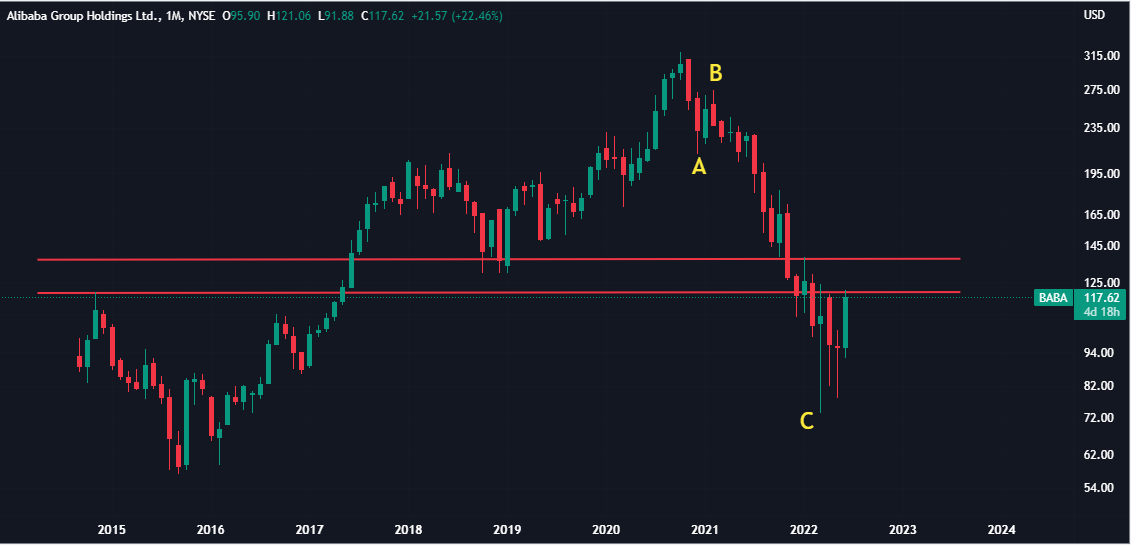
Baba Monthly Chart
Seems to be forming a morning star pattern - but month is yet to close. So need to keep a watch. This pattern happens to be a bullish pattern.
Now some US market charts
Last week shared Amazon and Now , both are doing well .
Here are few more charts
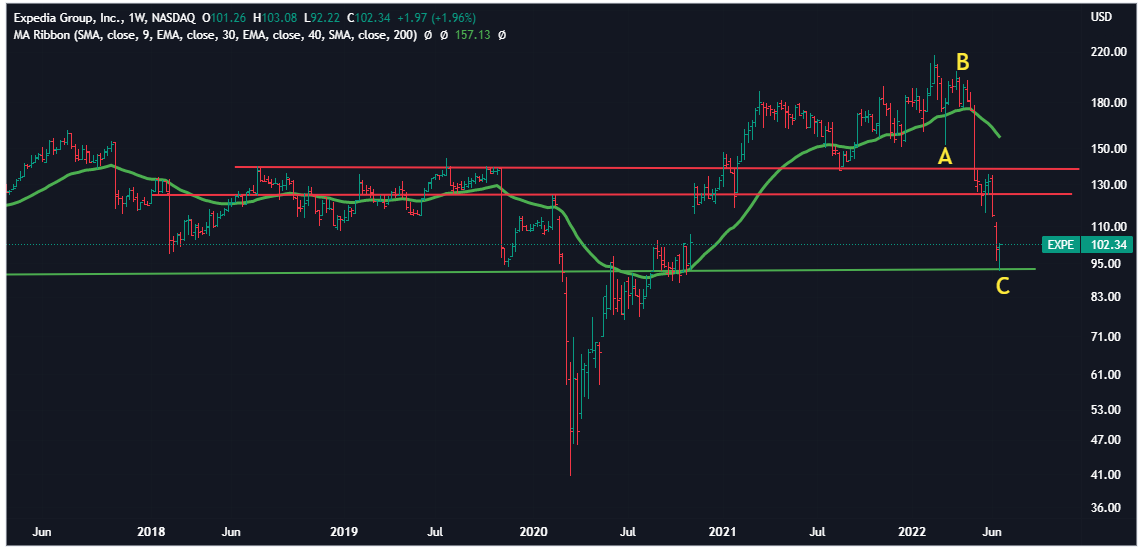
Expedia
Seems to have completed its first leg of correction and it is bouncing back in B wave ( or may be who knows the whole correction is over , would reveiw as we progress.)
Taking support at Key Resistance levels. (green line) A hammer on weekly charts (bullish pattern)
If it works out , 1st resistance is near 124 and 2nd resistance is near 137 ( so a chance of 20-35% rally).
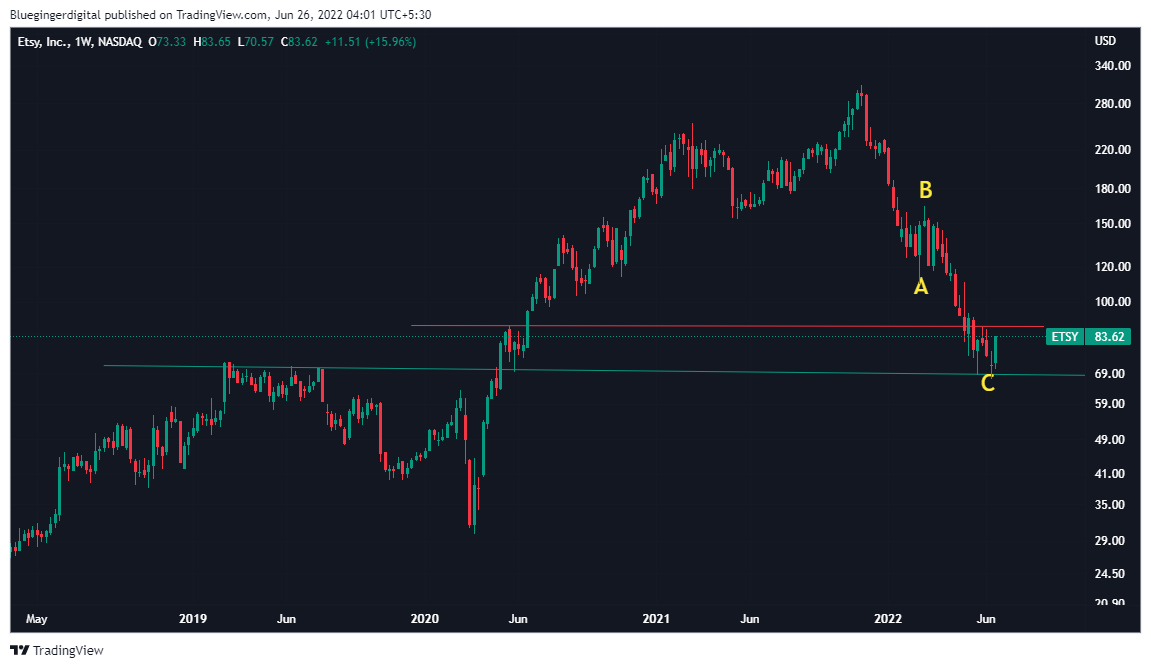
Etsy
Weekly Chart -Seems to have completed its first leg of correction and it is bouncing back in B wave ( or may be who knows the whole correction is over , would reveiw as we progress.)
Also a bullish candle last week .
But a resistance is very nearby at 88. To get 15-20% upside, it needs to cross this level nexr week.
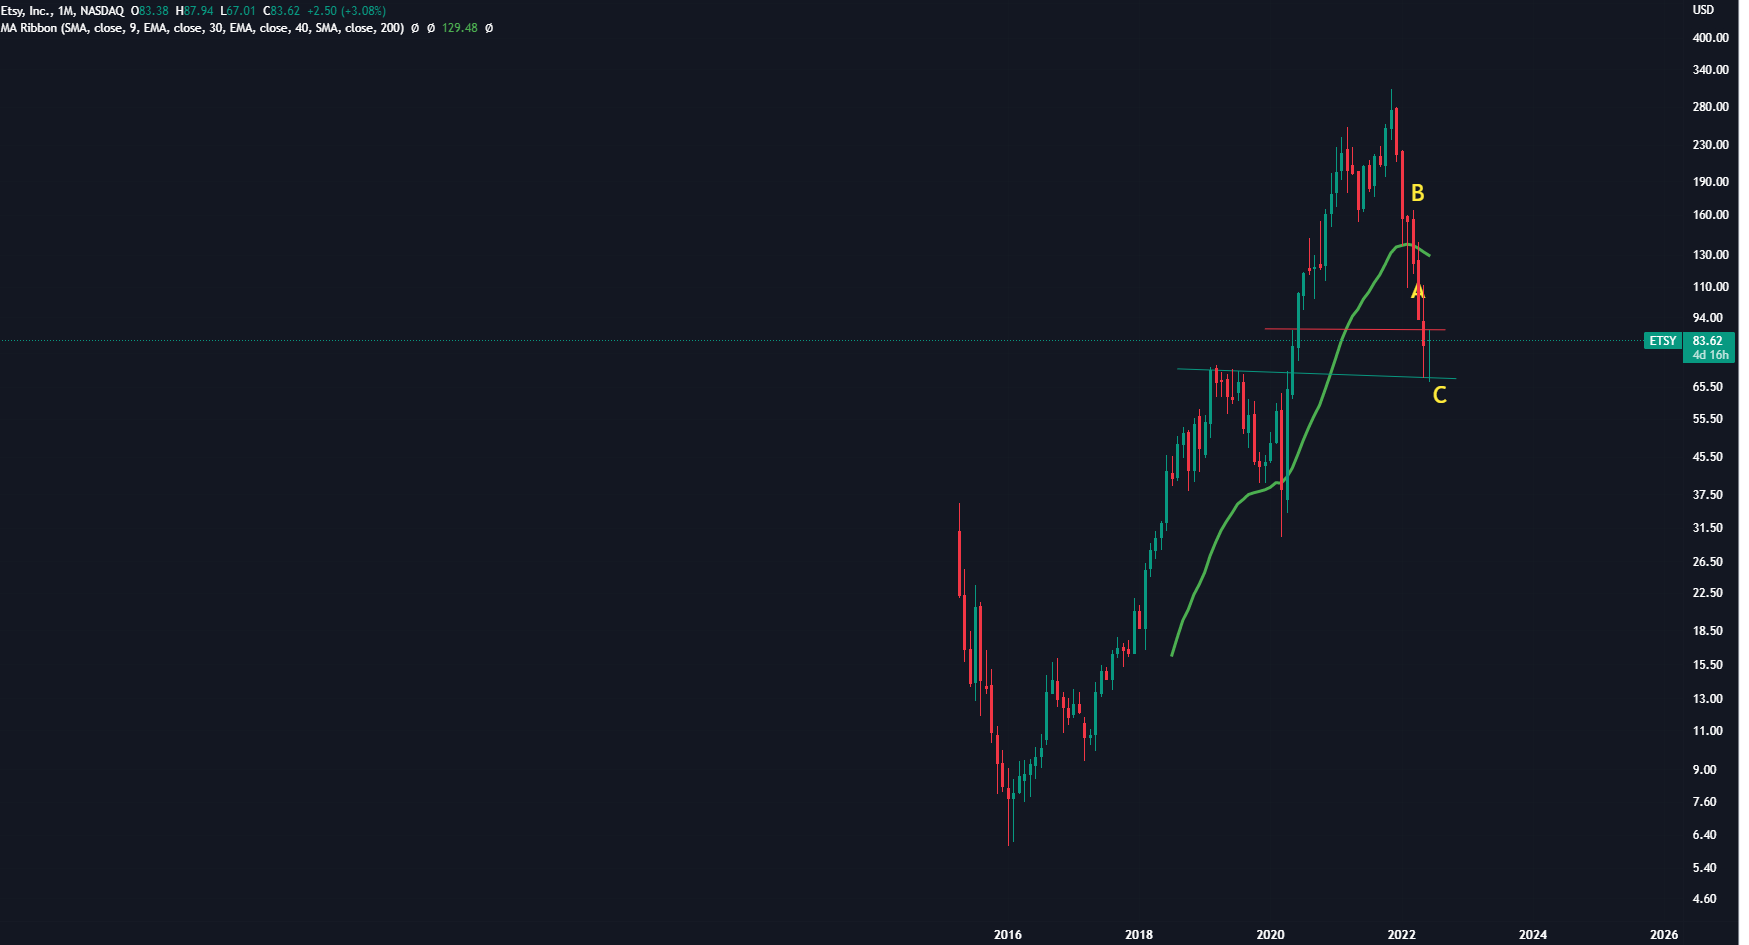
On monthly charts, seems to be Hammer in formation - again a bullish candle.( although month is yet to close)
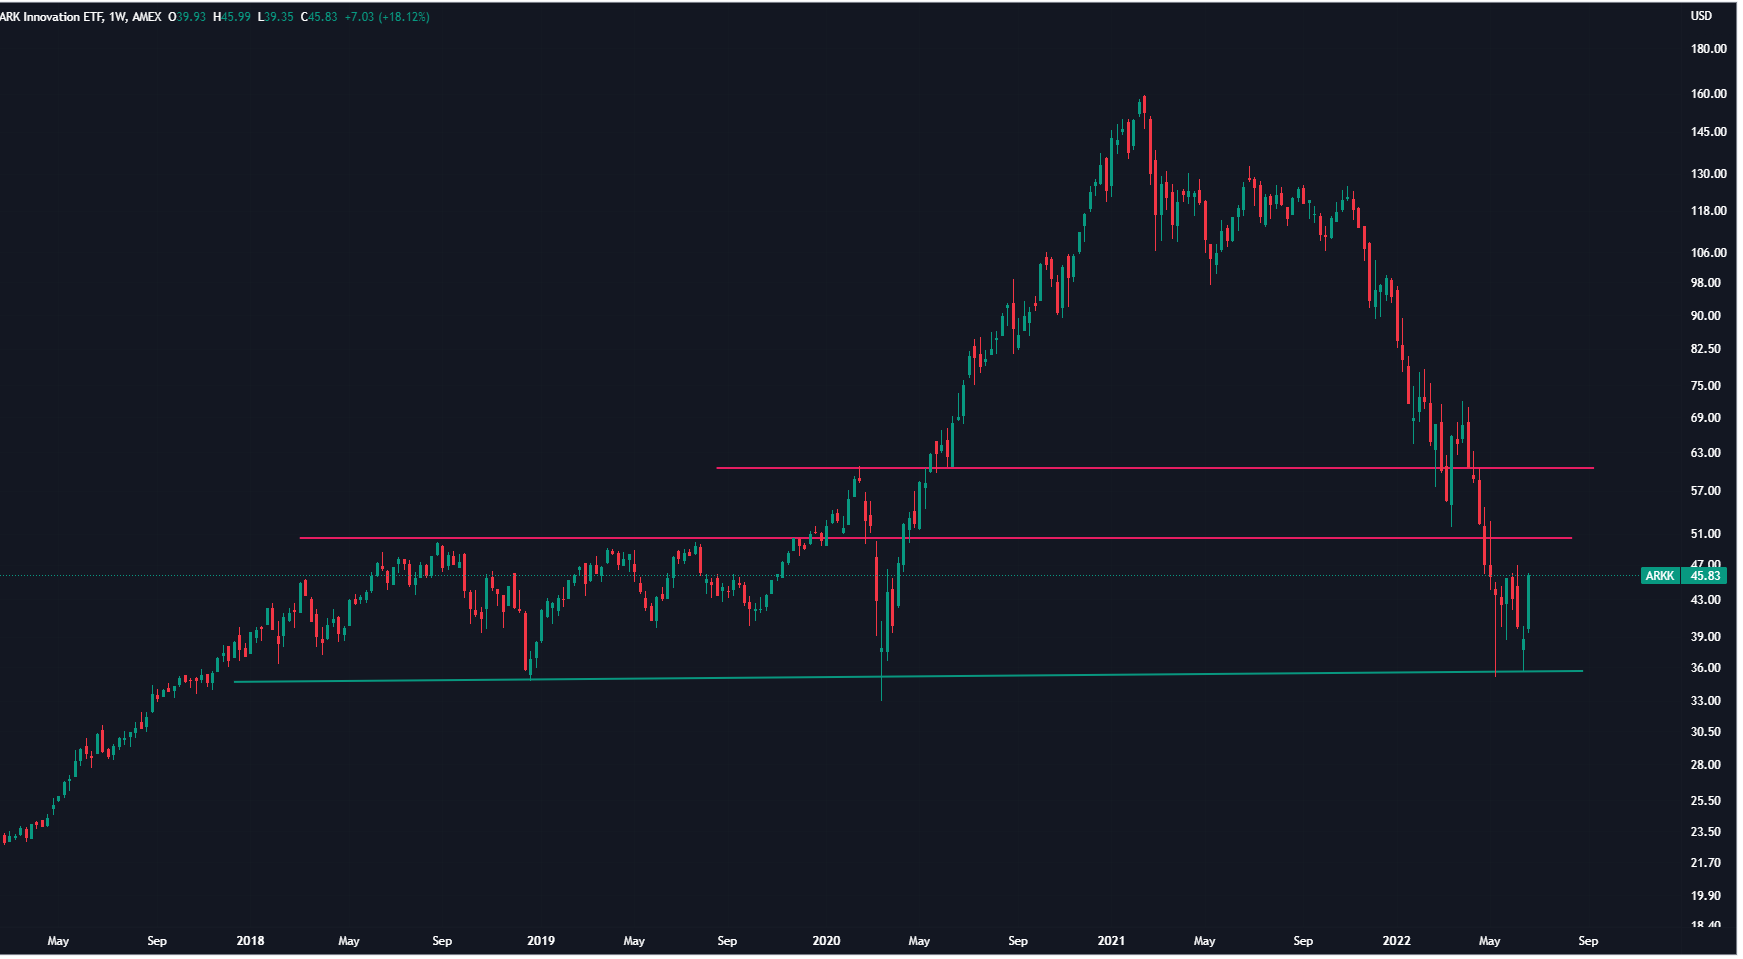
ARKK innovation Fund
The most talked about Cathy Wood’s fund.
Seems to have formed a morning star pattern on weekly chart on key support levels.
Now resistance is nearby at 50 ( 10 % from current levels ). If this gets crosses, then next resistance is at 62 ( nearly 35% from current levels)
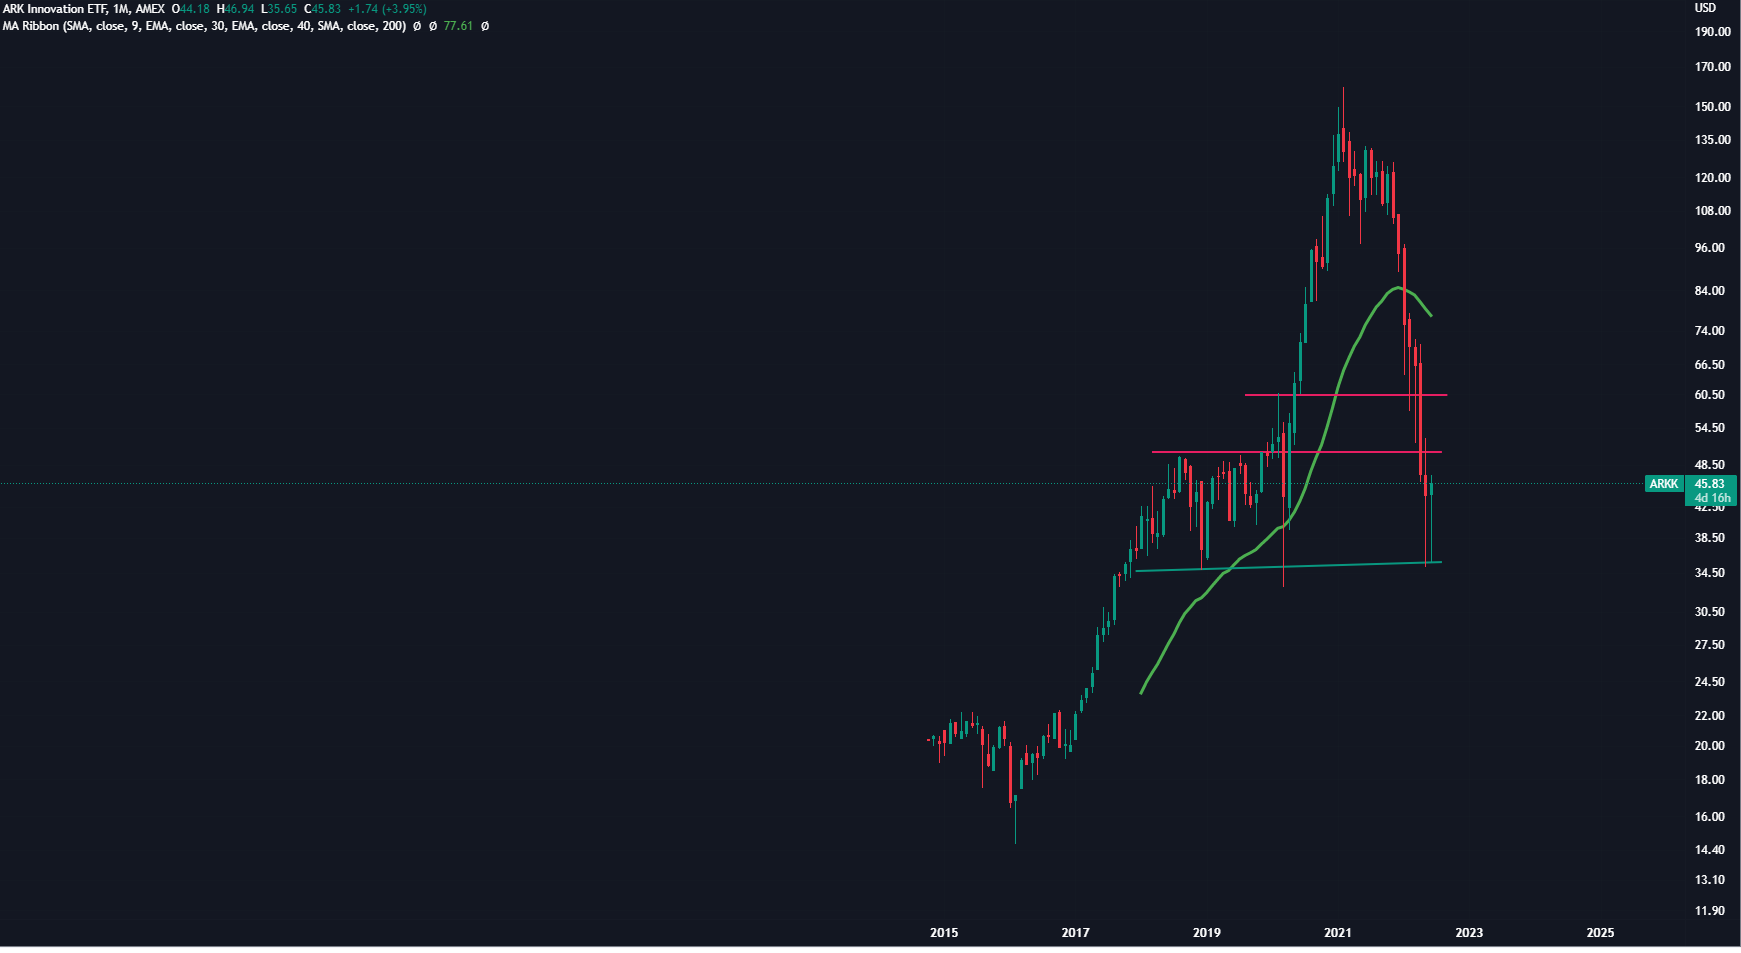
On monthly chart , it is forming a hammer ( but month is yet to close)
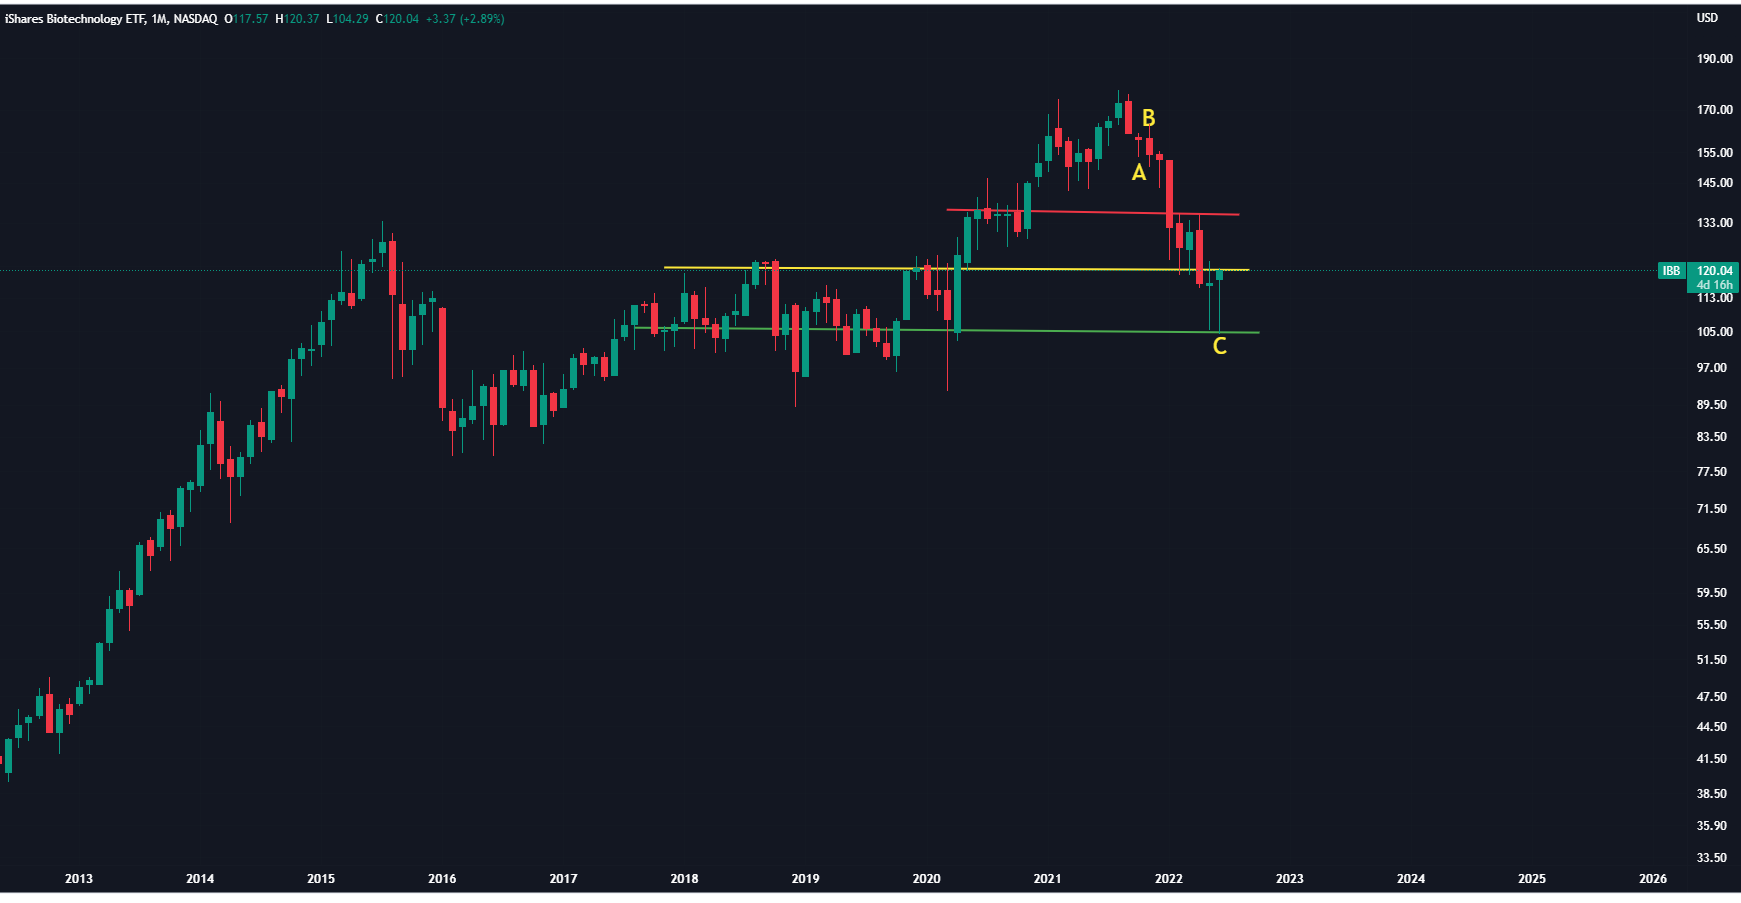
IBB -Biotechnology Fund
Other ETF, where companies had a good run last 2 years and then corrected badly.
Now on weekly charts,it took support at old support levels. 1st leg of correction (ABC) seems to be over. Now just waiting at next resistance level ( yellow line ) . Will it breakout ? Let’s see - last 2 week candles are bullish.
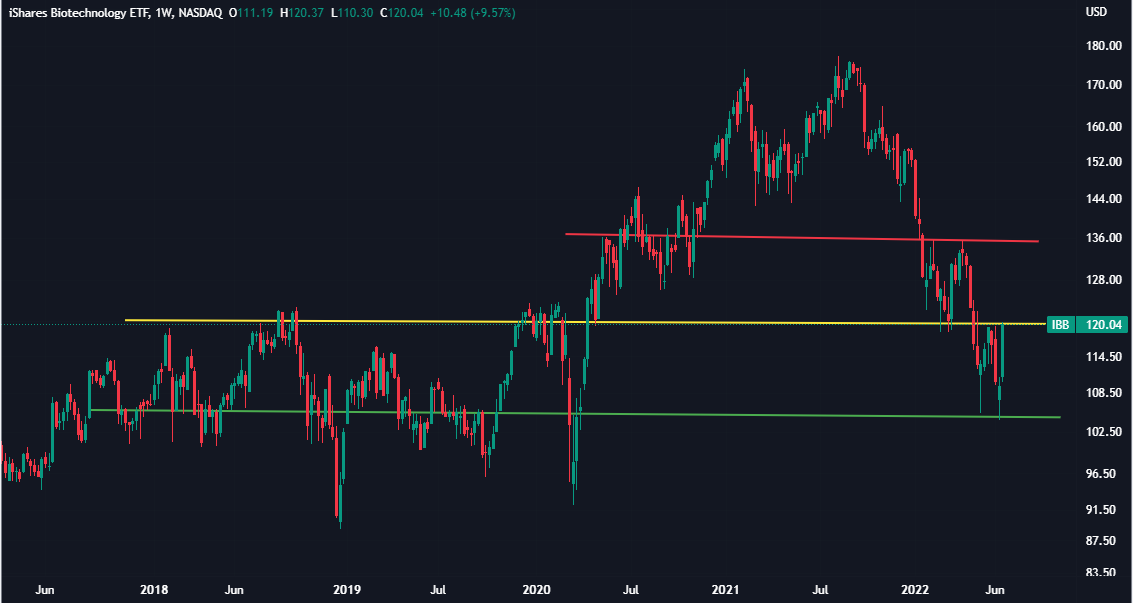
On monthly charts ,a hammer is under formation ( but month is yet to close)
Disclaimer: These charts are for study purpose. No recos ,no suggestions. These patterns are probabibilty set-ups with a 50% chances of failure.
Risk Managment -Learning risk-mangement is the key in the markets. What happens if someone has a position and all these set-ups fail - well, one should get out when key support levels break. But if someone misses the entry , then he/she might miss this small rally and what if the whole fall is over and we are startiing new bull run !
3 Likes
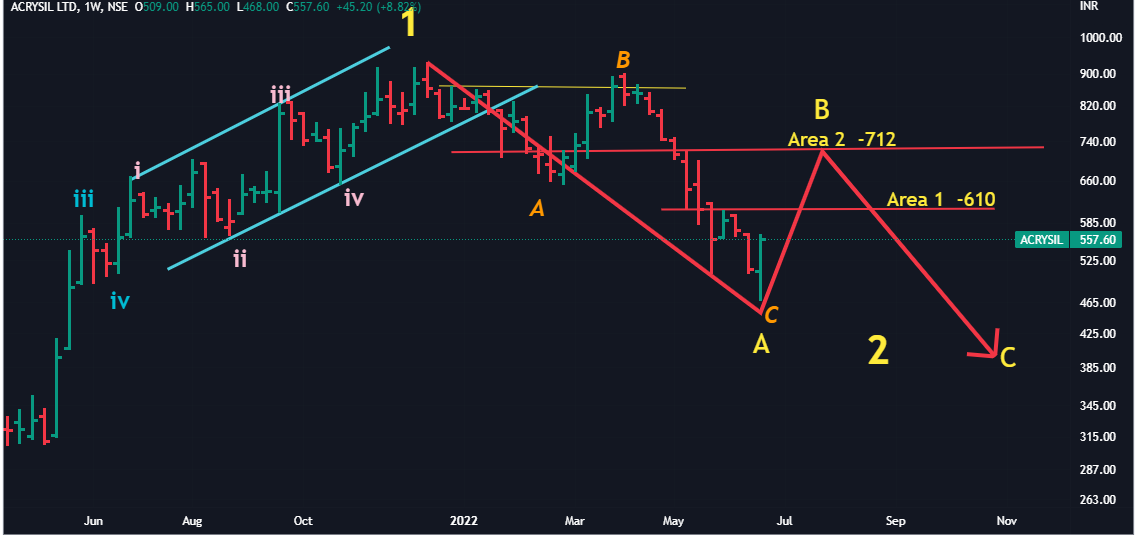
Acrysil -Follow Up
Acrysil seems to have completed its first leg of correction (or final correction, need to watch out in coming weeks ).
Now it is bouncing back…1st resistance should be near 610 and 2nd level is near 710.
If it starts trading above 710 for few weeks, one can ssume that correction is done and stock’s next leg of journey has finally started. But if it reverses back from there, the price can go much deeper.
A lot depends upon the overall market sentiments when it reaches these levels.
Disclaimer- Chart for study purpose only, no reco,no suggestion.
3 Likes
Broke the range , closed above the range last week - hence increased allocation on Friday closing.
2nd Auto stock also doing well - going as per the pattern.
all auto ancillary stocks will do well in medium term.auto cycle is in upward move.
2 Likes
Usha Martin :Long Term Bet
This one is part of long term holdings. Was looking for correction to be over and to buy additional quantity.
Monthly Chart : Seems to be stating its 5th wave .A hammer is under formation on monthly chart ( a bullish formation - but month is yet to end)
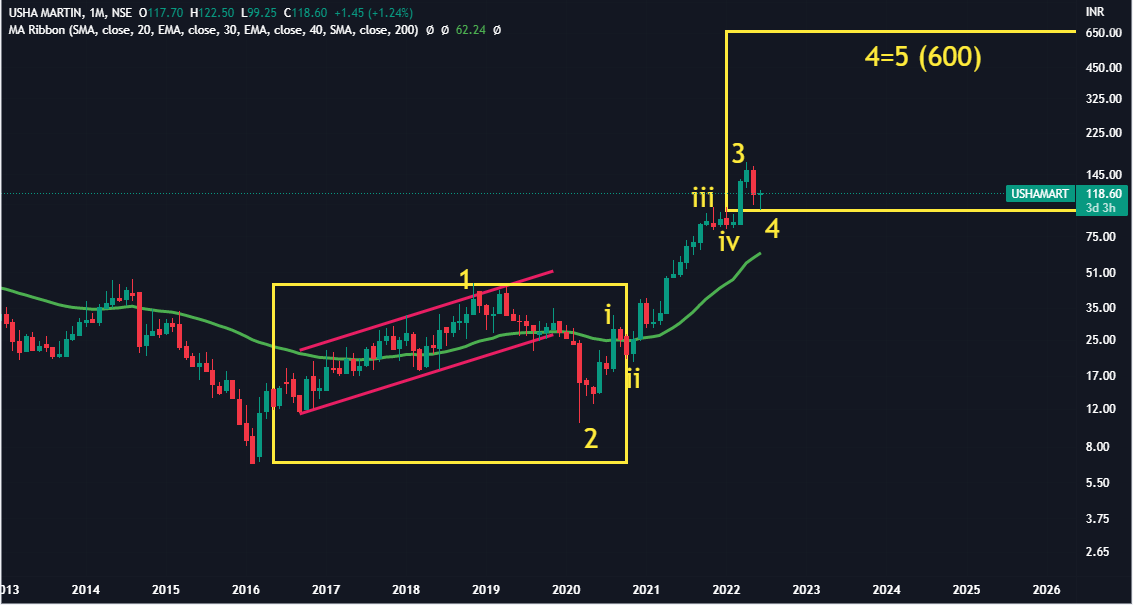
Can’be fully sure but it seems that it ended its correction near 100 .
Today gave a falling channel breakout as is visible on daily & weekly charts.
Also crossing 30 WMA .
119 (CMP) is one of the resistance. Next level of resistance would come at 135. If it crosses 135 and later on 163 (ATH) ,then we might be good to go for long term target.
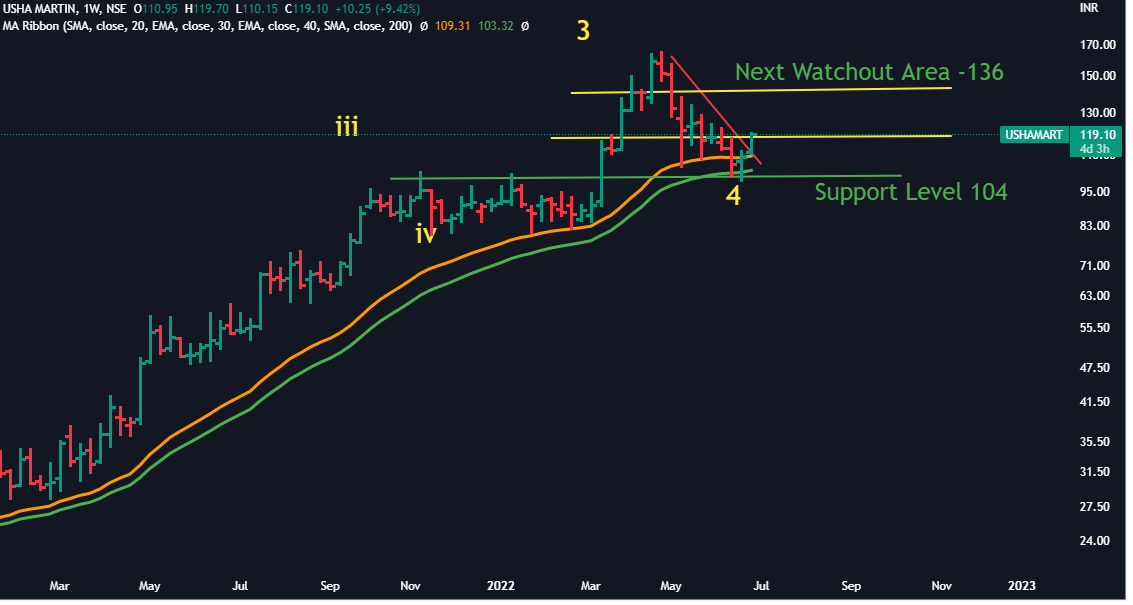
The whole set-up fails if the prices go below 104.
Disclaimer : Invested, views might be biased. Proper risk-management is neccessary in investing in stock markets. The charts are for study purpose only , no reco/no suggestions.
6 Likes
Gufic Bio : Other Long Term Bet
This one is part of long term holdings. Was looking for correction to be over and to buy additional quantity.
It has given a breakout from falling channel , crossed over 30 WMA (likely to close above) , a good bullish candle last week , similar candle developing on monthly chart. Close to 38% fibo level correction done .
Taking support at lower end of Bollinger band … in the past,completed its key big corrections in similar fashion (yellow circles).Hopefully it might repaat the pattern.
But currently it is facing another key resistance (yellow line) -can reverse from here ![]()
Whole set-up fails if it closes below 197 in coming weeks.

Disclaimer: These charts are for study purpose. No recos ,no suggestions. These patterns are probabibilty set-ups with a 50% chances of failure.
1 Like
It seems the upmove is over… it did 15900 as projected earlier…now back to square one.
Kopran Follow-up
Seems Kopran stopped at IV wave lows of previous leg…made a pin-bar last week and strated moving up.
Next levels to watchout are near 240, 257 and 275… only after corssing these and closing above these on weekly basis would finally signal that we are out of woods… otherwise keep enjoying the roller-coaster ride of a bear market.

Disclaimer-Chart for study purpose. No recos. No suggestions.