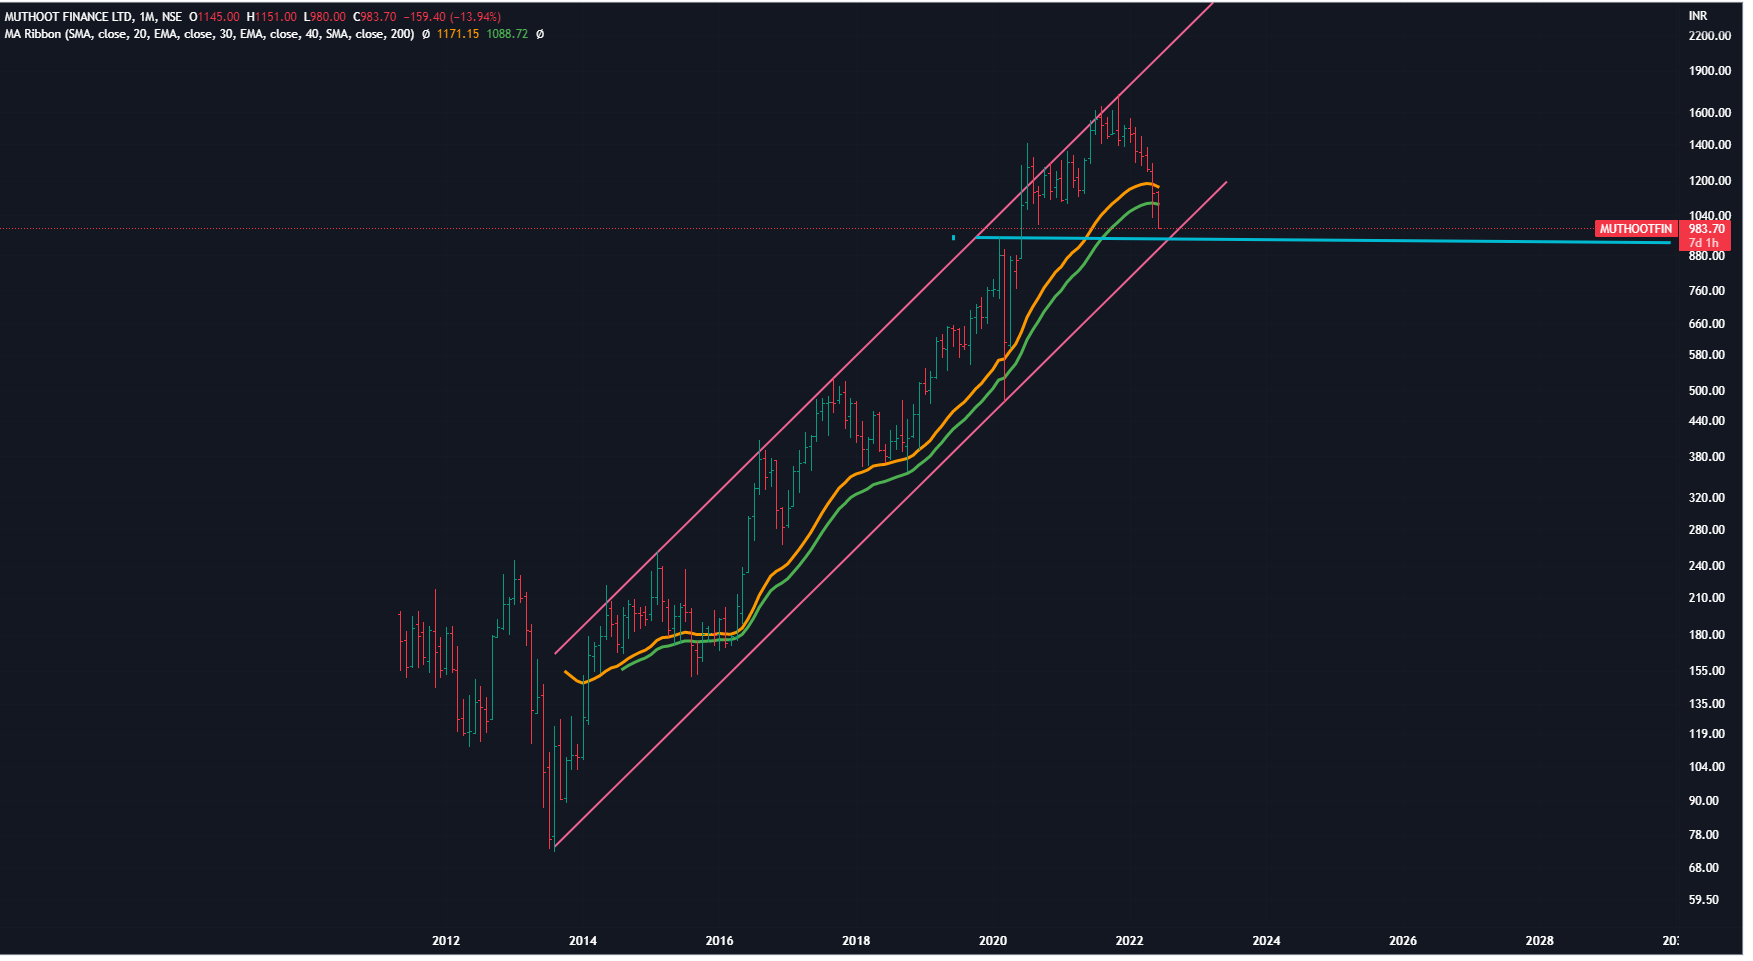
Keep a watch on HFCl in every bull run and when you 're looking for a market bottom .
It makes a top when Nifty makes the top ( all positive stories are floated ) - look at the previous top + add some 10-20 % inflation number .- and you might know that the market is at euphoric stage and lot of froth has been built up,
On the other hand , at a price of Rs 10 -it has been making bottoms in the past - that is an indication that market has finally bottomed.
But be careful - we might not need to wait for this stock to bottom to buy our future bull-market leaders as future leaders atart moving upwards befor the market makes the bottom.
Disclaimer : (A) This is based on past patterns -we need to combine it with many other macro-factors to decide whether we’ve reached at the top of 5 waves /accumulation . (b)This in isolation may or may not work in future (c) This should be listed also (d) May be real turnaround happens in this comany after so many years,who knows.
I was just telling my thoughts, giving another point of view. I said to check, can have a position, I did not say do, that is all.
If IT and pharma are rising or falling, there are bound to be reasons that are global, as they cater to other geographies, so without having at least an idea of such reasons and investing in them should not happen, whichever stage they are in. I had a position in pharma, it dawned on me that it was a mistake, I sold it. I still have positions in IT.
Also, look at the context in which I have said that. That answer was relevant to the person who asked particular questions in a particular context. One size does not fit all. Some can wait, learn and act, some may want to take a position and learn as they want skin in the game, unlike paper trading, some can learn just with a tracking position, some have FOMO. Some are GARP, some invest in high PE growth, some look for deep value, such investors exist right here in VP. Different strokes for different folks. Suum cuique.
I would not be here if I did not respect different disciplines, and I would not have posted if I did not know what I was saying. And of course, I am learning.
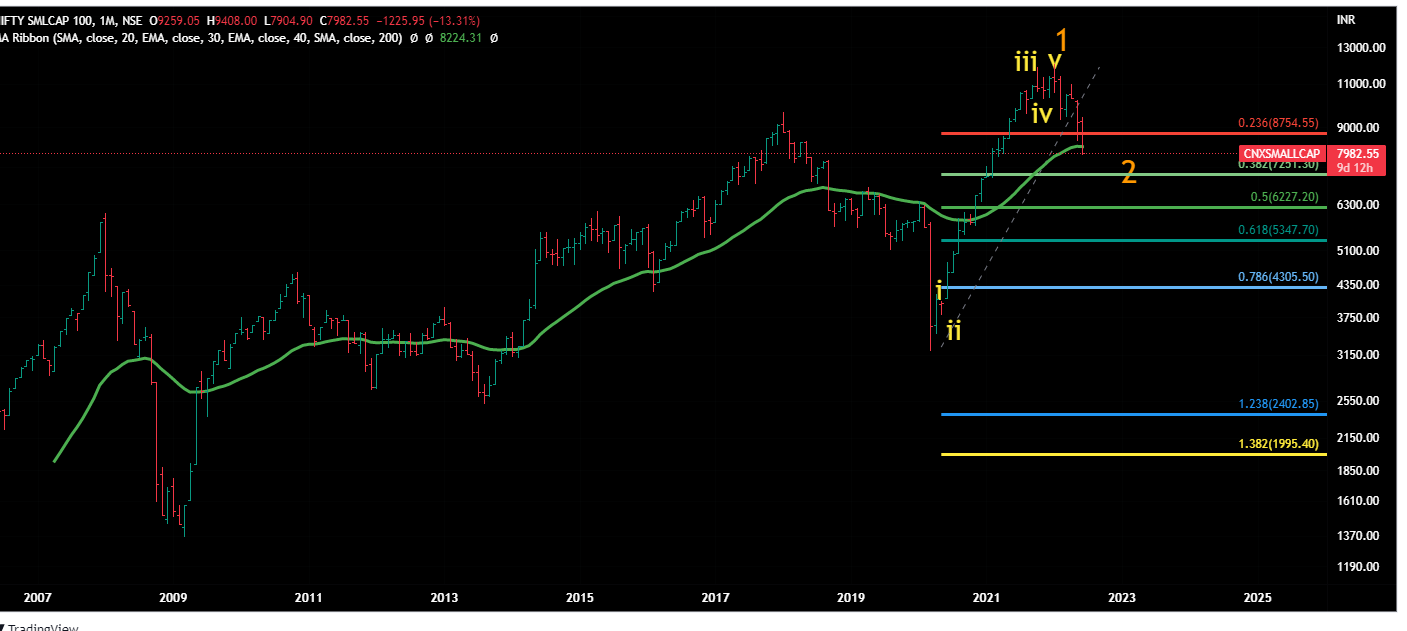
It has started trading below 40 months moving average , if it closes below 40 MMA by this month -end ,more pain ahead ( another condition - it should close below 40 MMA for 2 months on consecutuve basis)
(Had written about importance of 40 MMA about 45 days back)
Apart from trading below 40 MMA , history of small-cap correction shows that after a bull-run, the correction is always deeper than large/mid-caps.( just have a look on what happened in 2007/8 and 2018)
As of now , it is at the levels of little more than 23 % correction on Fibo levels …currently trading near 8000 levels …next support is near 7200… 38% of Fibo-levels i.e. about 10 % more from current levels.
If that happens…a lot of bloodbath…as small -cap index may correct by only 10% , but damage in certain individual names might be bigger. Let’s pray for the long -term holders that this does not happen.
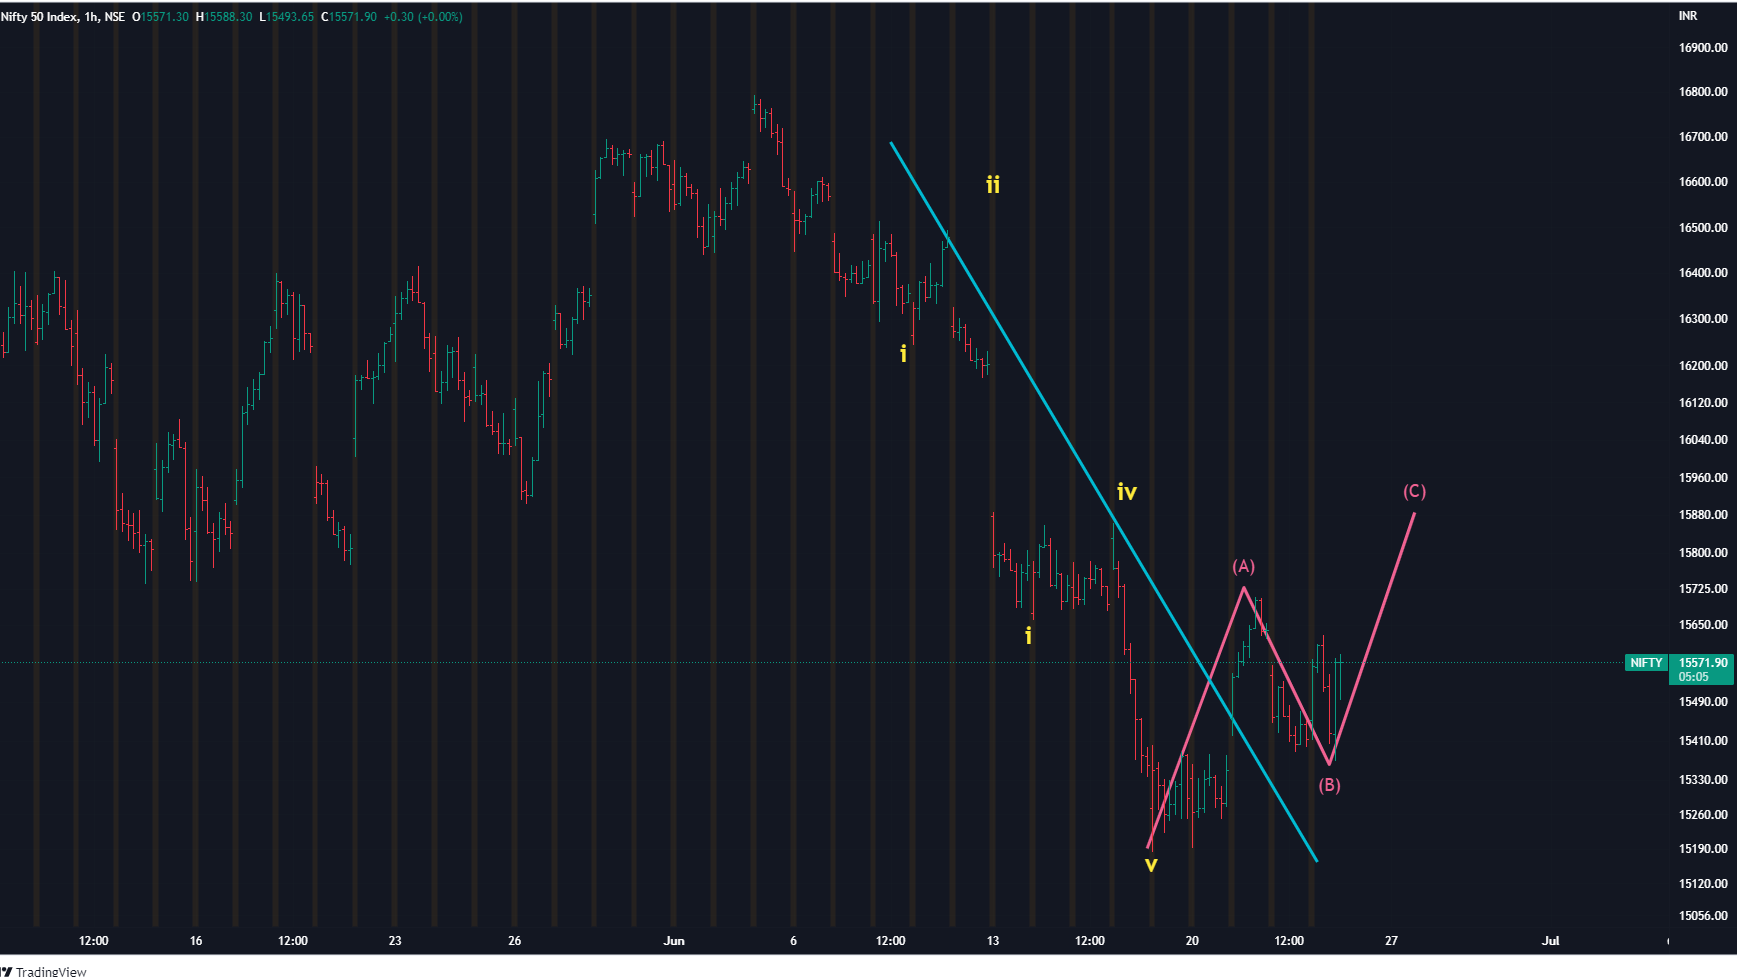
Anyways , no rise/fall in the markets happen in a stratght line. We’re expecting a counter-trend bounce in overall markets ( bear-market rally) , so if this fall has to happen , it would take a lot of time.
Disclaimer : All these charts are based on past patterns - they might repeat or not . We work on past patterns because of 2 reasons : (a) History does not repeat but it rhymes (b) Humans never change (due to our evolutionary-DNA) , they behave in a similar fashion in a similar set of circumstances ( especially where masses are involved)
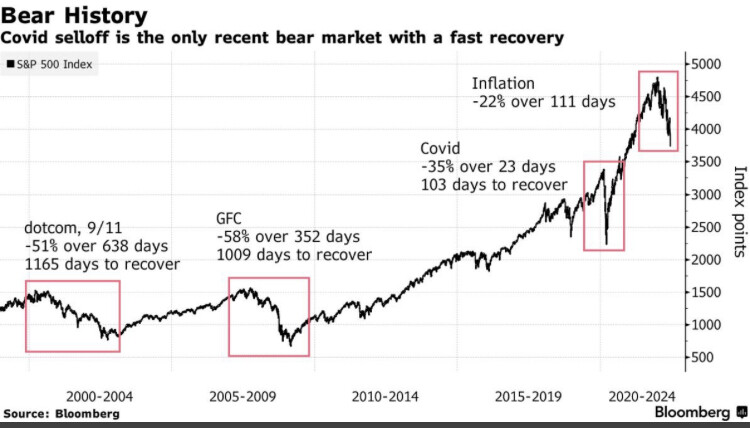
Recoveries are slow if equity prices go down slowly in a grinding way. That is the result of structural shift in underlying global-macro factors i.e. economy, liquidity , bubbles in certain pockets etc.
Recovery is faster in case of sudden falls ( Covid, Demonetisation, Sudden War etc)
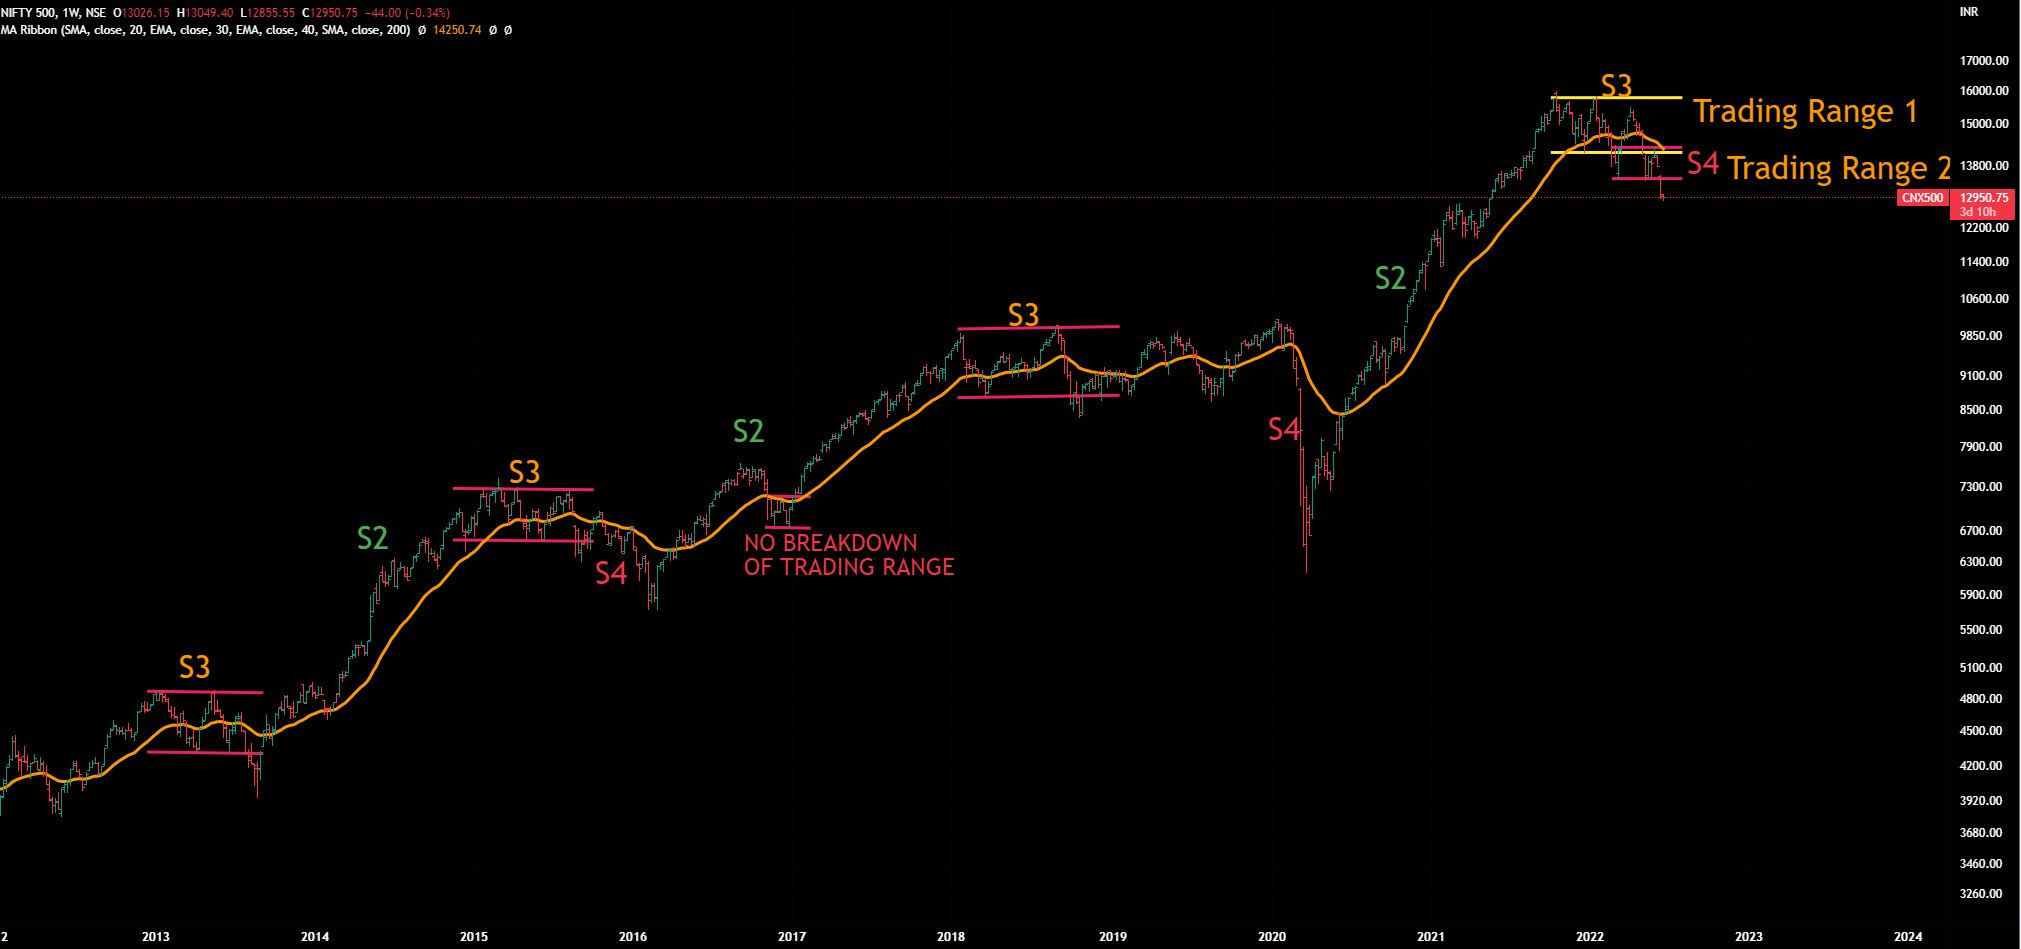
Here’s the historical presepective ( last 25 years ) from one of the world’s mature index.
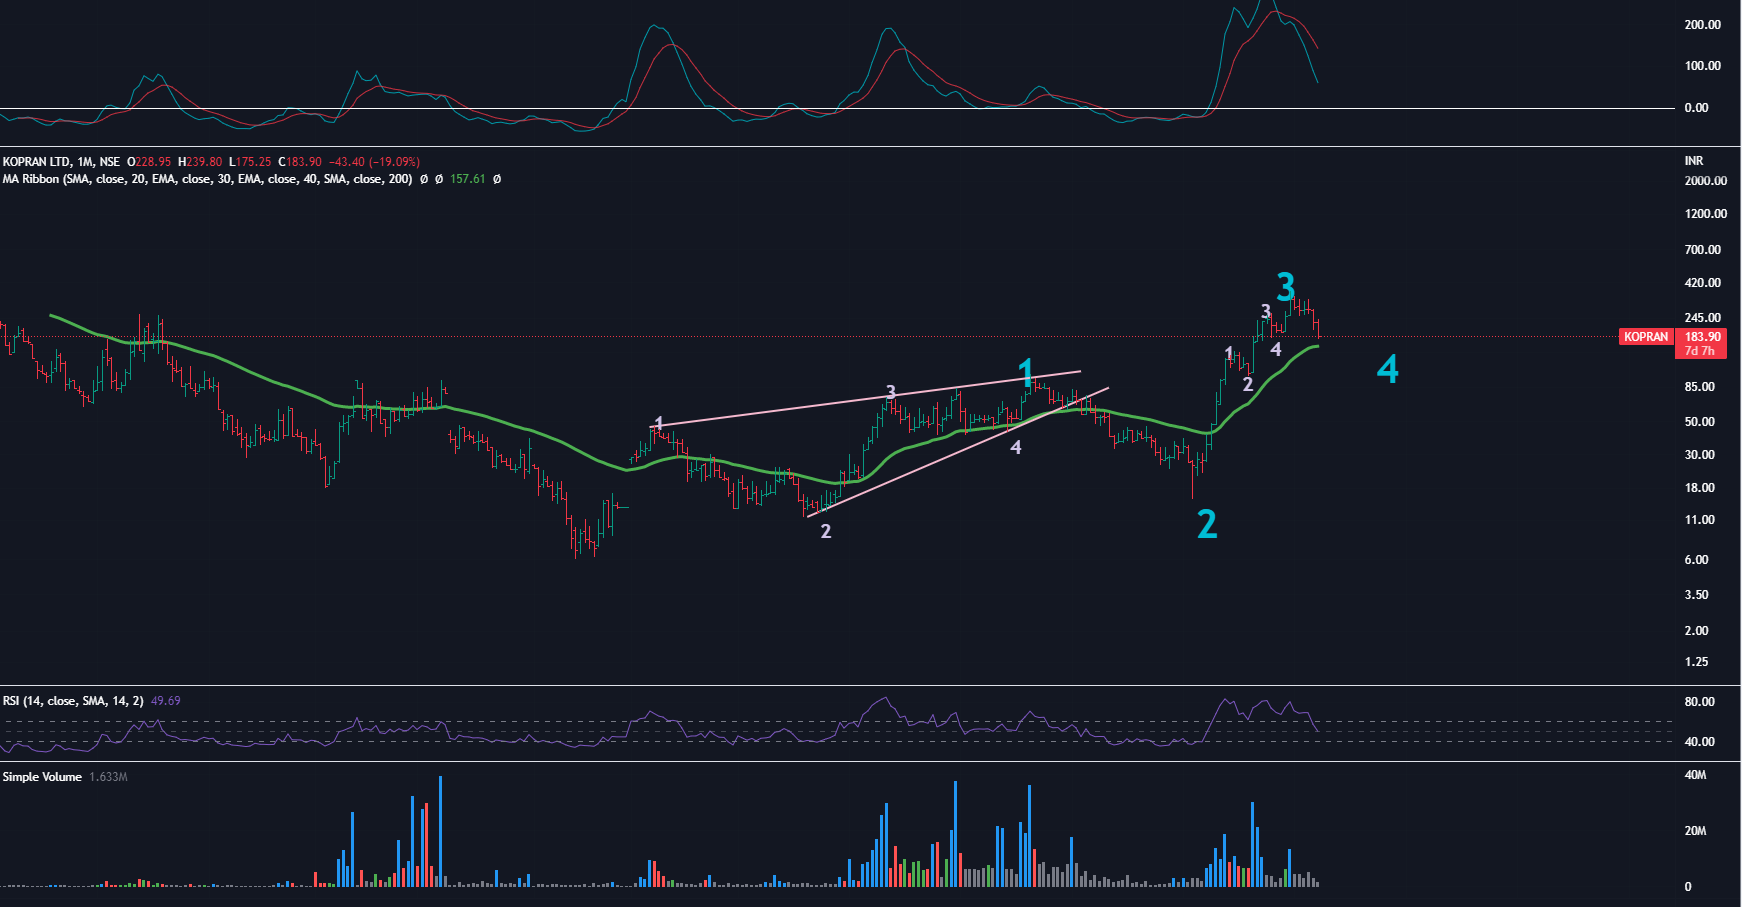
Just sharing EW analysis of one company that I find interesting on fundamentals basis. Looking for the levels to enter once this bear market is done with.
It seems to have completed its 3rd wave in this bull-run and now it is in 4th wave correction. Hsitorically it gives deep corrections in every pul-back ( wave 2 pull-back was real deep).
Generally wave 3 corrections end at the levels of wave 4 of previous fractal but here it has broken that level also (about 190-195). True to its nature of giving deep -corrections.
Apart from the stock - market and sectoral sentiments are also low as of now, so any recovery from current level does not look feasible unless sentiments improve dramatically. Technically MACD cycle also needs to complete .Also can’t see any big buying or selling happening in this counter or any divergences on any of the indicators.
Now where it can stop - will look for support at 40 MMA near 158 ( this MMA will also keep going down if prices keep correcting so somewhere near 150) . This level will also match 61.8 % retracement on Fibo levels.
Let’s keep a watch- no feelings , no emotions, no guessing - just analysis on probabilistic set-ups based on certain proven mathematical models.
Disclaimer : These are probabilistic projections based on study of similar past -patterns in various stocks. But history does not repeat ( although it rhymes ) , so no reco,no suggestion. Chart is for study purpose only.
Disclaimer : Chart for study purpose. Market as well as sector sentiments should be in-line with the stock. Still there is no guarantee. No reco ,no suggestion.