
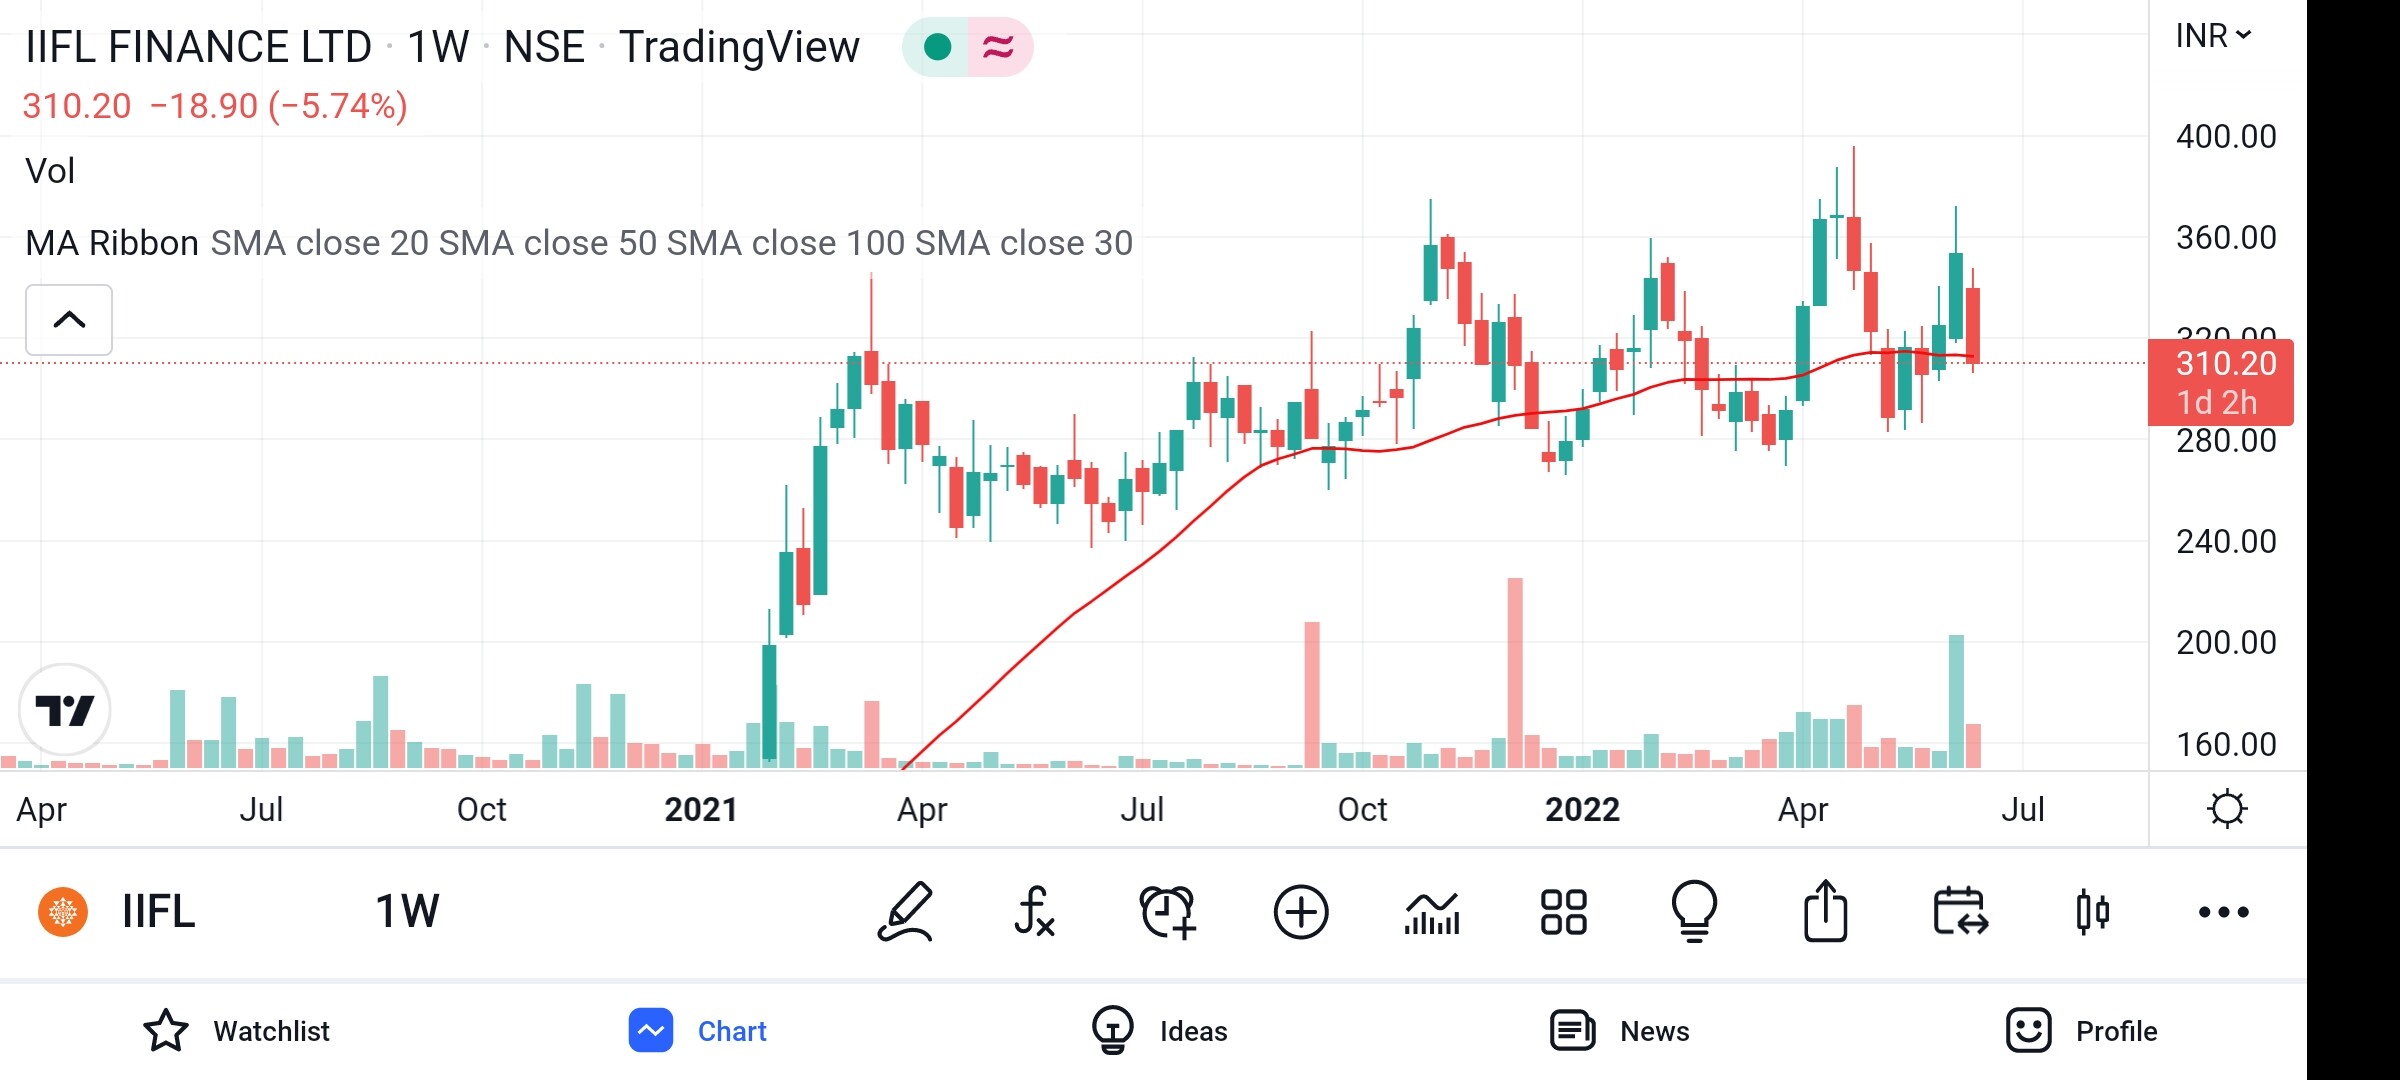
IIFL Finance in stage 1 as per Elliott wave theory. Fundamentally very strong. 20% roe nbfc capable of growing at 20%
1 Like
Souresh
Thanks for this chart.
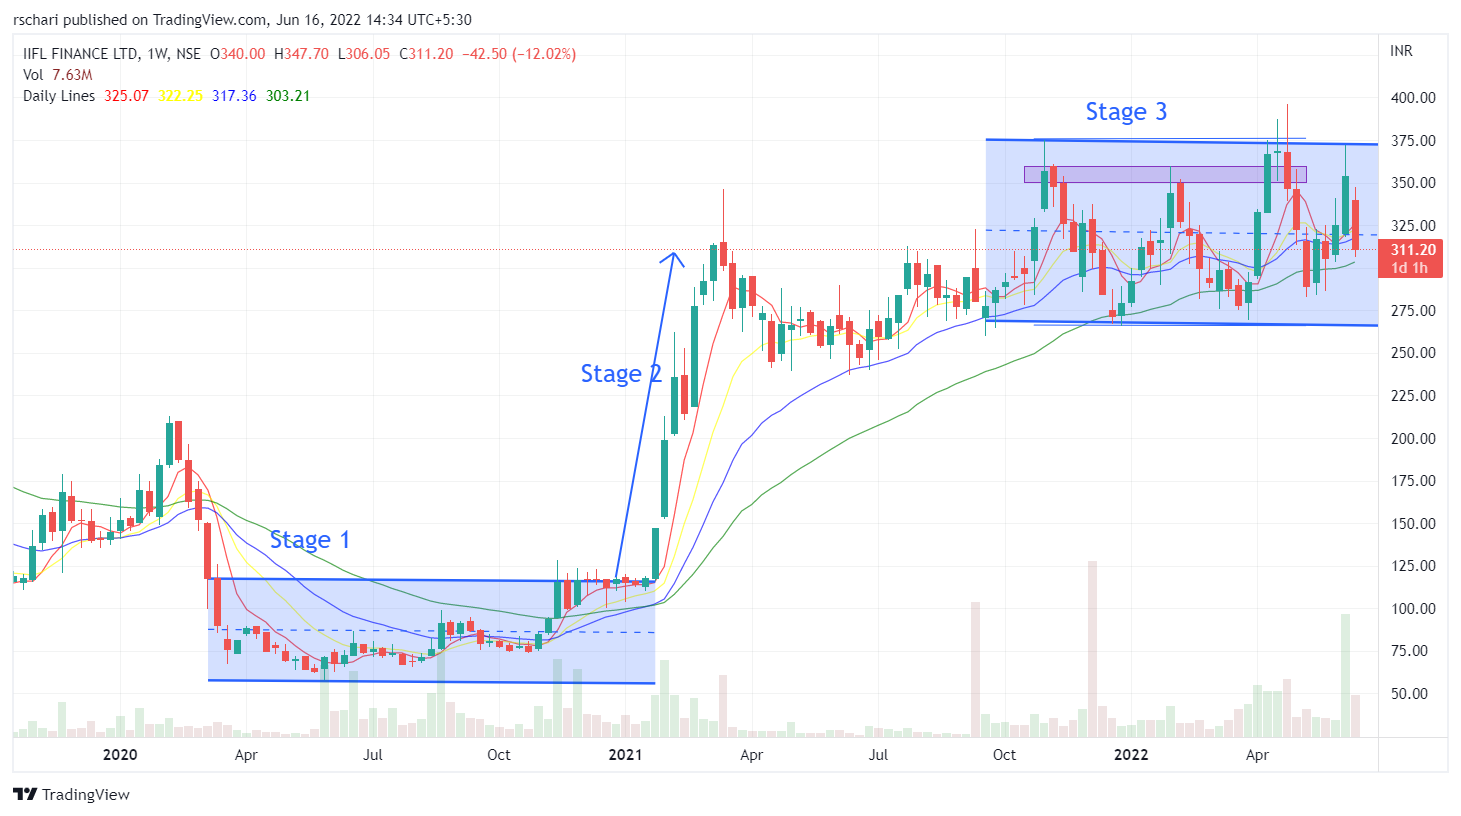
I am at very early stage of learning TA and when I look at the chart it looks like currently the stock is in stage 3 ( as per stage analysis).
You mention your analysis is as per Elliot Wave.
Can you explain some more ?
@StageInvesting request your views as a live learning case study.
Thanks to both.
I’m also very very new to TA. Just started yesterday.
Okay as per the stage analysis theory stage 1 can be formed after a rise also.
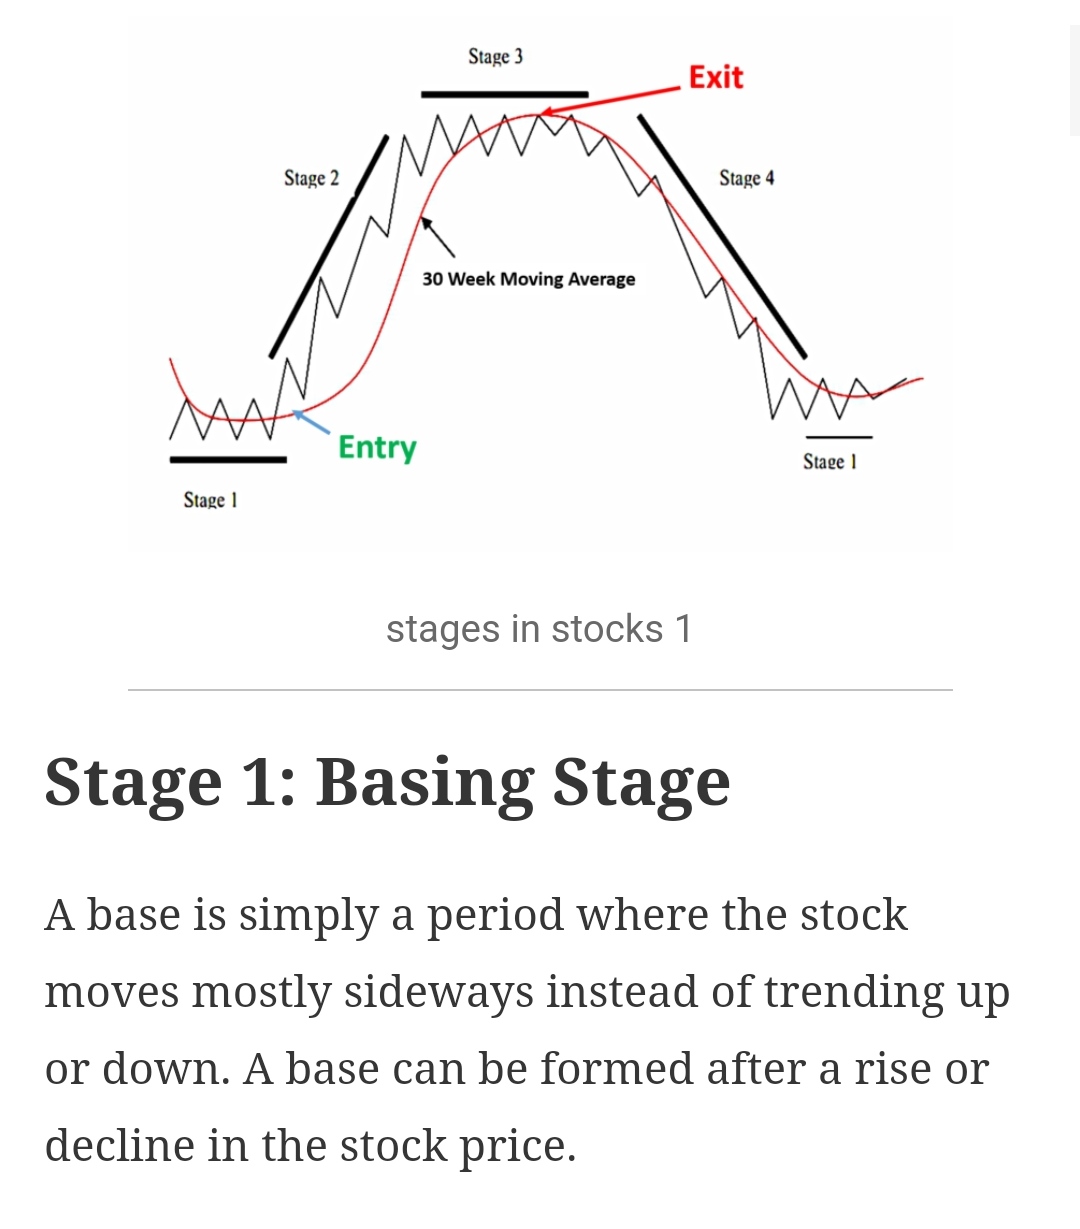
price will be oscillating above and below 30 WMA. The longer the period the better it is. So presently it can be in stage 1 also.
Now looking at fundamentals IIFL is in solid condition. 20% ROE growing at 20-25% available at around 1.9 PB ratio, 10 PE ratio. Super undervalued
Interesting. Well I am only reminded of what @StageInvesting has always been saying. This game is of probabilities and so much prone to individual interpretation. So, it can go either ways I guess.
It could be stage 1 or Stage 3. Or its possible that we are looking at the wrong indicators.
Agree completely on the Fundamentals / valuations part. There are a lot of positives there ( Kya yahi pyar hai ? ). Though I am invested heavily in this stock, I am trying to be practical and not emotional ( easier said than done).
For stage analysis volume also plays very imp role. On right side volume ideally should’ve higher on up days and low on down days .
1 Like
One request
Don’t try to bottom-fish in this bearish market- I have been saying it for last 2 months since I strted this thread.
For Stage 2 to work properly , sector’s and market ’ s positive sentiments are the first key requirements.
If market/sector sentiments are not positive, either a stage 2 stock won’t pick speed ( or would linger in Satge 3 for long, wasting your time ) or would break-down along-with larger markets.
Yes you can keep these in your watch-list , when market-sentiments become right , check the sector sentiments too- then start adding ( i feel that stage is still 4-5 months away ,at least)
Remember one thing on fundamentals: लड़का या लड़की भले ही जितने भी सुन्दर हों ,काबिल हों, अगर गांव में या आस पास eligible वधु या वर नहीं है, तो वो कुंवारे ही रहेंगे …means you might have best apples in the town , if there are no buyers (mutual funds, FIIs, HNIs etc.) , then there is no value for those apples.
And that is the crux of Stage Investing. - When buyers come (above 30 WMA, curve looping upwards, volumes and least resistance on left hand side), then you enter the market for purchase .
Hope you won’t listen to the news, to so called SIP advisors, to your own belief that company is undervalued etc etc. If you follow a system, follow it fully.
9 Likes
Worked like a charm……as predicted on last Saturday…bottom is still far-far away…don’t get tempted too early …you will get lot of discount in coming weeks/months.
3 Likes
Would write a full note on basing stage in coming days …what bases are good ,what bases are high potential and what bases should be avoided.Keep a watch here.
6 Likes
Power ,Energy,Oil -now the time for their downfall has started.
It’s very tempting as you rightly said. But waiting and following the stage analysis can give great discount for these stocks with good fundamentals.
You might not get good discount in few cases, but at least you would ride a moving bus and won’t loose on opportunity cost with stage analysis.
Here is one more stock sterling tools with good fundamentals seems to be giving a breakout above 30 wma line with good volumes. Auto ancillary company sitting on 50% capacity utilisation of fastener business. giving opportunity of operating leverage. plus optionality of EV space entry.
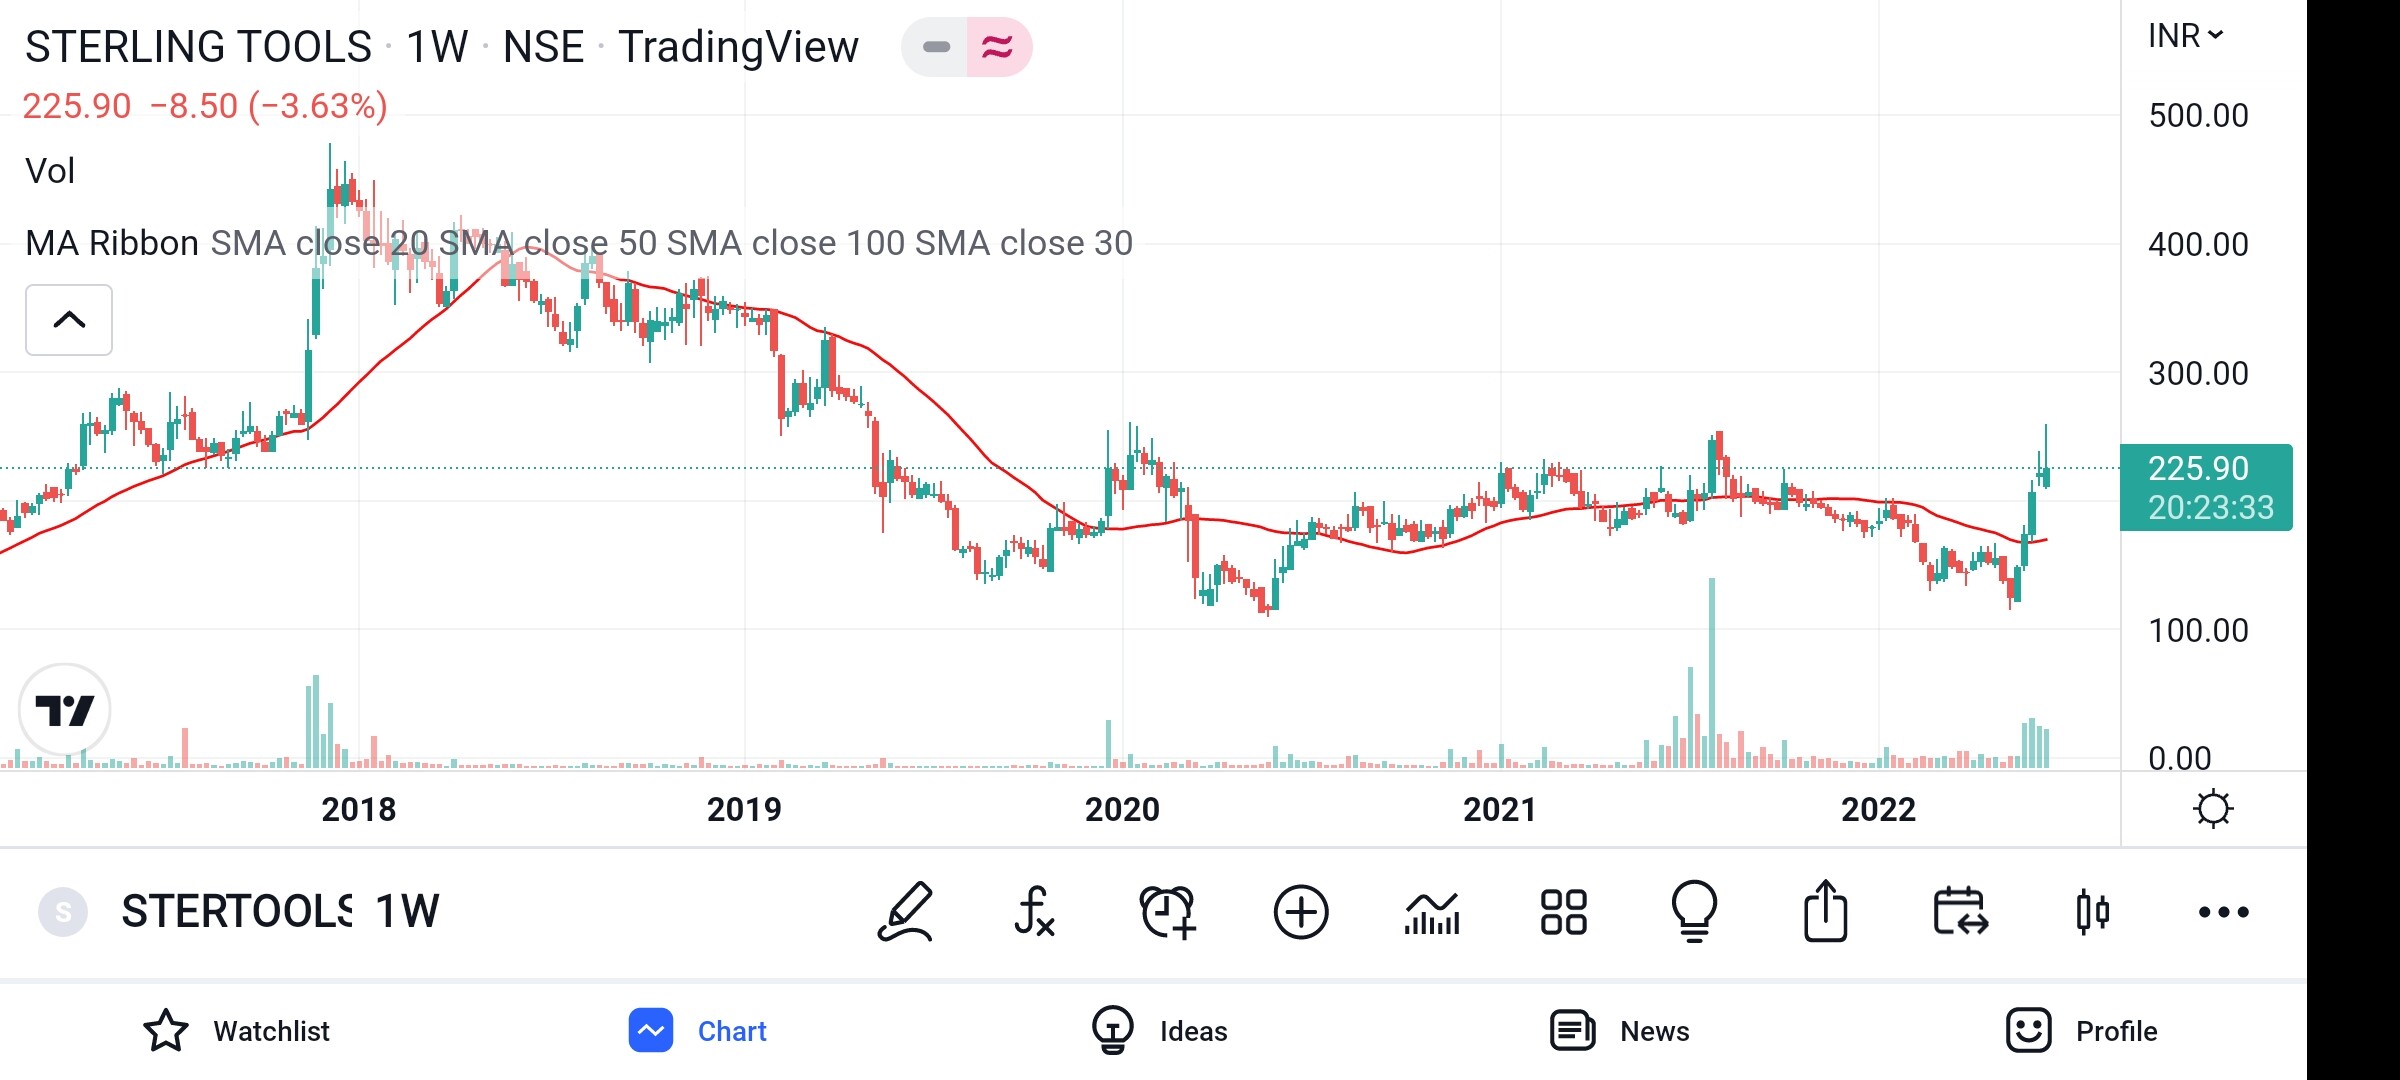
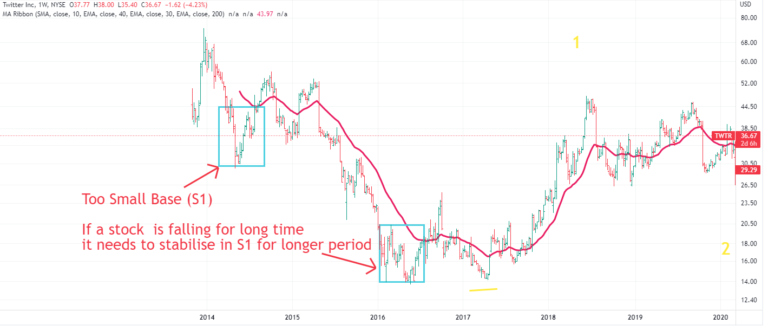
The chart looks to be similar to twitter chart provided in your article
1 Like
Boss- please don;t waste mine and your time by getting blinded by recency bias ( recent bull market ) and bullmarket stories.
Try to remain quite in the bear market.
Recency bias is making you blind -There is clear resistance nearby- look at the left hand side . It s trading between a range for last 2 years.Look what happened when it tried to break out in the past with better volumes than last few weeks.
As far as your fundamental logic is concerned-it is full of hopes- question yourself why they’re operating at 50% capacity - that means they don;t have orders ! And what if the apacity utilisation goes down to 40% if demand slows down? As far as EV entry is concerned, if everyone gets into EV, lot of compettion ! So this is just a bull market story to trap gullibleinvestors.
Keep in mind- even for strong fundamantal comapnies - when they raid the bar, even the pianist gets to jail.In a bear market, nothing is spared.
4 Likes
@StageInvesting | Request your recommendations, which are relevant to the Indian market (if possible), to learn this aspect. Thanks in advance.
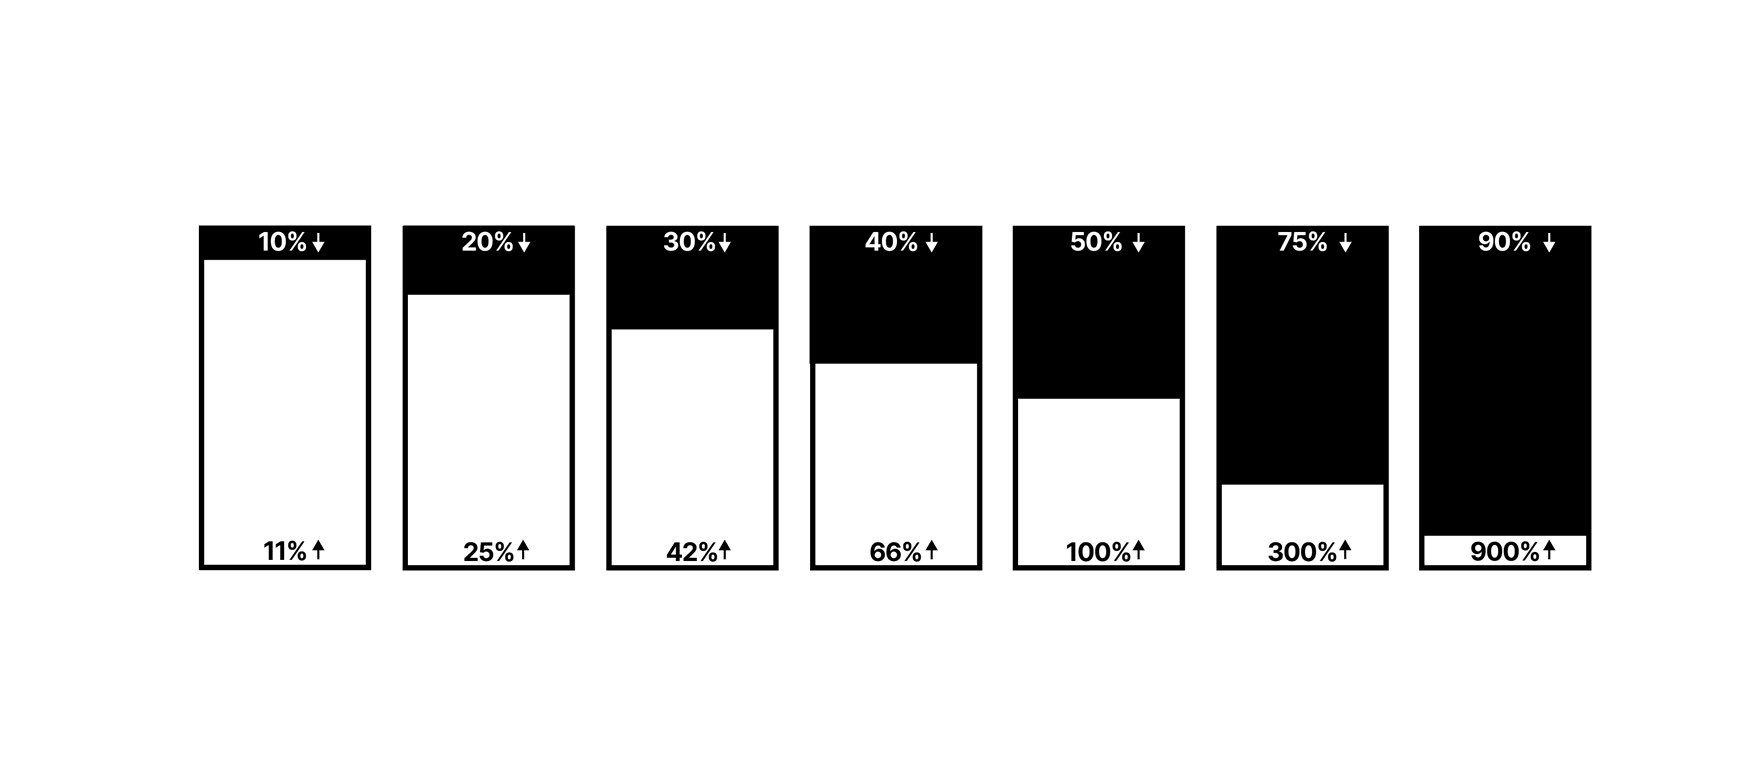
Save Your Capital
We might have a bear market rally in July ( as we’re falling for last 3 months) --and bear markets rallies happen to be ferocious and fast, tempting you to believe that worst is over.
Be very very careful .
Capital preservation should always be your #1 priority.
Clawing back capital becomes exponentially harder as losses deepen
A 50% loss needs a 100% gain just to break even
A 75% loss needs 300% to recover
Opportunities will always be there, but will you?
Print this table in your brain.
11 Likes
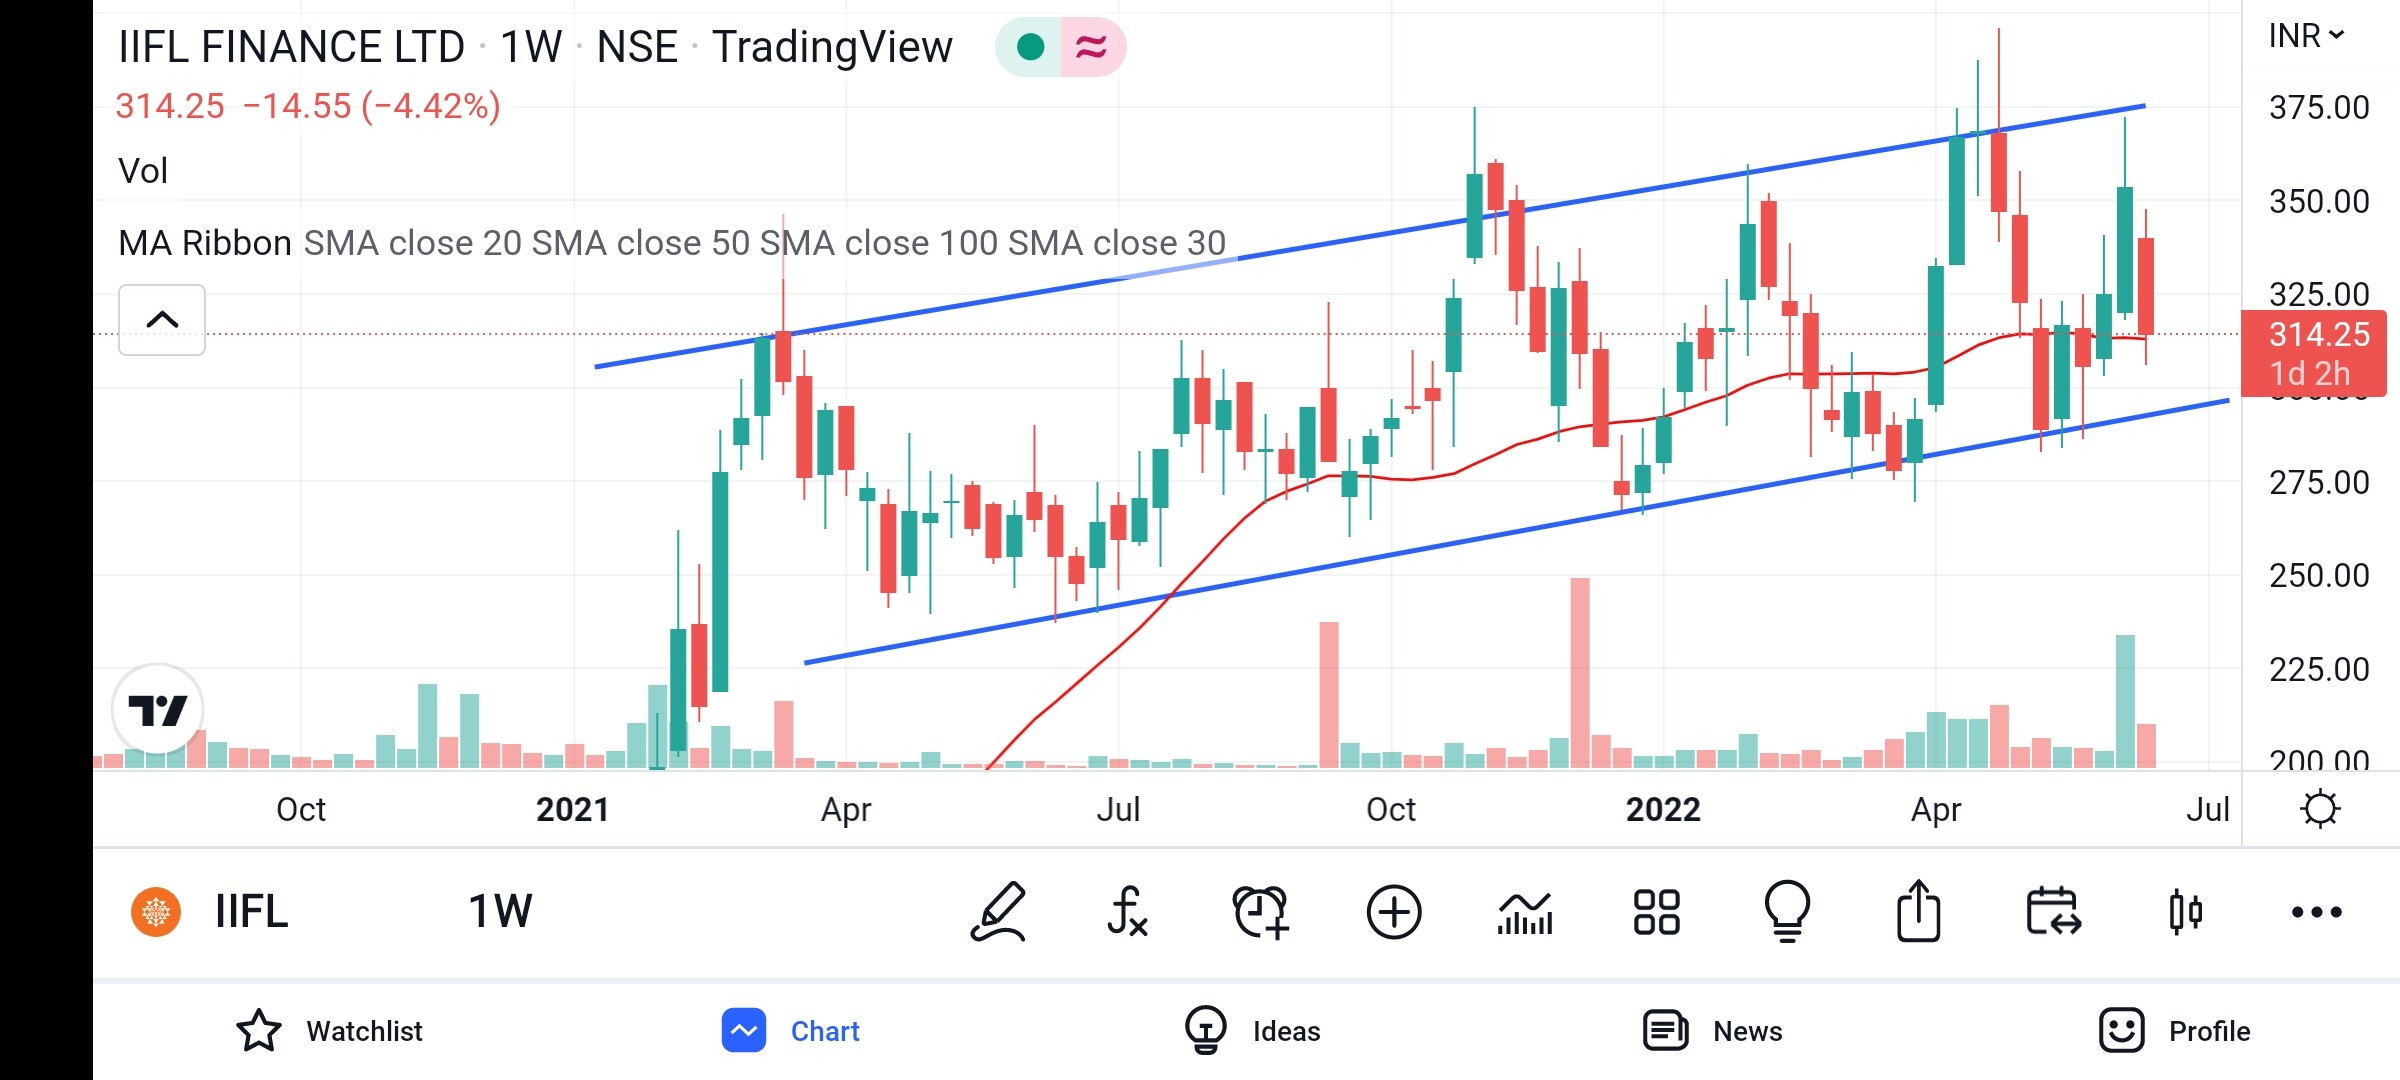
Drawing Lines for Making/Saving Money
Few simple lines can make you or save you a lot of money .
As a famous song goes -हाथो की चंद लकीरो का सब खेल है बस तकदीरो का
Start exploring charts …start drawing few lines - channels and few others .
Here are few patterns of bear markets that can be seen by drawing by just one or two lines, these would help you to exit at the right time.
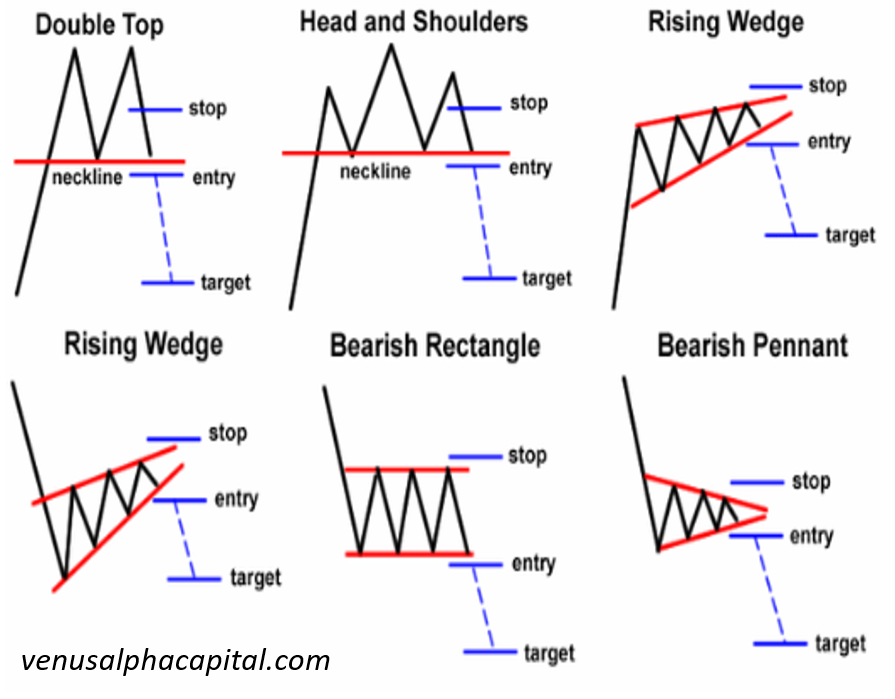
(these are used by bears to make the shorts)
9 Likes
So for a stock to close slightly below at similar levels below 30 wma for few weeks is the early sign that the rally migh be over and time to get out?
Practice yourself, start writing the lessons. Few things are better to be learnt by oneself.
While learning, just observe for few weeks/months , don’t take any position or take a very small postion.
But do keep in mind- take a hollistic view - stocks would behave differently in a positive market/sector sentiments vs in a bearsih environment. So purely looking at a certain stock won’t help.
5 Likes
Short Term Bounce
Nifty may bounce in coming week - everything needs to get heated before it goes down further
A clear 5 wave decline seems to be complete- now it should bounce back a bit.Also hourly MACD has gones into a buy mode.
Here are the confirmation signals for this to happen -
1.Crossing previous swing high of 15400.
2. Crossing /closing abpve the 2-4 down-sliding trend-line and 40 hours average -near 15550
In this case ,it can go up to 15900 -upto wave 4 high in this case.
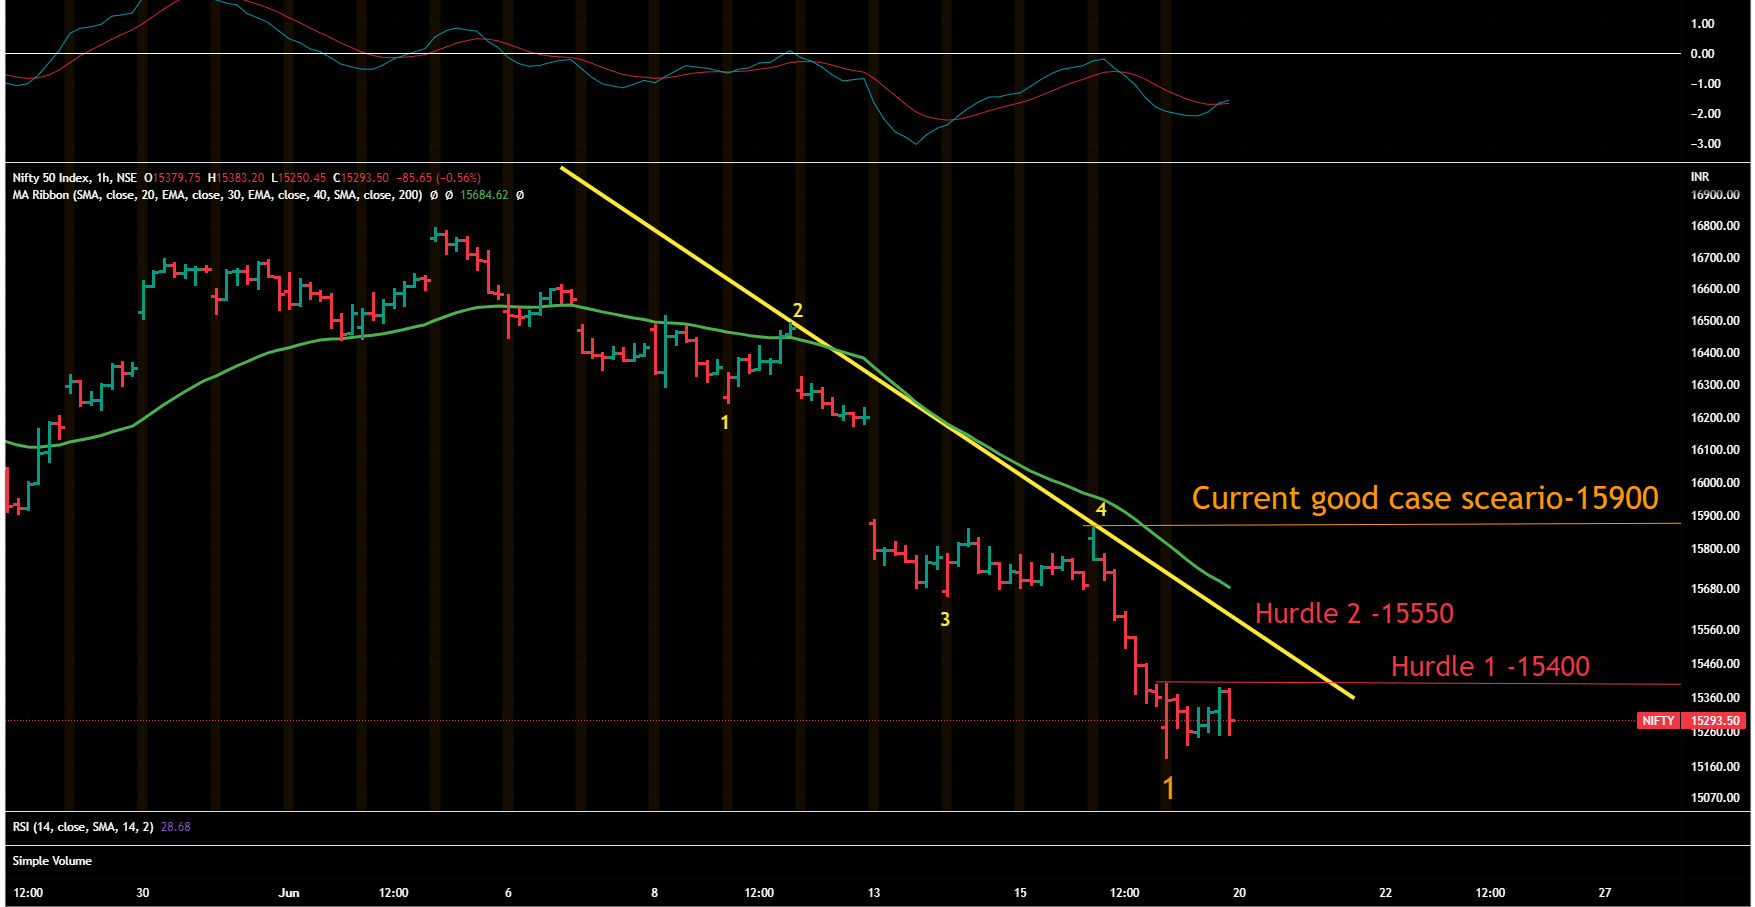
In case, it crosses 15900 , woudl re-look at the chart.
Disclaimer: These are assumptions…can go wrong very badly ( what if 5 leg decline is not complete and MACD buy signal just a whip-saw ?) No recos, ,no suggestions- just for study purpose - how a EW guy makes probable scnarios.
5 Likes
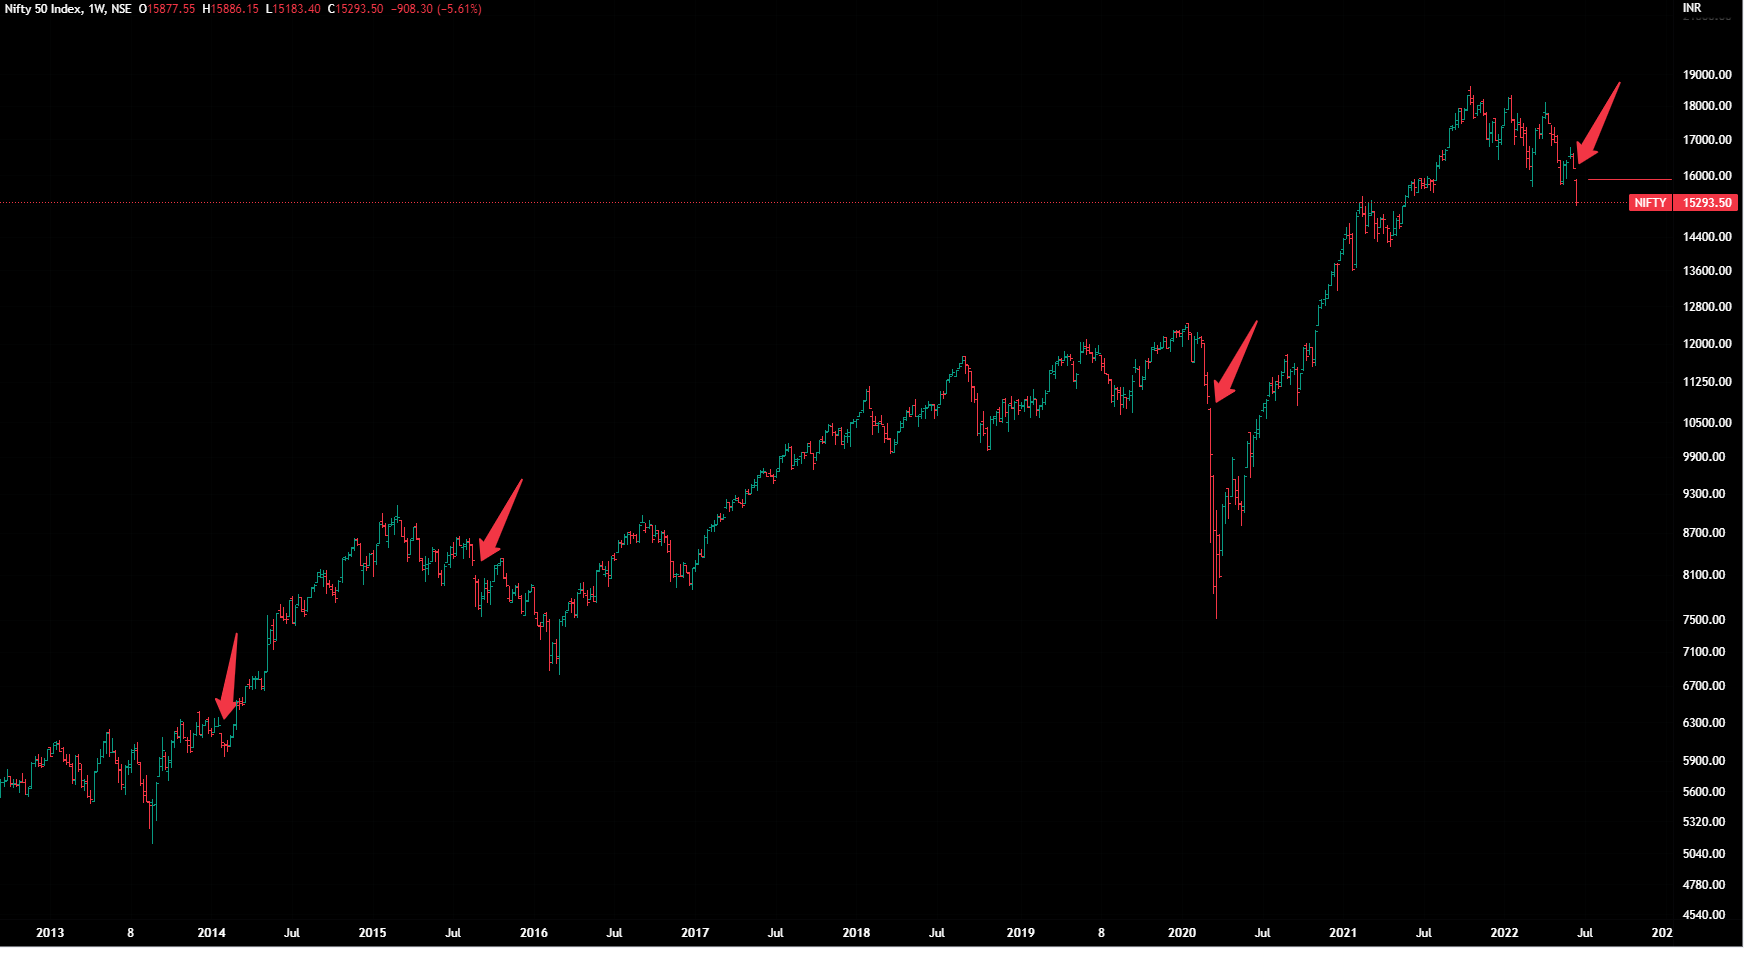
Weekly Gaps In Nifty
Looked at the downward gaps in Nifty in last 8 years.
Every gap is followed at least 3-4 weeks of further downslide.
That also goes well with the above theory of a temprorary bounce…it might bounce ,but might not go up above gap -levels -15900 and then a downslide .
6 Likes