Bitcoin Update/Follow-up
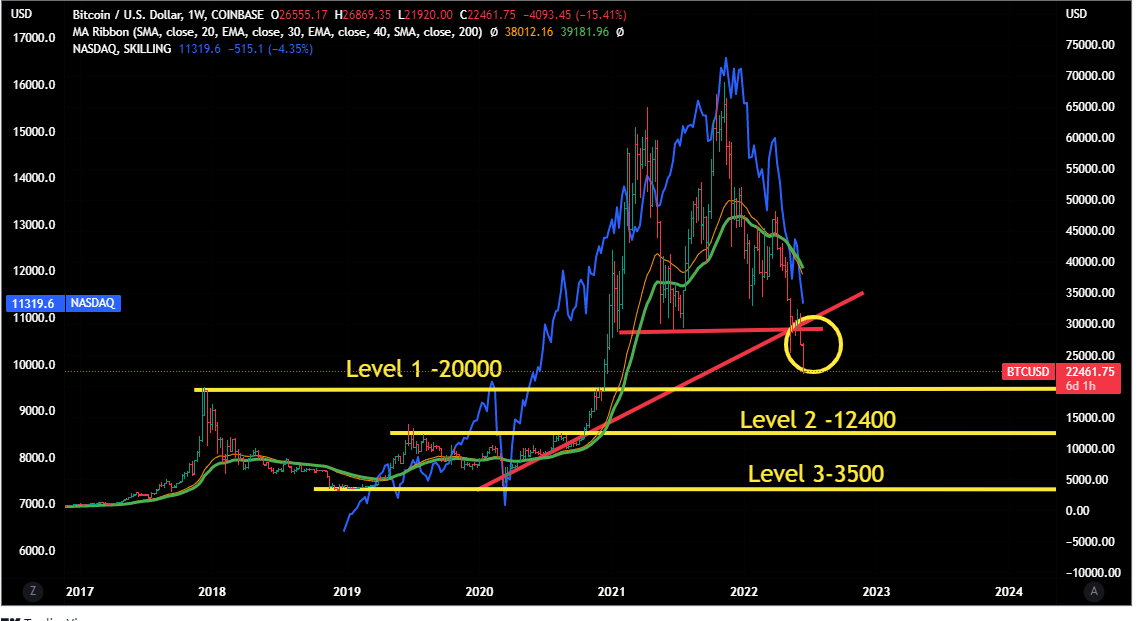
Biitcoin today went below 22000 and broke an important support zone ( pointed out on Sunday)
20000 is a crucial level -if it breaks the same then next targets can be astonisihing.
In short -liquidity is drying very fast.
Bitcoin Update/Follow-up
Biitcoin today went below 22000 and broke an important support zone ( pointed out on Sunday)
20000 is a crucial level -if it breaks the same then next targets can be astonisihing.
In short -liquidity is drying very fast.
JNK -High Yield Bonds
Bonds are a much bigger deal than Bitcoin falling appart.
Bitcoin is still considered as young-people bet , these young people have lot of years ahead, they can learn the lesson and still make earnings and living.
But big losses (in bonds ) like this are hammering pension funds, conservative investors near or at retirement, collateral for loans, etc
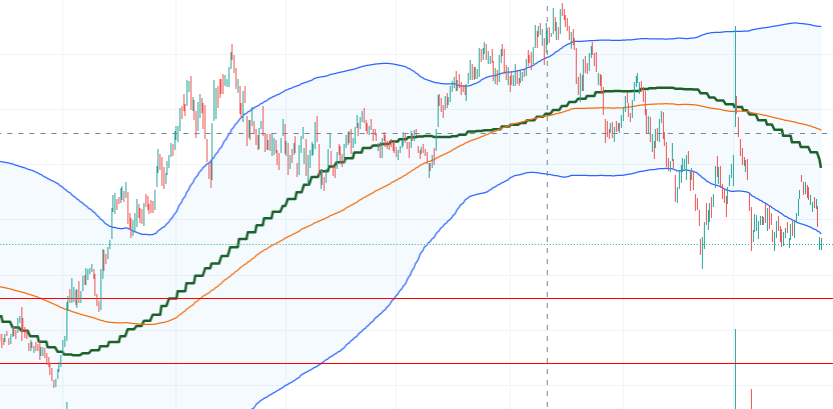
Thanks to @StageInvesting for introducing this concept. Nowadays whichever charts I am seeing ![]() , I am able to see this model applicable for them. Wondering if you can share any charts where Stage4 → Stage 1 signs were visible . Any other concrete indicators we get for this transition other than 2-3 consistent tops and bottoms above 30WMA.
, I am able to see this model applicable for them. Wondering if you can share any charts where Stage4 → Stage 1 signs were visible . Any other concrete indicators we get for this transition other than 2-3 consistent tops and bottoms above 30WMA.
HDFC Ltd seems to be another one which has recently started entered stage 4.
Happy to see that few people are trying to learn.
And that is the whole objective of this thread,
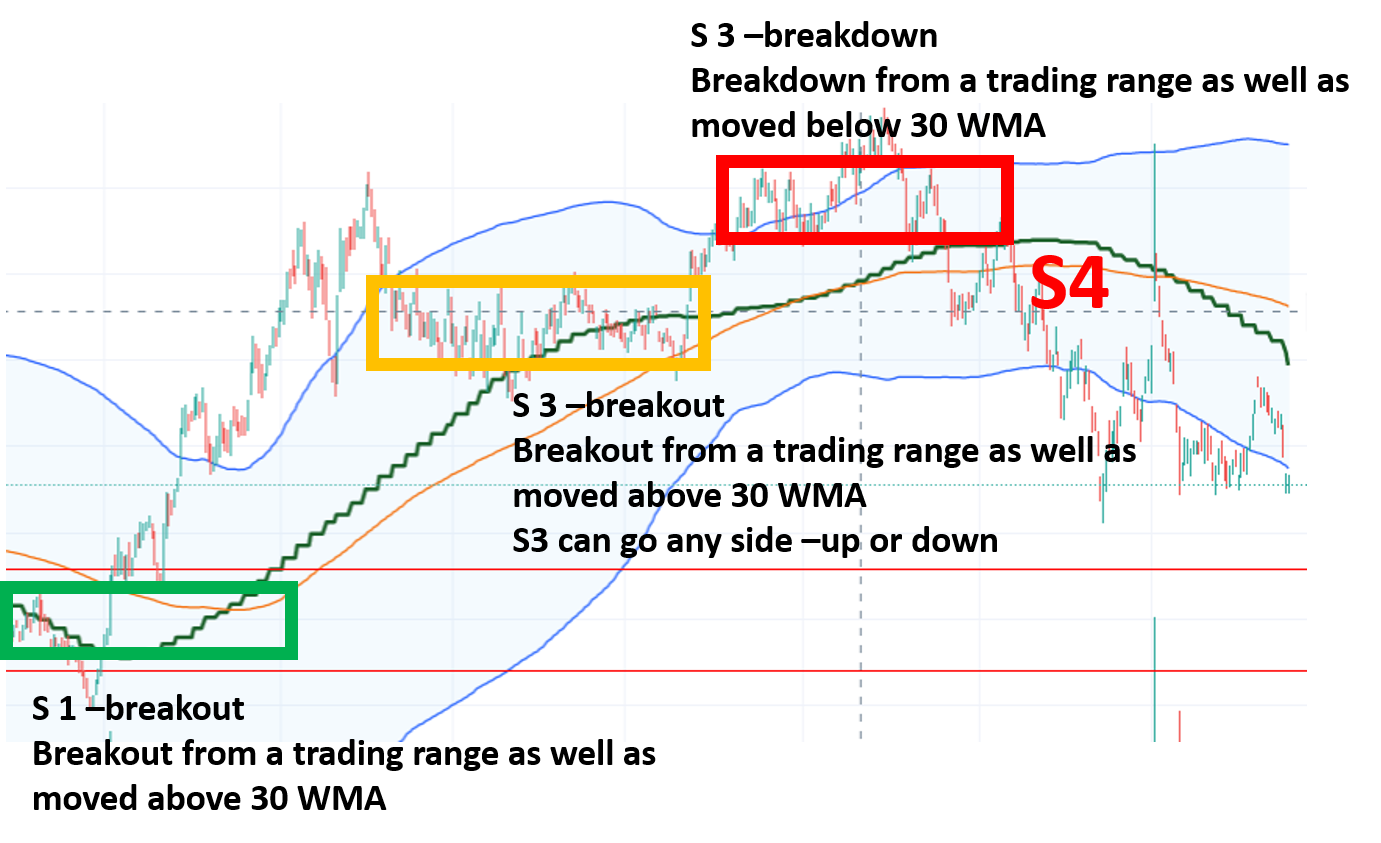
I have clearly marked different STAGES ON YOUR CHART itself …moving above and below 30 WMA, breaking a trading range and upward or downward loop of of 30 WMA are the key points to watch.
BTW HDFC entered in Stage 4 in between 2600-2500 levels (not recently )
Keep in mind that no magic happens below 30 WMA.
Textile Stocks
Antoher favorite sector of recent bull run - tried to asses the situation.
Oveall structure does not look promising in most of the stocks ( keep in mind that stocks of a sector tend to move in a horde with very few exceptions )
(here are few probabilities, keep in mind nothing goes up or down in single straight line - there are ups and downs in every journey - so the following scenarios may take time to play - also we are expecting a counter-trend bounce, a bear market rally in July after 3 months of constant fall - so many of the stocks may bounce back in B waves before plunging deep in C waves)
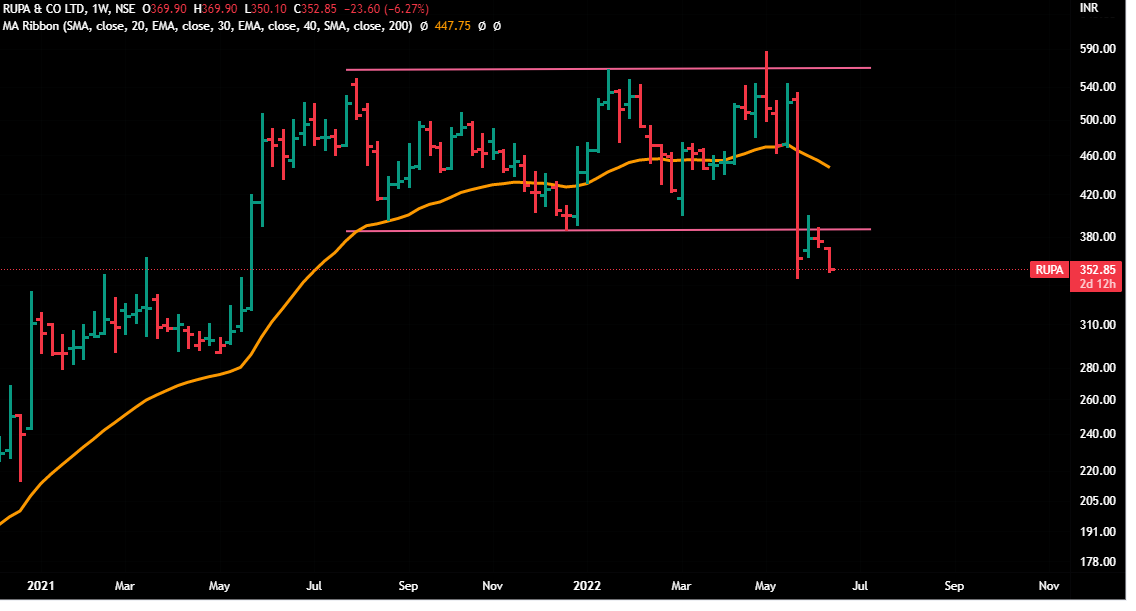
Rupa
A stage 4 stock, given a breakdown from a rectangle ,Currently trading at 40 months moving average ( last and final support)…if it does not stop here , the next support is in between 310-320.
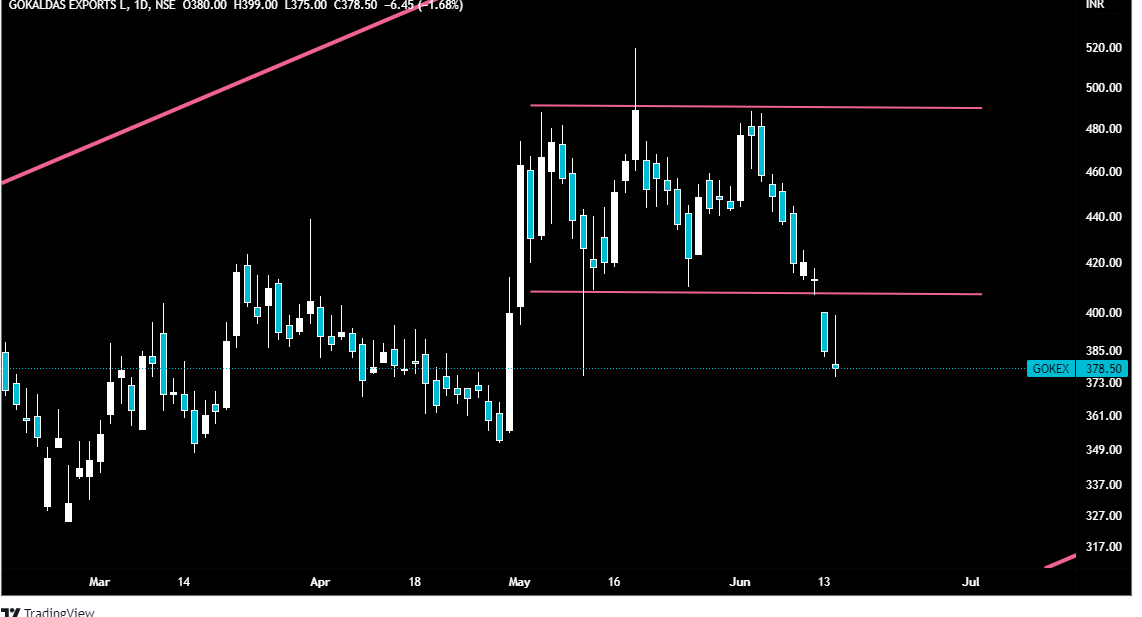
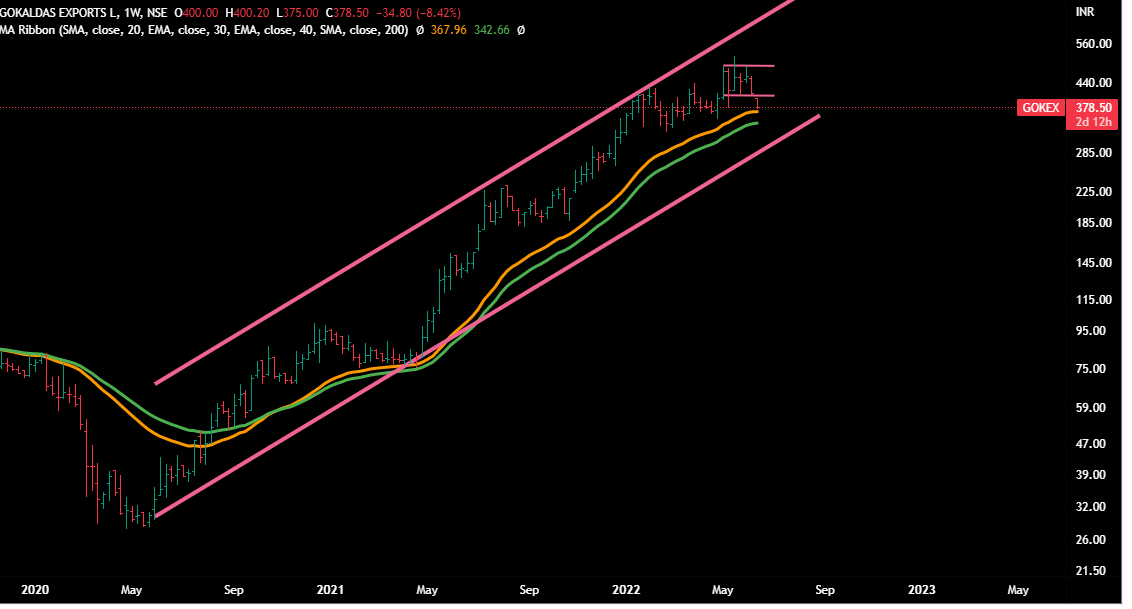
Gokex
A stock forming a base in Stage 3, still at 30 WMA.
But gave a break from the trading range (rectangle ).
If it breaks 30 WMA, next support is at 40 WMA (334) and next near lower line of channel (320)
Daily Chart
Ambica Cotton
A stage 4 stock, has broken an important support . If it does not stop at 1400 ( 40 months moving average ), then minimum ,we might go near 1150 ( important support ,pre covid levels)
And current leg fall is 5 waves fall, either we should end near 1400 . And if we bounce back and start falling back , then bottom is far -far away.
This is the reason that I came into 80 % cash in February as no -one can gauze the bottom.
I rather be wrong in cash than right while holding plunging assets.
With cash secured, I can always get back in.
But with cash gone…I would either be just posting charts or would have to start technicals -training program for earning ![]()
Disclaimer : The above charts are for learning purpose to become a better investor. Many might not work out , so no recos, no suggestions.
Strategy looks good in theory and to implement it successfully in market cycles requires immense experience, character and execution.
I think you are very experienced in markets. Can you pls share your experience in market so far and how much cagr you are able to generate over market cycles like 10-15 years using this sell 80% and buy near bottom strategy?
Also how much contribution to Cagr is via the shorting that you do?
I appreciate your conviction in what you are doing and your own investing strategy…thanks
Well very good question.
Let me give you a simple answer ![]()
a) Yes I am an experienced investor. Investing for last 15 years.
b) I was purely a fundamental investor till 2008 - buy and hold type - then lost huge profits as well as capital in 2008 falls. And wondered whthere there can be a more scientific method to invest/exit. Because buying on guts/ news.stories was not a happy and peaceful experience . When you’ve position you’re stressed and when you don’t have a position you’re full of anxiety.
So thought of finding a method where my system can point me towards buy and sell decisions . A method that is devoid of emotions. Hence came across EW and Stage Based investing.
c) Coming to 80 % cash is 1st time experience for me. In 2018, I came into 50% cash when market started falling. In 2018, i was like evryone else , believing in fundamentals and stories about the companies I liked, had fell in love with those companies - but when they corrected badly , I realised that no story, no hypothesis is permanent ( In 2018 , I lost huge profits in Avanti Feeds, Bandhan Bank, IDFC First Bank etc as I kept my faith on the companies but they kept falling ,eroding my hard earned profits) .
At that time i decided that I would not stay in those companies where my system is giving an exit signal . Current 20 % investment is also based on system.
d) MY CAGR is close to 35% for last 6 years. But I don’t consider it permamnent as last 2 years were quite unusual and I has extra cash that was employed in COVID falls. So the calculation of CAGR becomes very complex. I am happy with 25% CAGR ( very long and not so pragmatic ask , but let’s see )
e) Shorting- I only use 10% iof my capital in shorting. As these are leveraged positions, so don’t wat to stretch too much. This is my 2nd experience of shorting in futures after 2018. In first instance, i was just testing waters. (Btw i did not short anything between April 2020 till Feb 2022 as I was on bullish side- tend to remain on one side, it does not cnfuse the brain)
In summary- I want to avoid emotions in investing as any business where emotions get involved ,gets murky. Hence have been working on a system ( constantly improving) where buy/sell calls can be methodical.
(Writing this thread is also part of my own learning -progress)
Not a perfect answer, but hope it answered few of your queries.
I think it was a very well explained answer. Thanks for the practical details as it helped understand your perspective better and how and why the strategy evolved. I started investing just after 2008 fall so have not seen a long bear market so far (2020 was short and so was 2018 … 2018 was more like stock specific bear)… Therefore the brutality of long bear for buy and hold players can only be half understood by me…
Just one thought, the stocks which you mentioned caused immense pain to you in 2008 as a buy and hold investor do not look like market leader structural stocks…had you been holding them, still would have felt same?
Btw many structural leaders also brutally fell in 2008 but have emerged much much stronger since then over next decade…
Would be good to know your perspective on such stocks as well …
Recently learning stage analysis. Tried this for few stocks
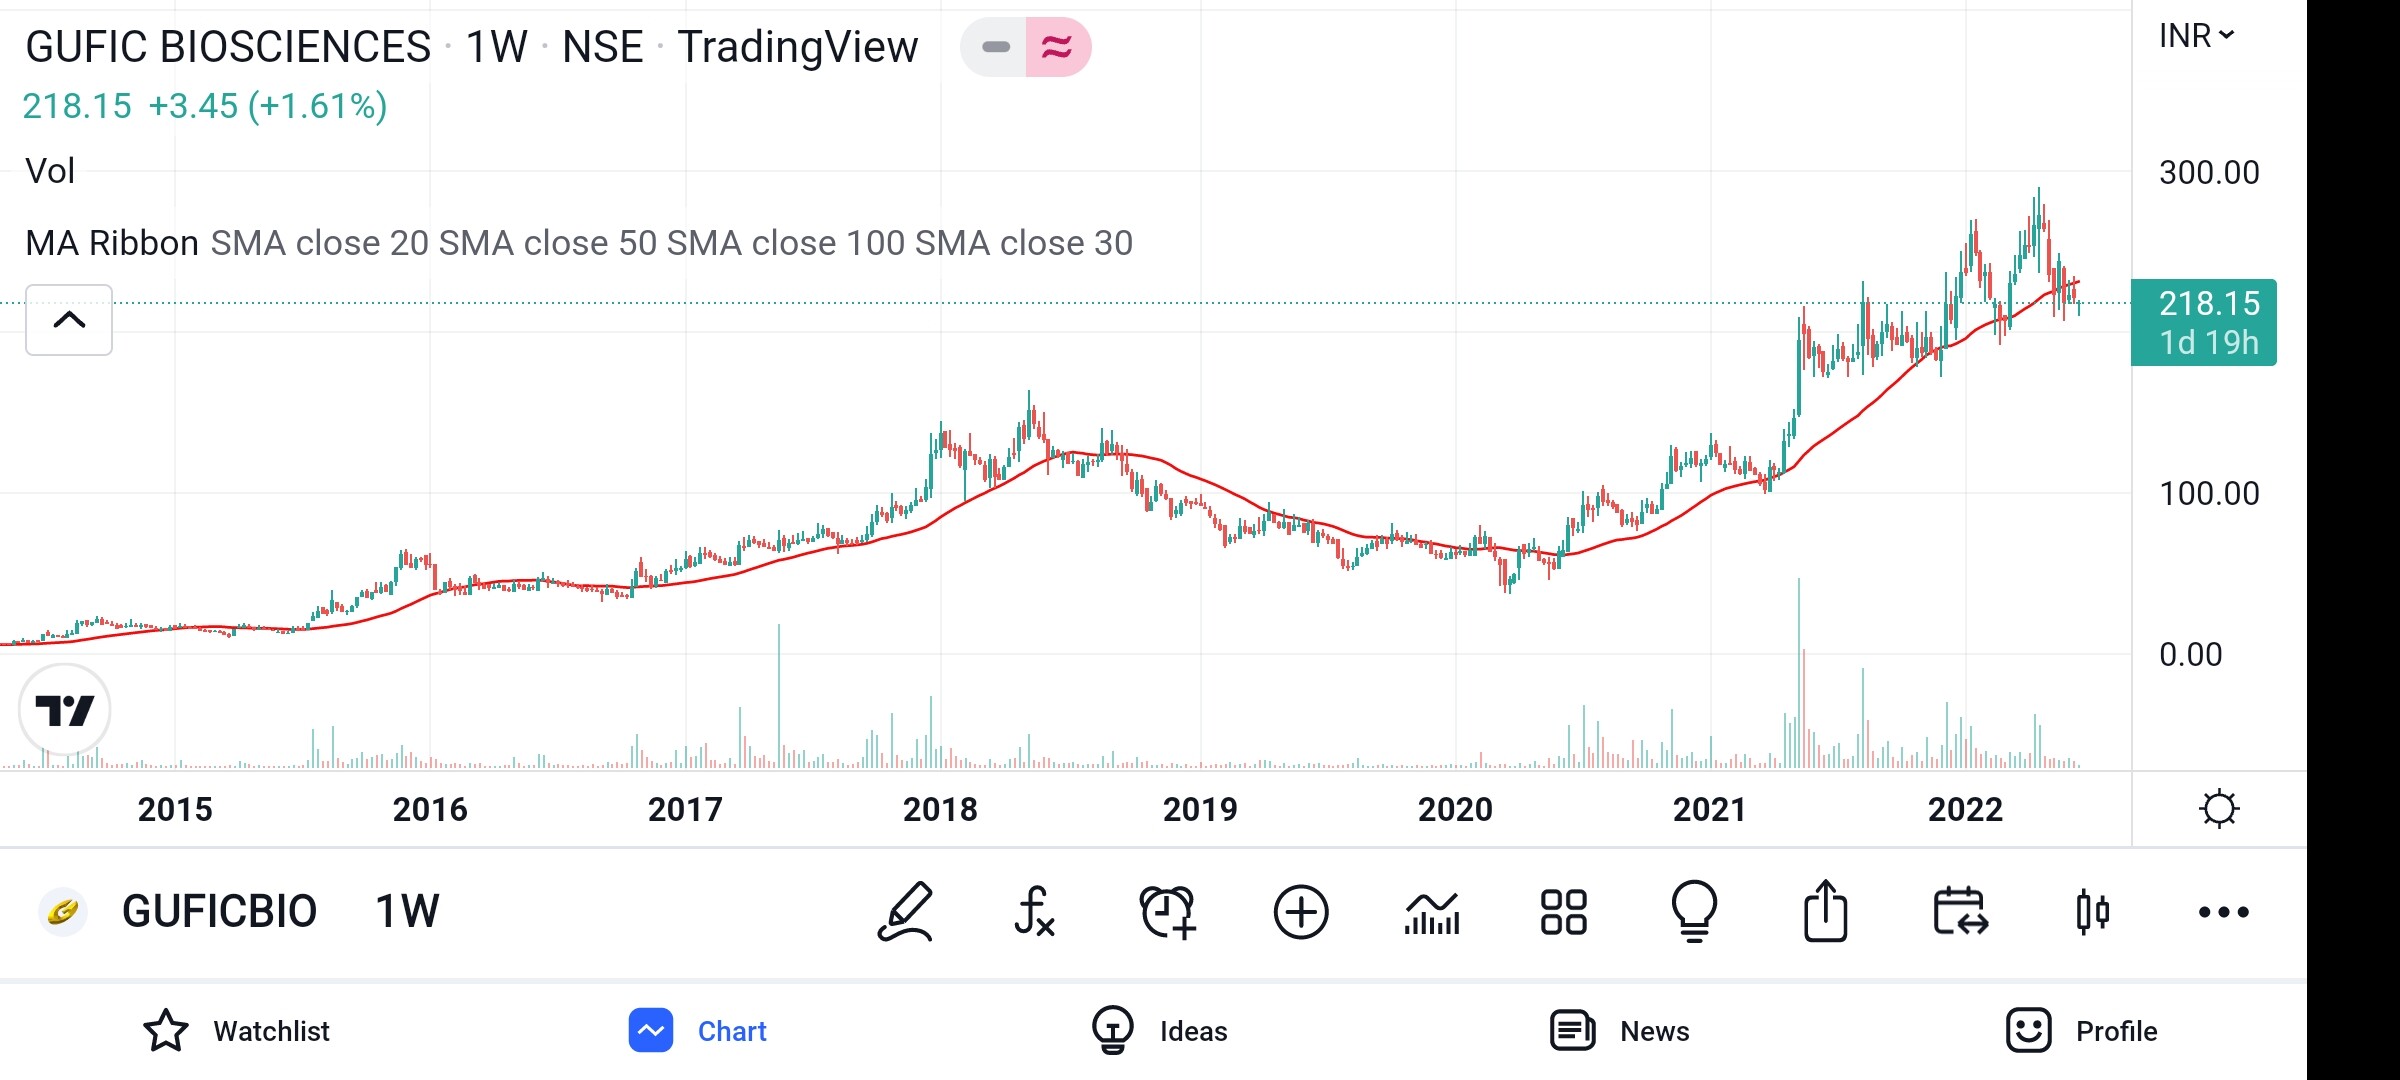
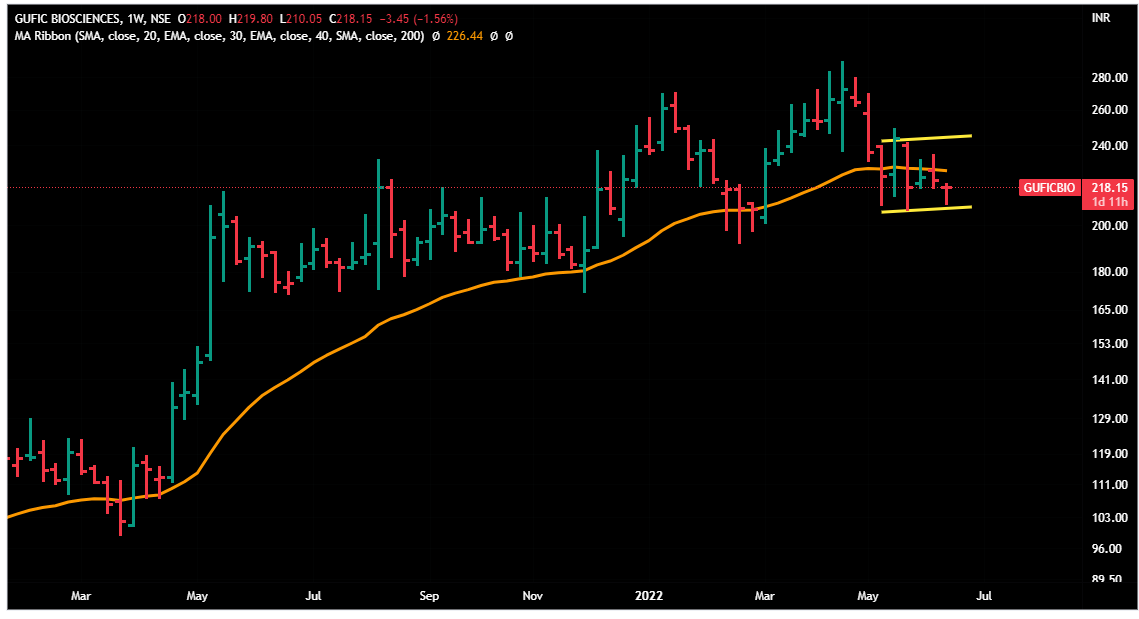
gufic bio seems to be still in stage 2
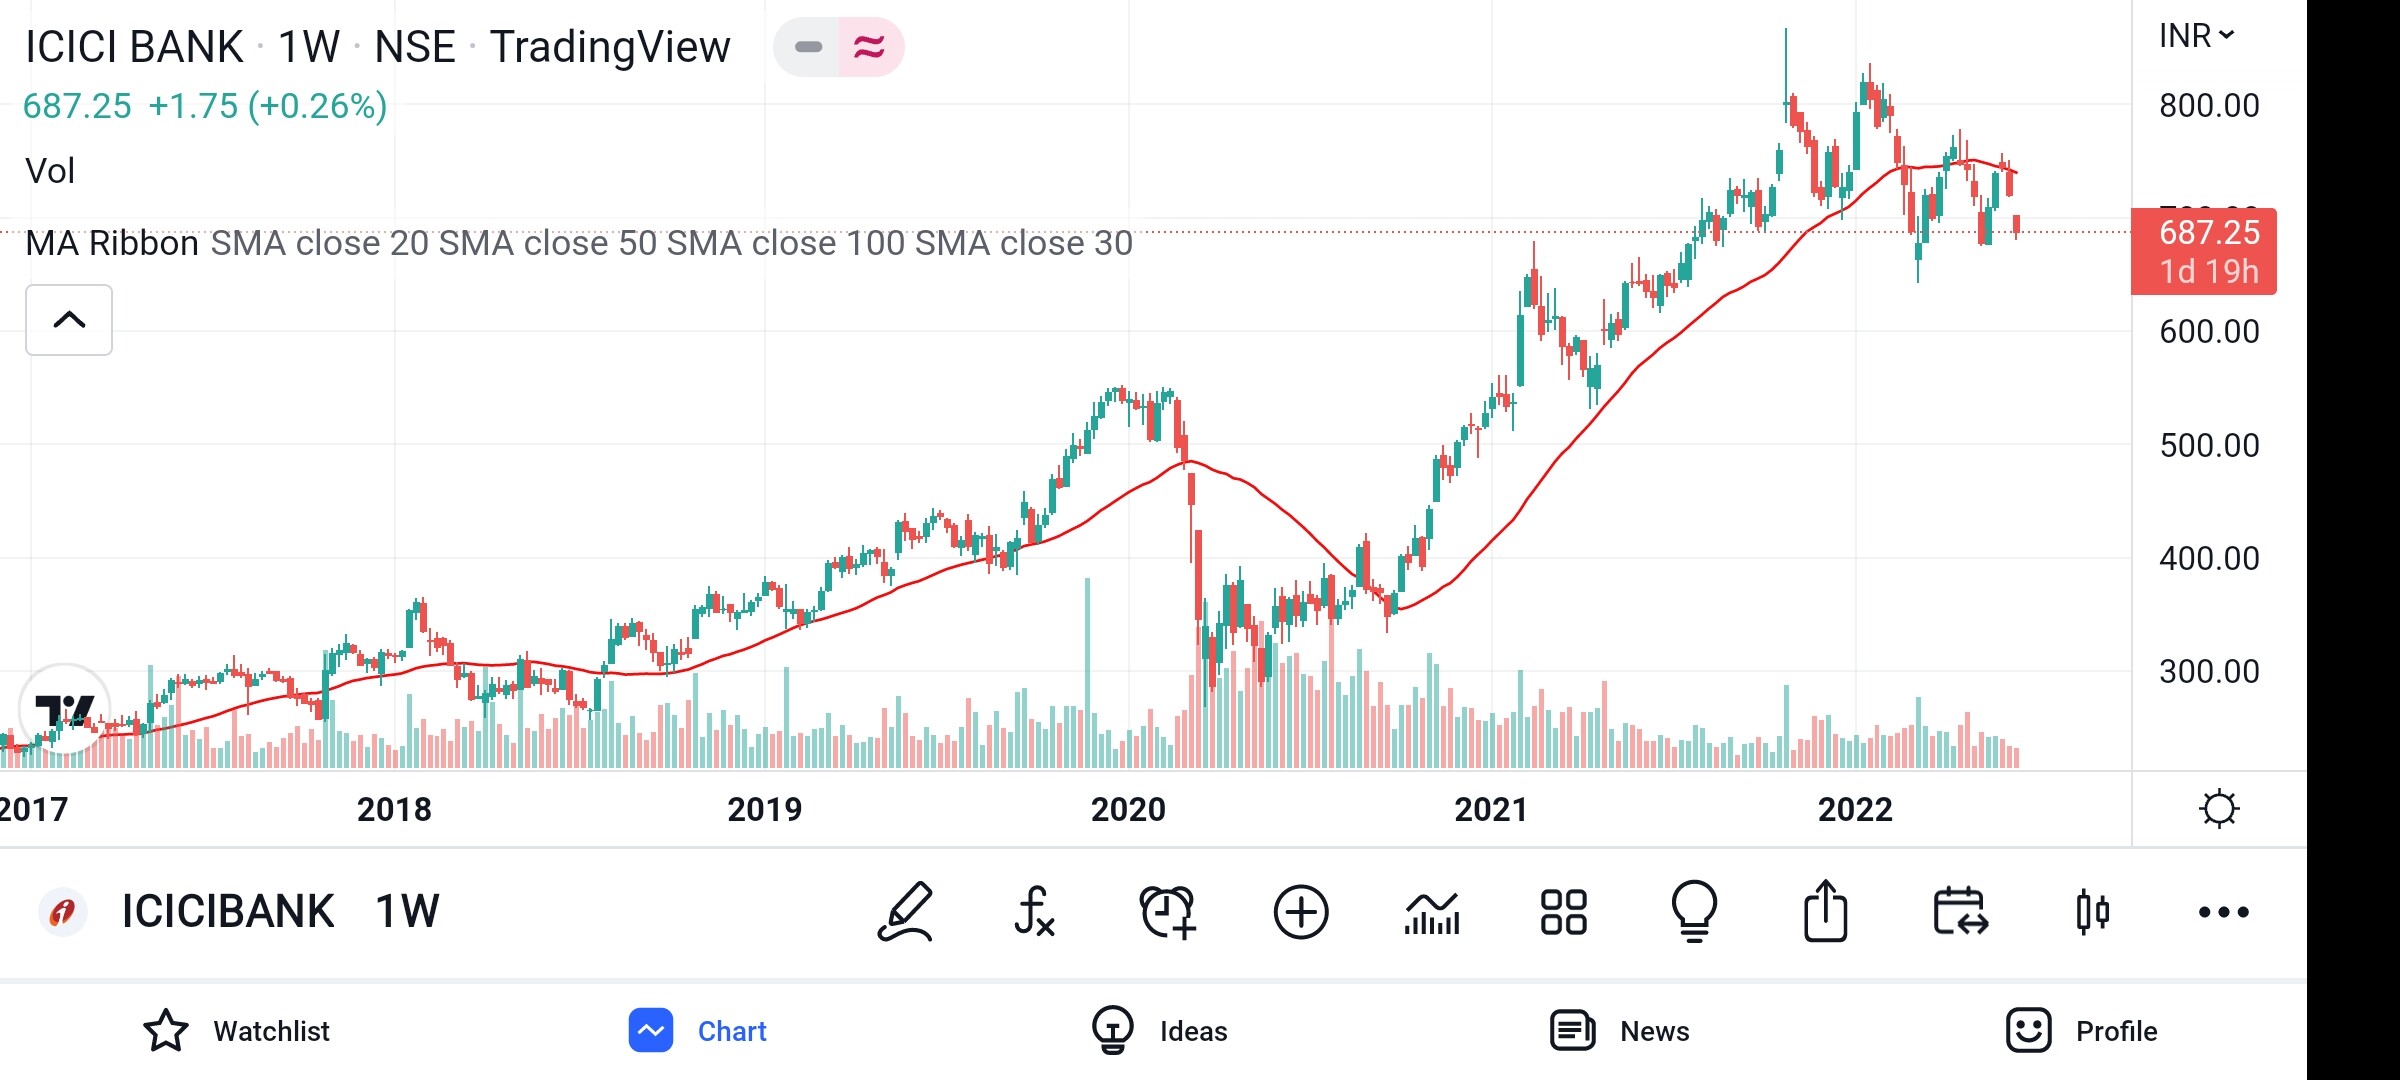
Icici bank seems to be doing stage 3
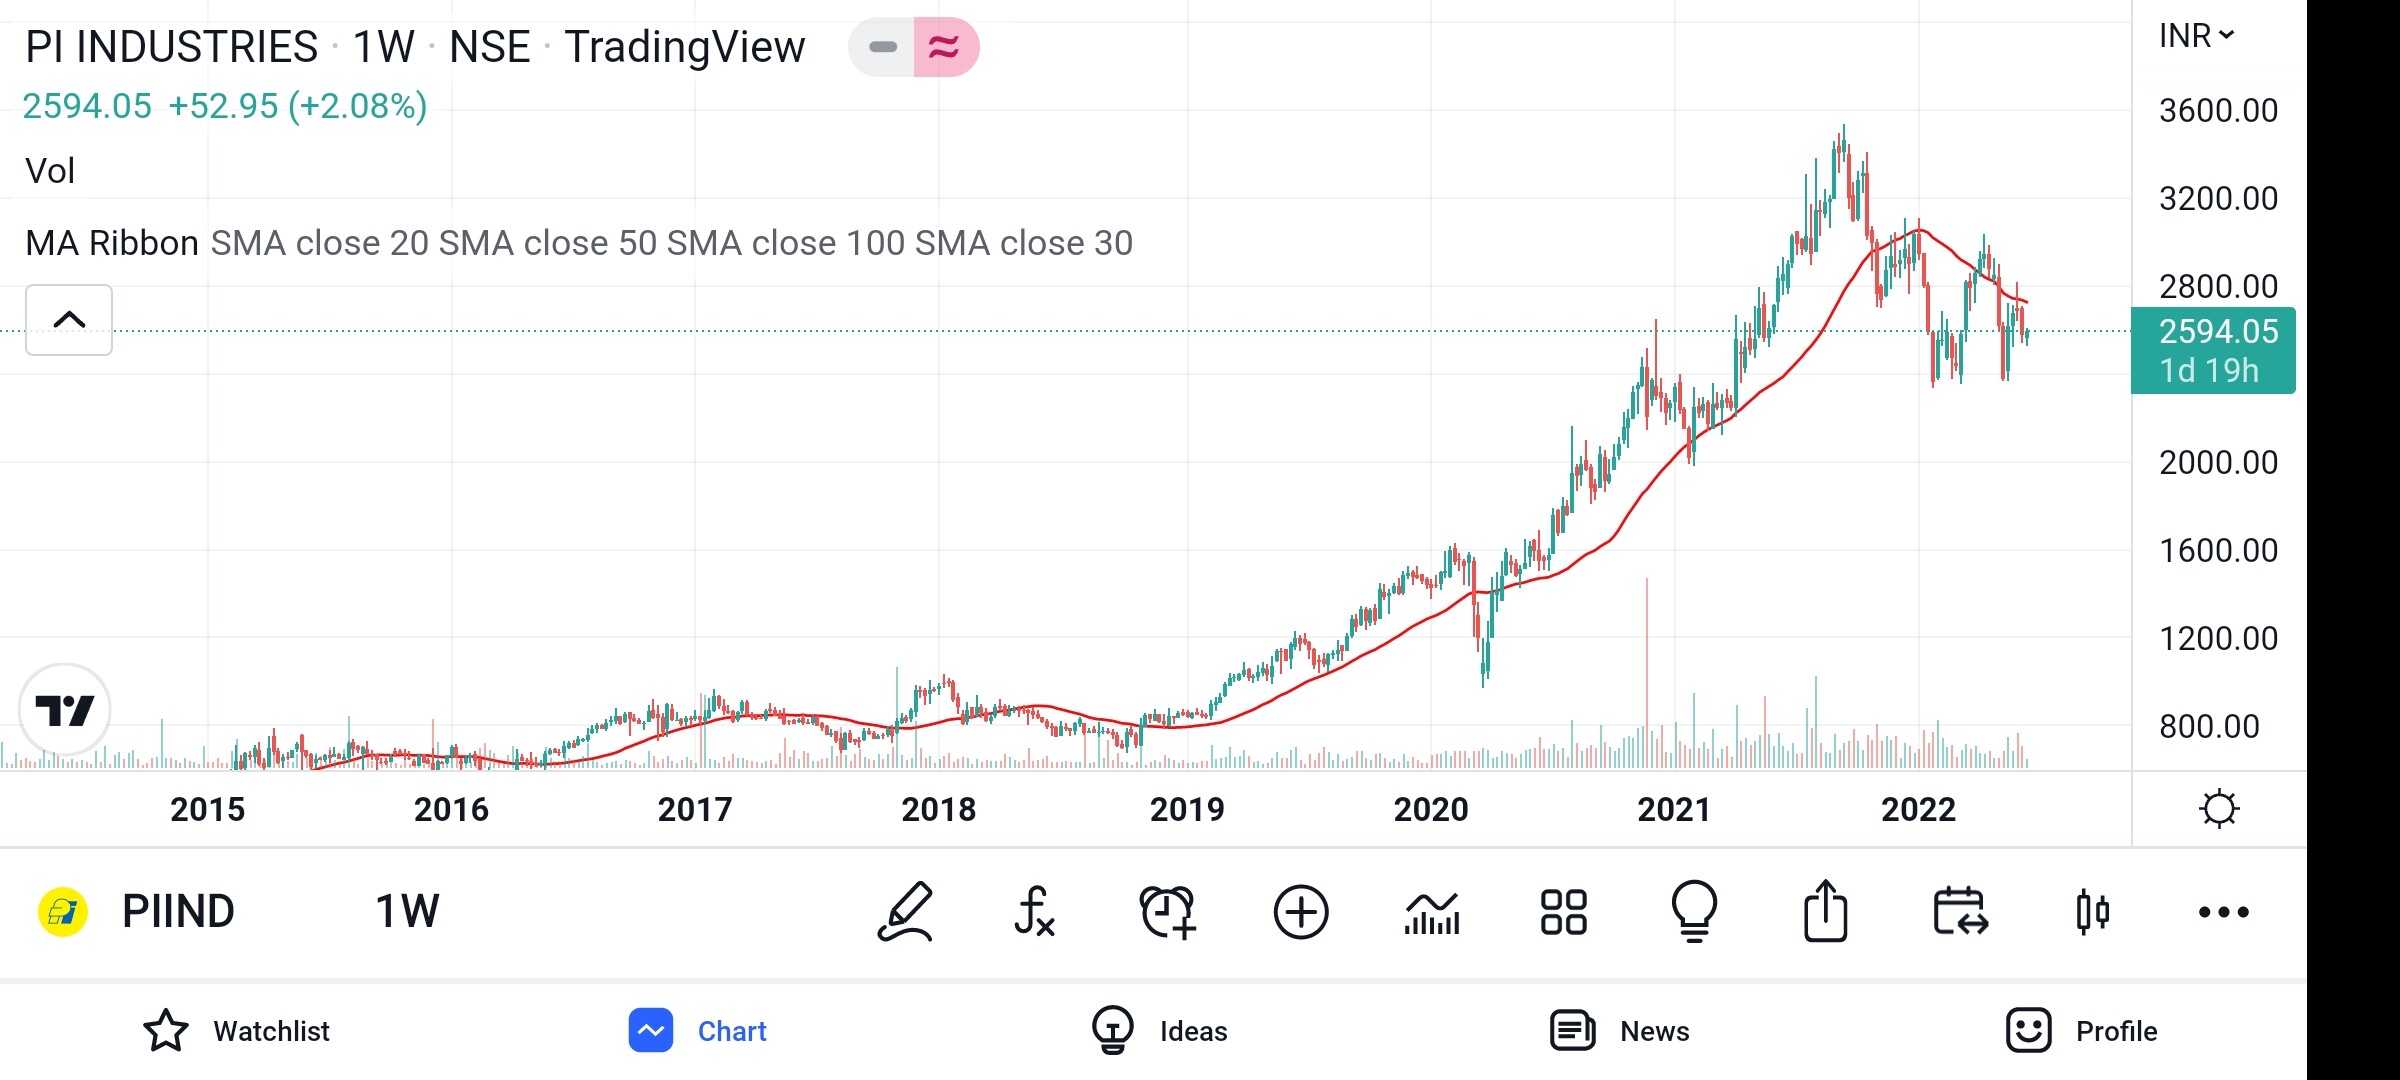
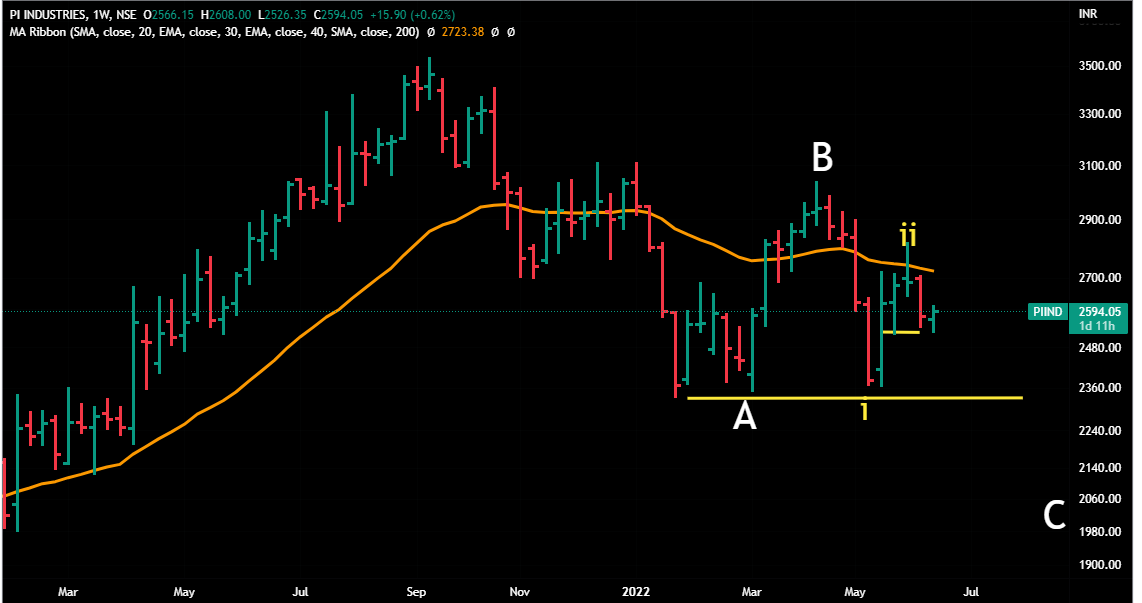
Pi industries seems to be entering stage 4
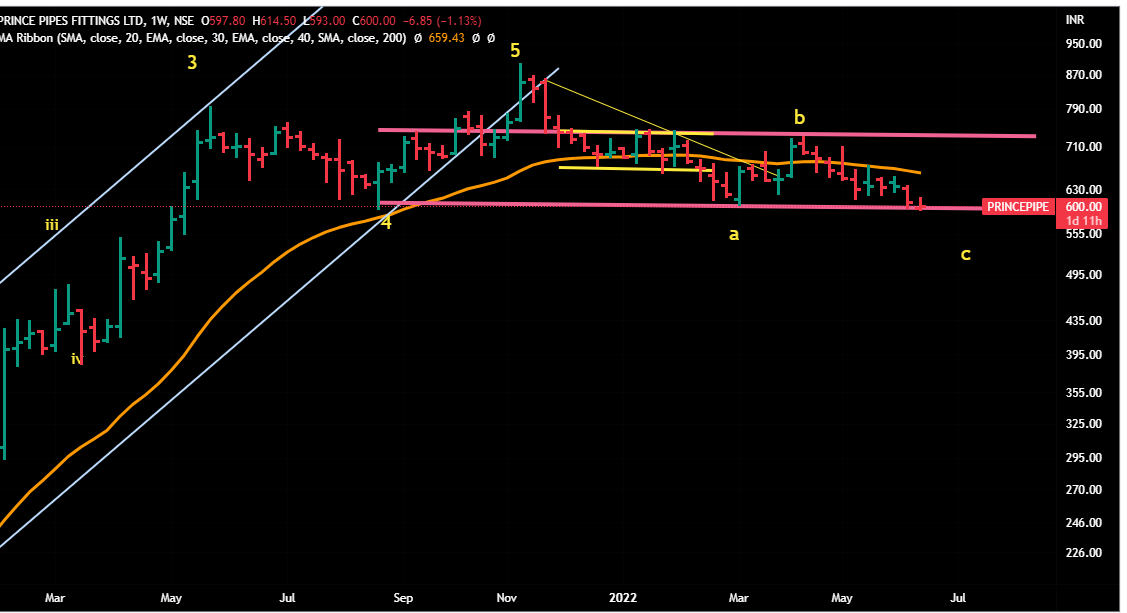
Prince pipe entering stage 4
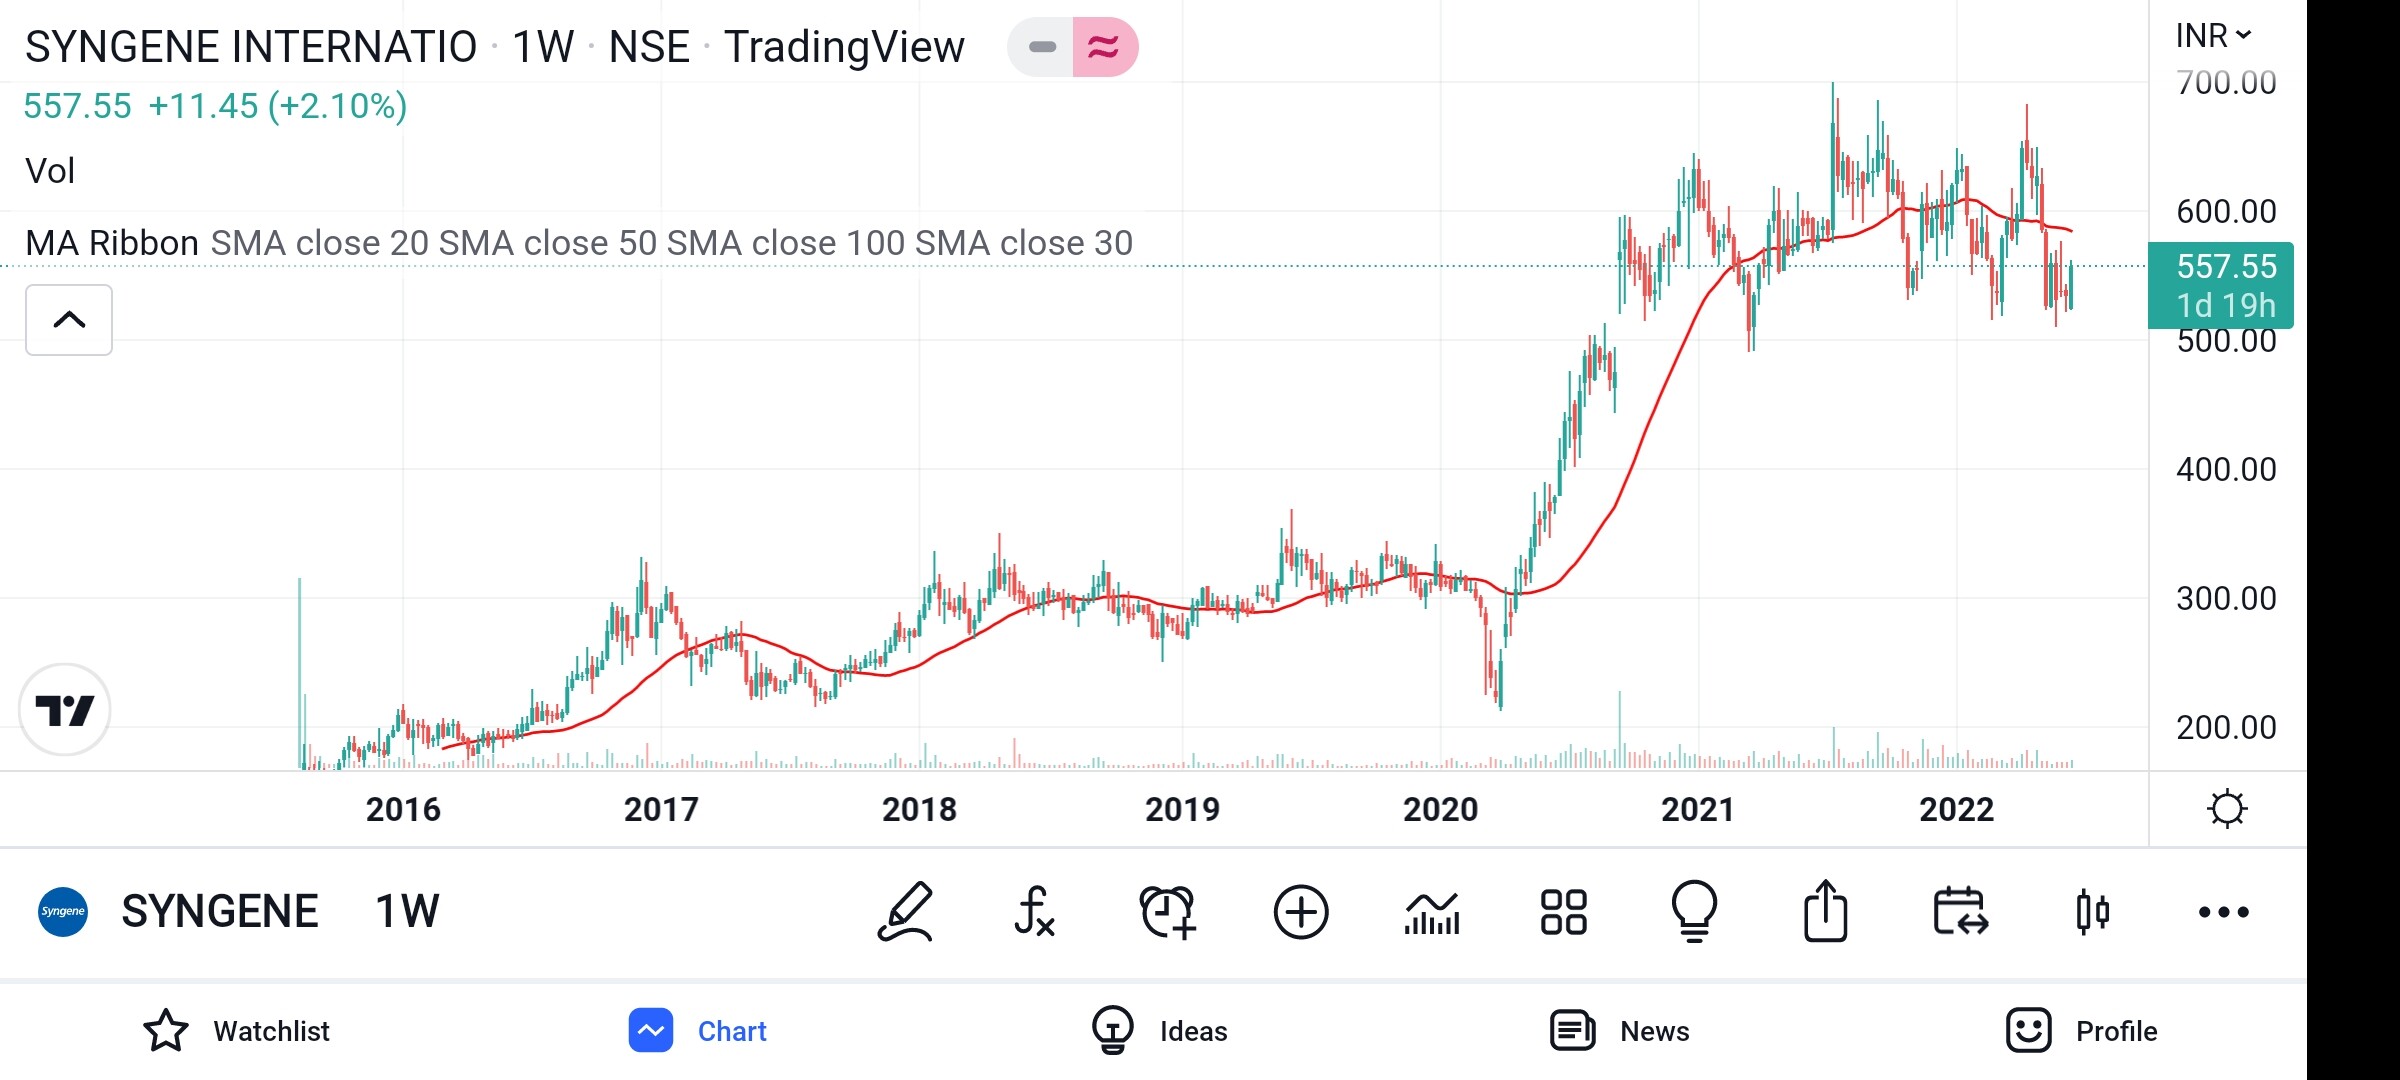
Syngene taken support at stage 3 box
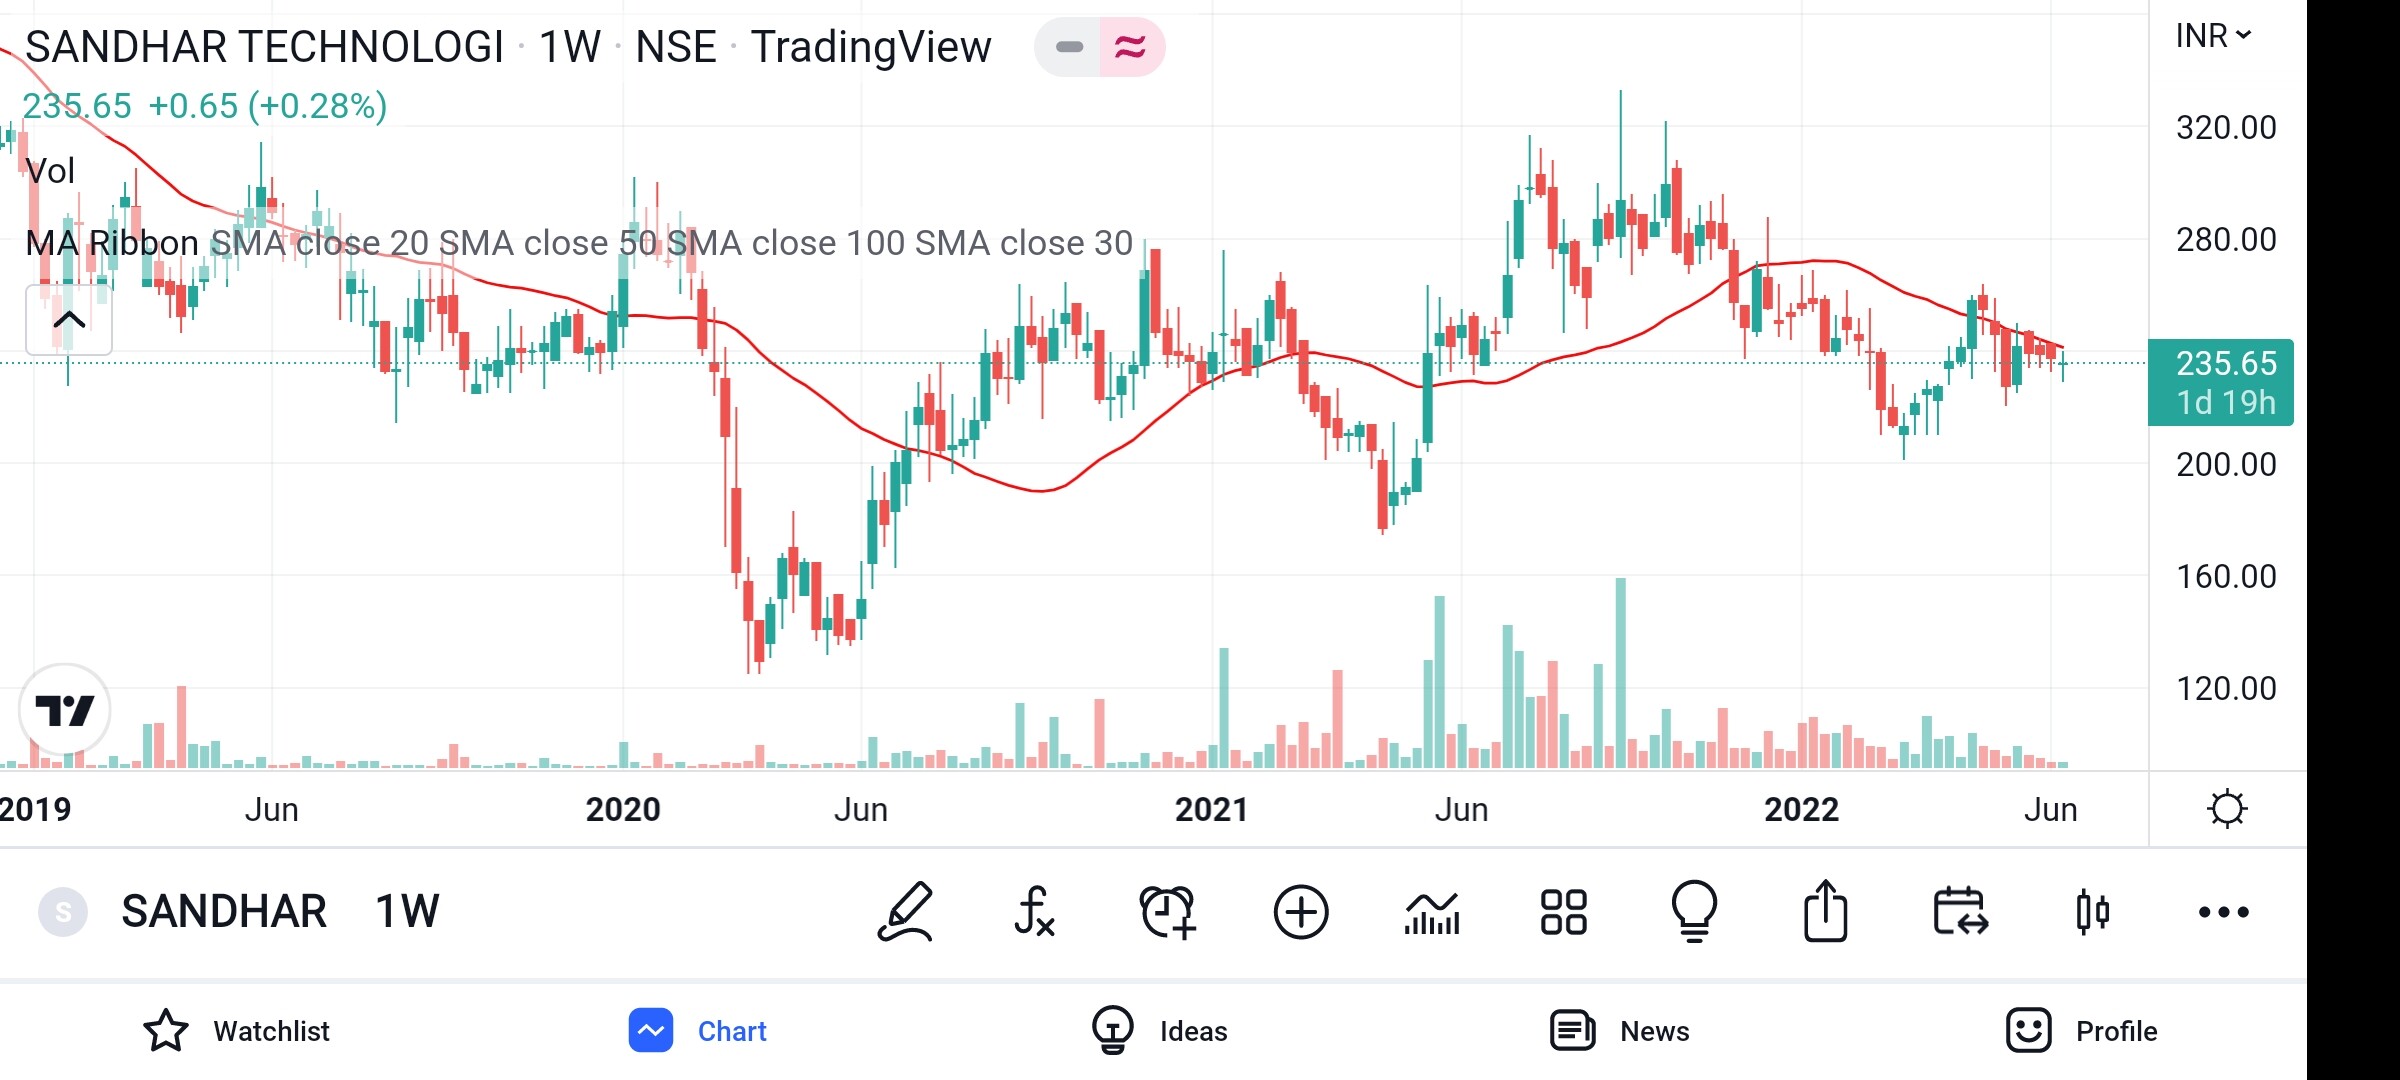
Sandhar at stage 1 box for long time
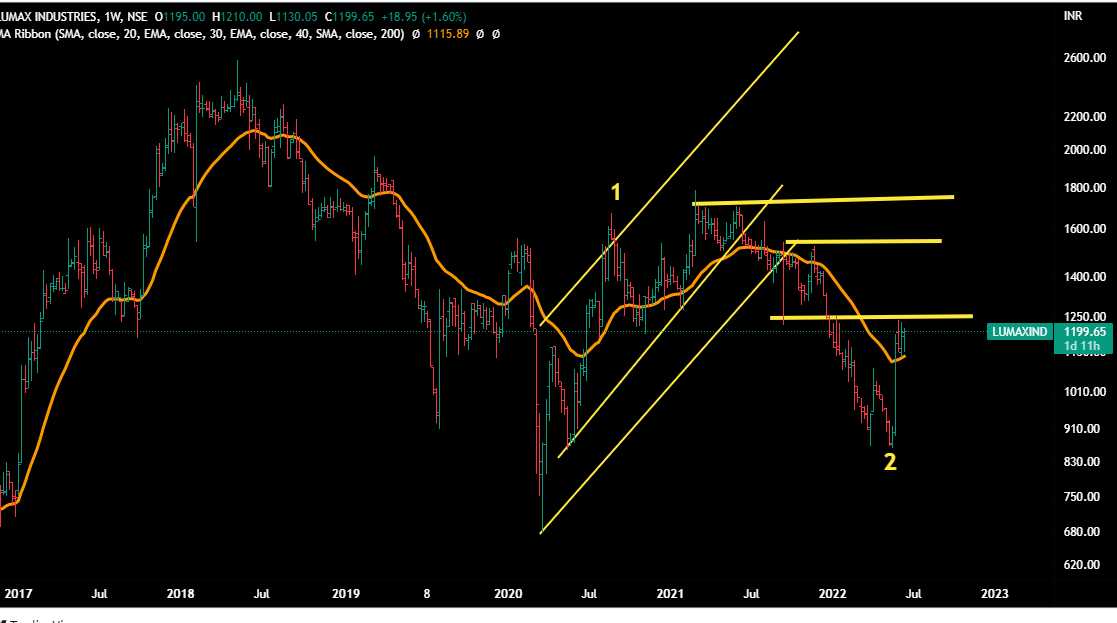
lumax trying to enter stage 2?
Thank you for your help. This is very interesting inspite of good fundamentals stocks fall maybe because of overvaluation or many reasons. But the charts all are looking more or less same. I’ll try to find companies with good fundamentals and are in stage 2. thank you for teaching this!!
You can add few like HFCL and ACRYSIL going into stage 3
Whatever companies I posted about all with good fundamentals and with earnings growth potential with decent valuation (apparently). Just trying to see the technical aspects.
Actual don’t know much about recent fundamentals. stock seems like entering stage 4 straight away.
@StageInvesting trying to apply recent learnings. can you please comment upon my observations. thank you
I am more of small & mid-cap investor as I belive that multibagger returns can only be made via emerging businesses ( can happen in large caps , but rarely) . So for me those are also buy & hold till the time my system asks me to exit ( in more believable stocks I follow 40 months average rule rather than 30 WMA )
As far as market structural leaders are concerend,this method (Stage Analysis+EW ) is neutral wrt size,structure or history of the company , hence can be used on any of the stocks only exception is very thinly traded stocks. (I try to short the large caps in most of the cases as liquidity is there although the size of the fall is limited.
Gufic Bio
It is clearly in Stage 3/4 -closing below 30 WMA for last few weeks confirms that …although in trading range (and a pin-bar is under formation this week that may take it to 30 WMA again) but no-where it is in Stage 2.
ICICI Bank
It is a stage 4 stock - broke the trading range long back ( try to check the trading ranges above 30 WMA. The 30 WMA curve is flattening/looping down.
PI Industries
It entered Stage 4 long time back (Oct 21, near 2900) - when it closed below 30 WMA and 30 WMA curve was looping downwards. It tried to come back but the curve was still downward slopping .
If it closes below the yellow line, we might see it going below 2000.
Prince Pipe
It entered Stage 4 when it broke the yellow trading range near 660 in February 22. It tried to come up but the 30 WMA was sloping downwards.
And when it tried to bounce, it could not cross the previous trading range ( outlined in pink, near point b ). Now if it cracks the pink line on downside (most probably it should), then we might go near to 500 in C wave.
You are right - it is not giving any clear signals even from Eliiot Waves prespective.
Lumax Industry
It is a good chart to learn entry in a Stage 2 stock.
It should alays be staggered manner.
For a successful upmove - first the market should be positive ,then sector should be positive ( negative on both fronts)
Positives on this chart -
A) It has gone above the 30 WMA
B) 30 WMA curve has moved upwards
Negatives
If I have to make entry- I would make first entry after it closes above on weekend above 1250 ( the first resistence)- would exit if it again comes down below 30 WMA.
2nd entry if it crosses 1530 ,3rd and major entry after it closes above (on weekend) previous ATH near 1750