
Herd action is among retailers. Big money has the pro-active action.They sell at high prices by creating euphoria and retail is left behind holding the bag.
2 Likes
Macros
We are used to invest based on quadrant
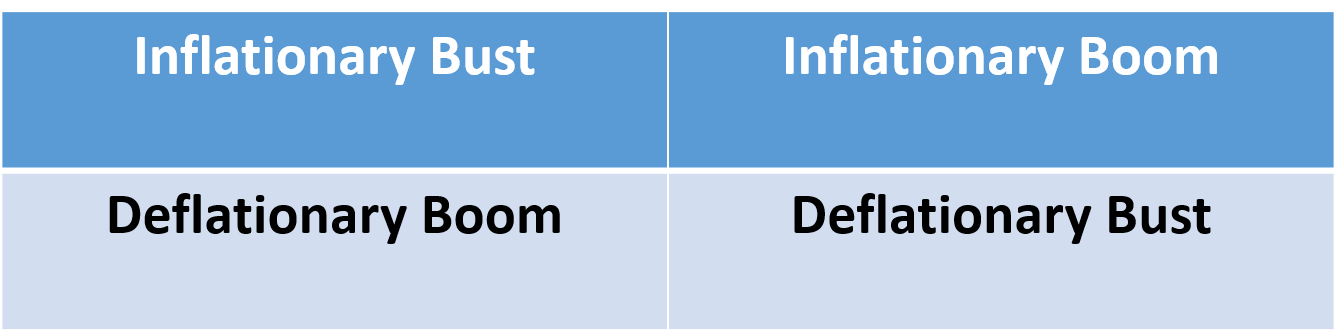
But current picture is confusing, the follwoing tweet pretty much sums up the market environment for investors as of today.
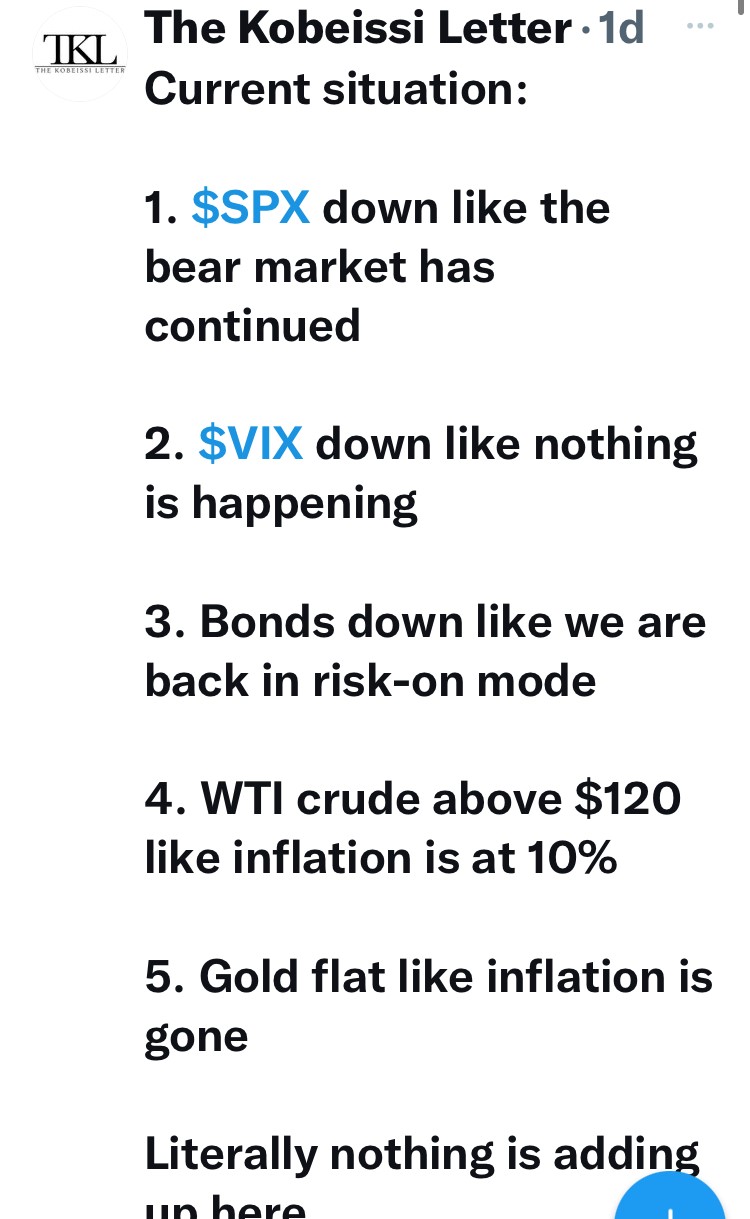
The market is showing all the four quadrants at the same time. ![]()
We’re yet to see the negativity at the peak, selling climaxes , huge volumes on down days !
We’re just in opposite scenario ![]() Huge inflows continuing in MFs . Lot of talks on social media on how XYZ company would become mutibagger . WhatsApp groups still buzzing with new tips.
Huge inflows continuing in MFs . Lot of talks on social media on how XYZ company would become mutibagger . WhatsApp groups still buzzing with new tips.
Investors are yet to understand what is happening around them.Recent bull run and recency bias keeping everyone hopeful.
Real bear markets work like this…slow bleeding, keeping everyone hopeful.
Unlike the sudden falls and quick recoveries of black-swan events.
So far, it’s just taking away all of the gains of recent upmoves.
But let’s be careful ,wealth/demand destruction gets real when it bites into the principal.
Selling accelerates when it starts hurting.
Past history suggests that when previous bull-market leaders start correcting, that should be considered as a sign of the start of the bear market.
Let’s look at the leaders of last 10 years bull run in US .
Year-to-Date Performance:
5 Likes
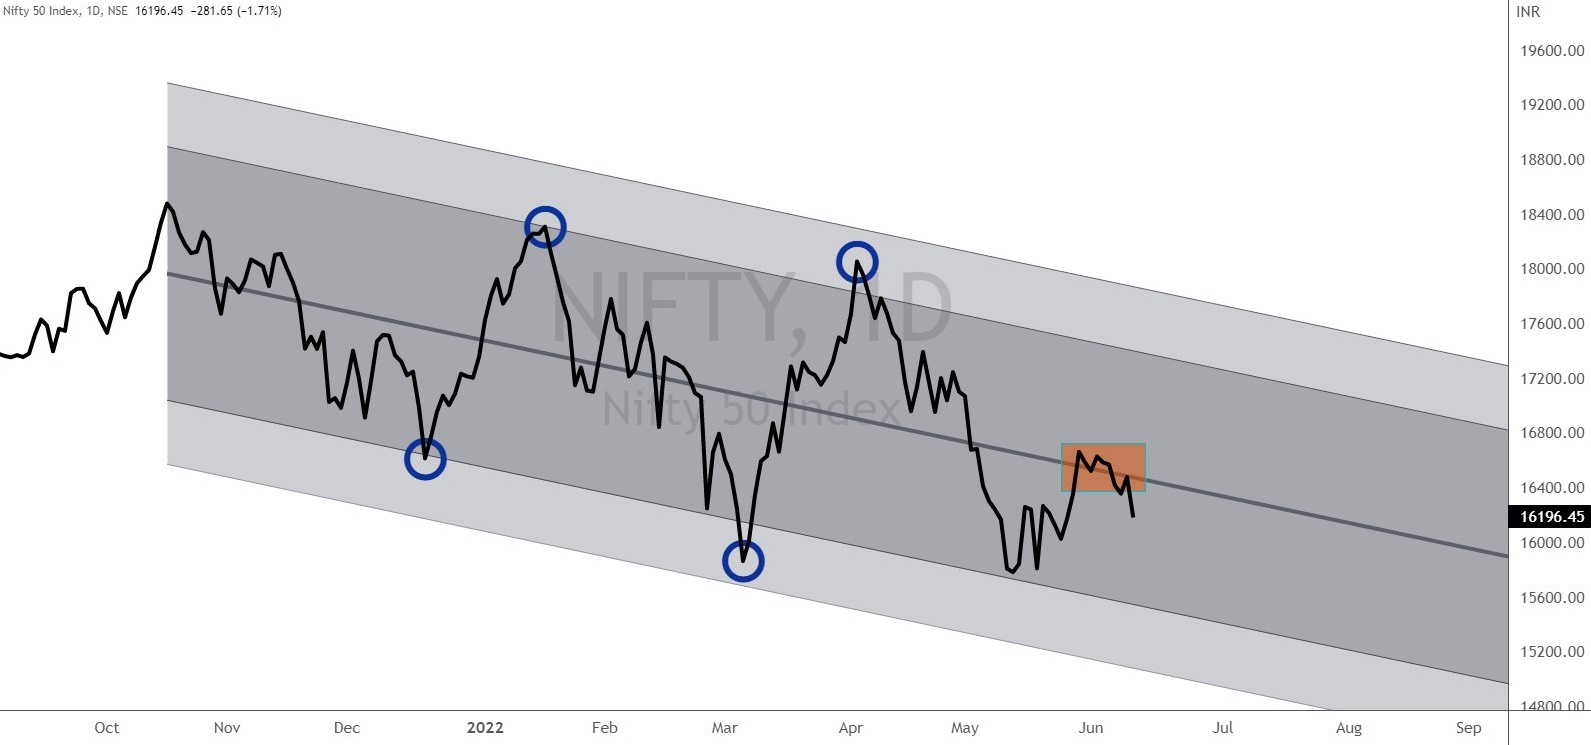
Indian Markets -macros
Weekly action suggests that we are ready go down another 7-8 % in index levels in coming weeks and months.
Regression channel giving a negative indication on weekly charts.
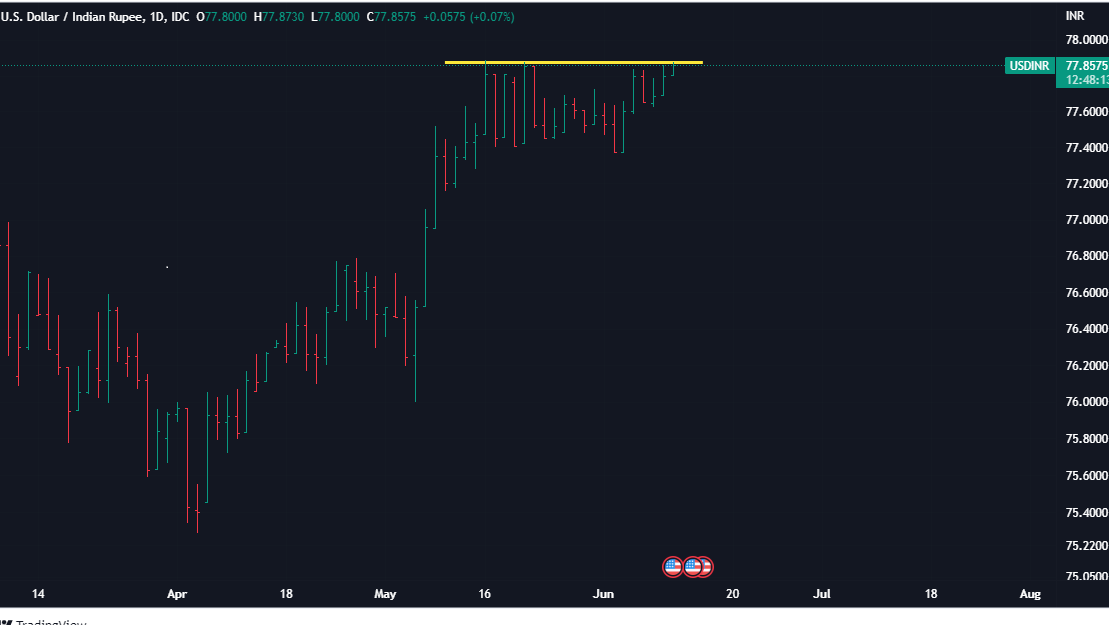
USD INR
Ready to break its all time high.
India Govt 10 Year Bond Yield - Near break-out point
A bullish candle on weekly charts

In summary -time to be cautious.
2 Likes
@StageInvesting Can you please share your views on Embassy REIT. As It’s been slowly constantly
moving upward even in this volatile market.
DXY -The Biggest Villain Among Various Macros
The market is never properly hedged.
The DOLLAR is what ultimately ends up CRUSHING everything
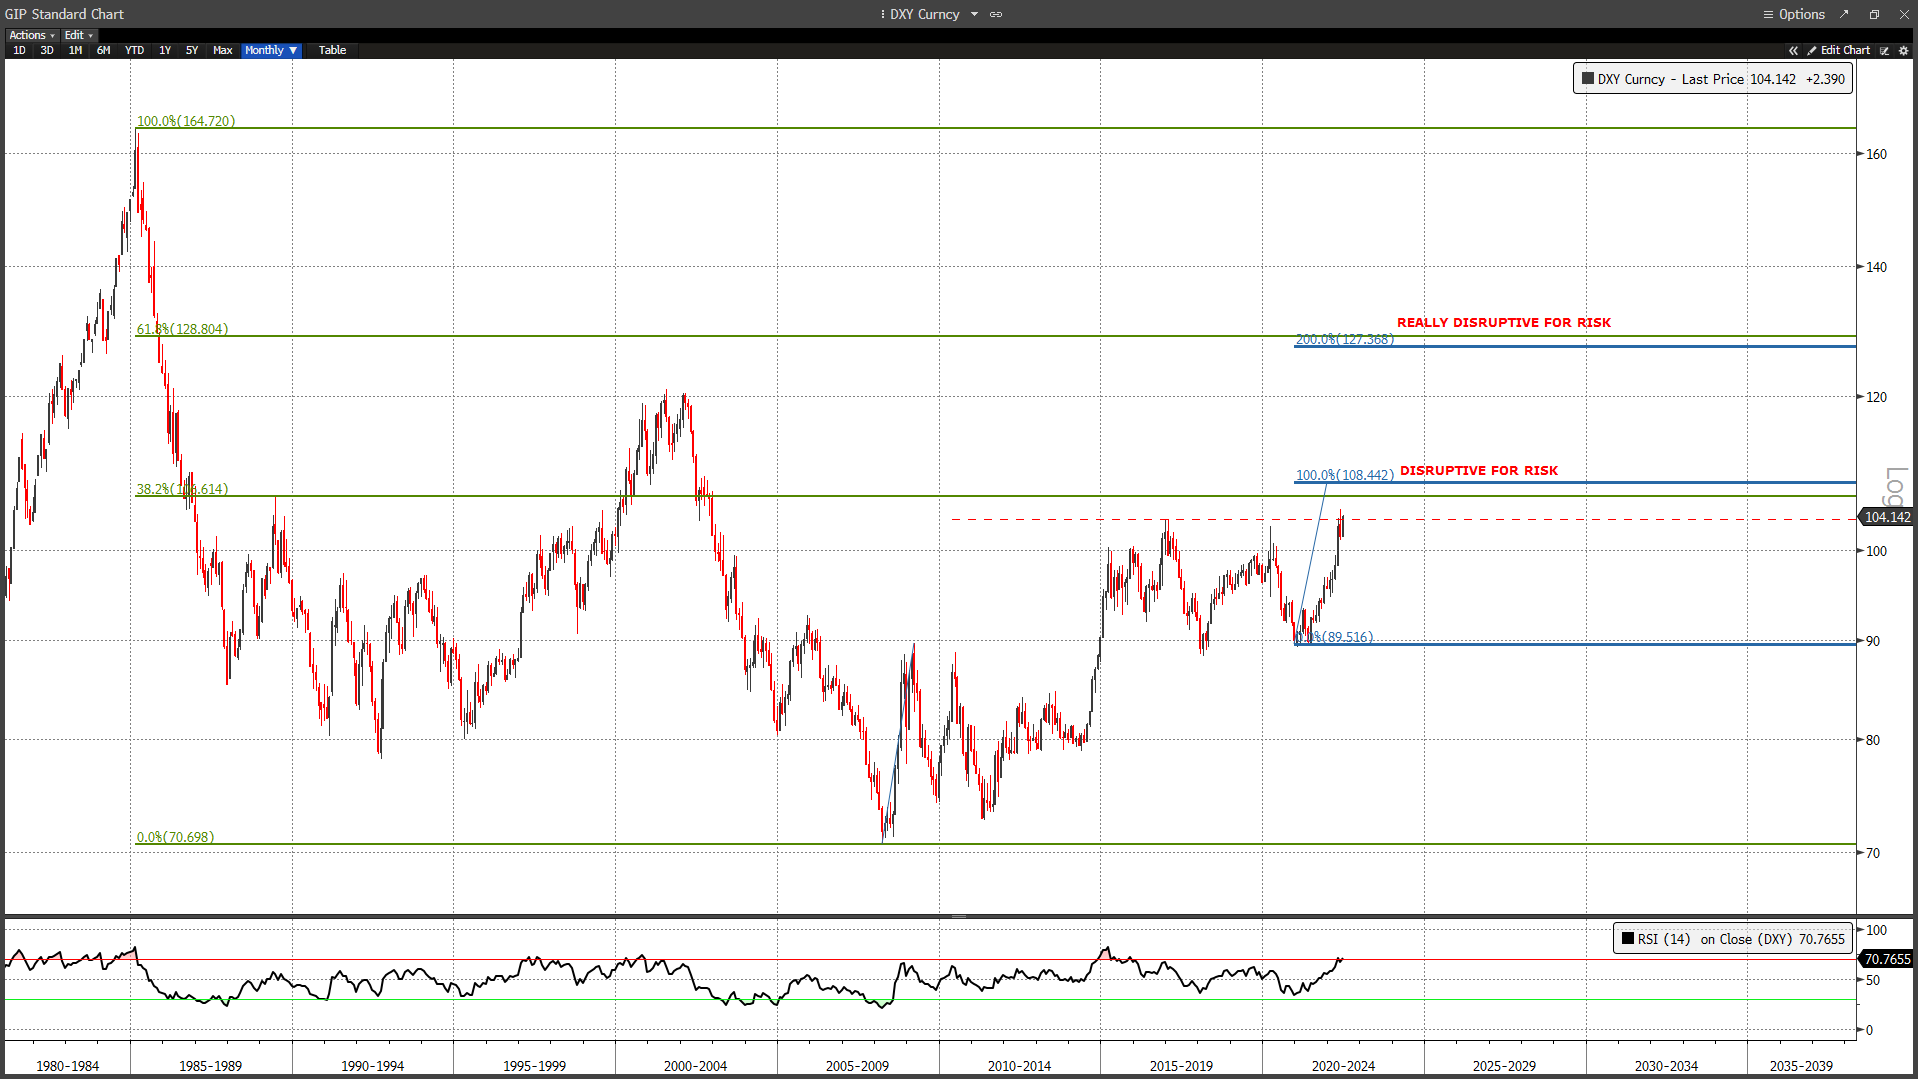
(Dollar index value is average of US dollar price movement wrt 7 major currencies. )
More it appreciates, bigger the risk for emerging markets economies as well as equity markets.
1 Like
US Indices : Dark Night Ahead.
An evening star formation on weekly charts of all the 3 key US Indices - SPX, Nasdaq , Dow Jones -indicating more pain in the coming week.
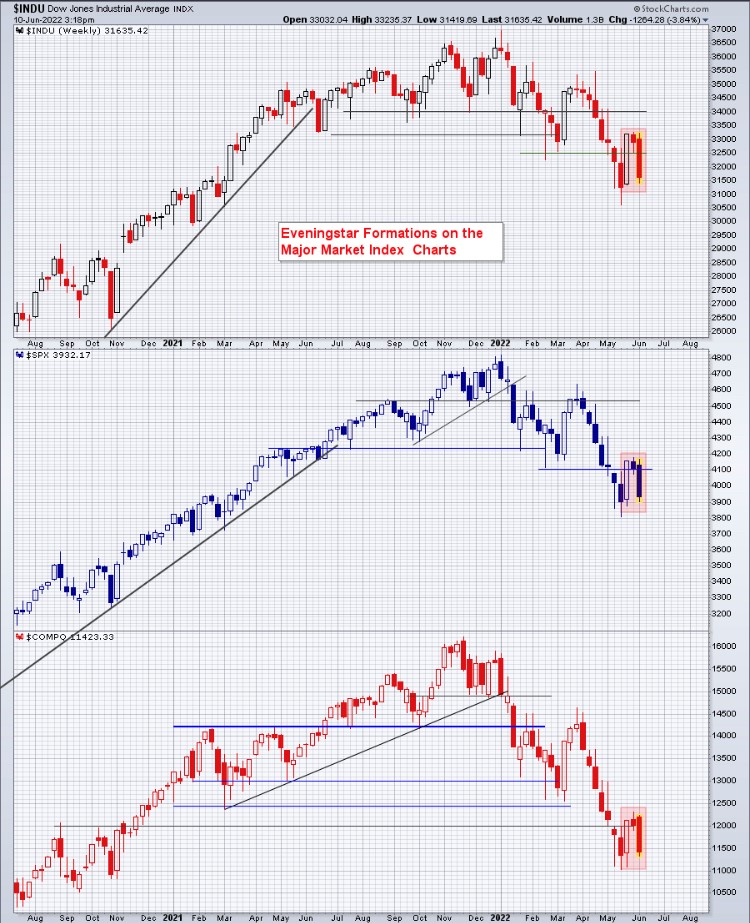
Evening Star : It tells the transition over 3 consecutive time-periods (here it is about 3 weeks) Bullish Candle followed by a Doji on the upper end ,followed by a big Bearish candle .
Bullish Candle - Bulls are in charge
Doji- Indecision - bulls and bears are in fight and no one is winning
Big Bearsih candle - Bears have taken the command
This is a 3 candle stick pattern - named as evening star - that indicates a dark night ahead.
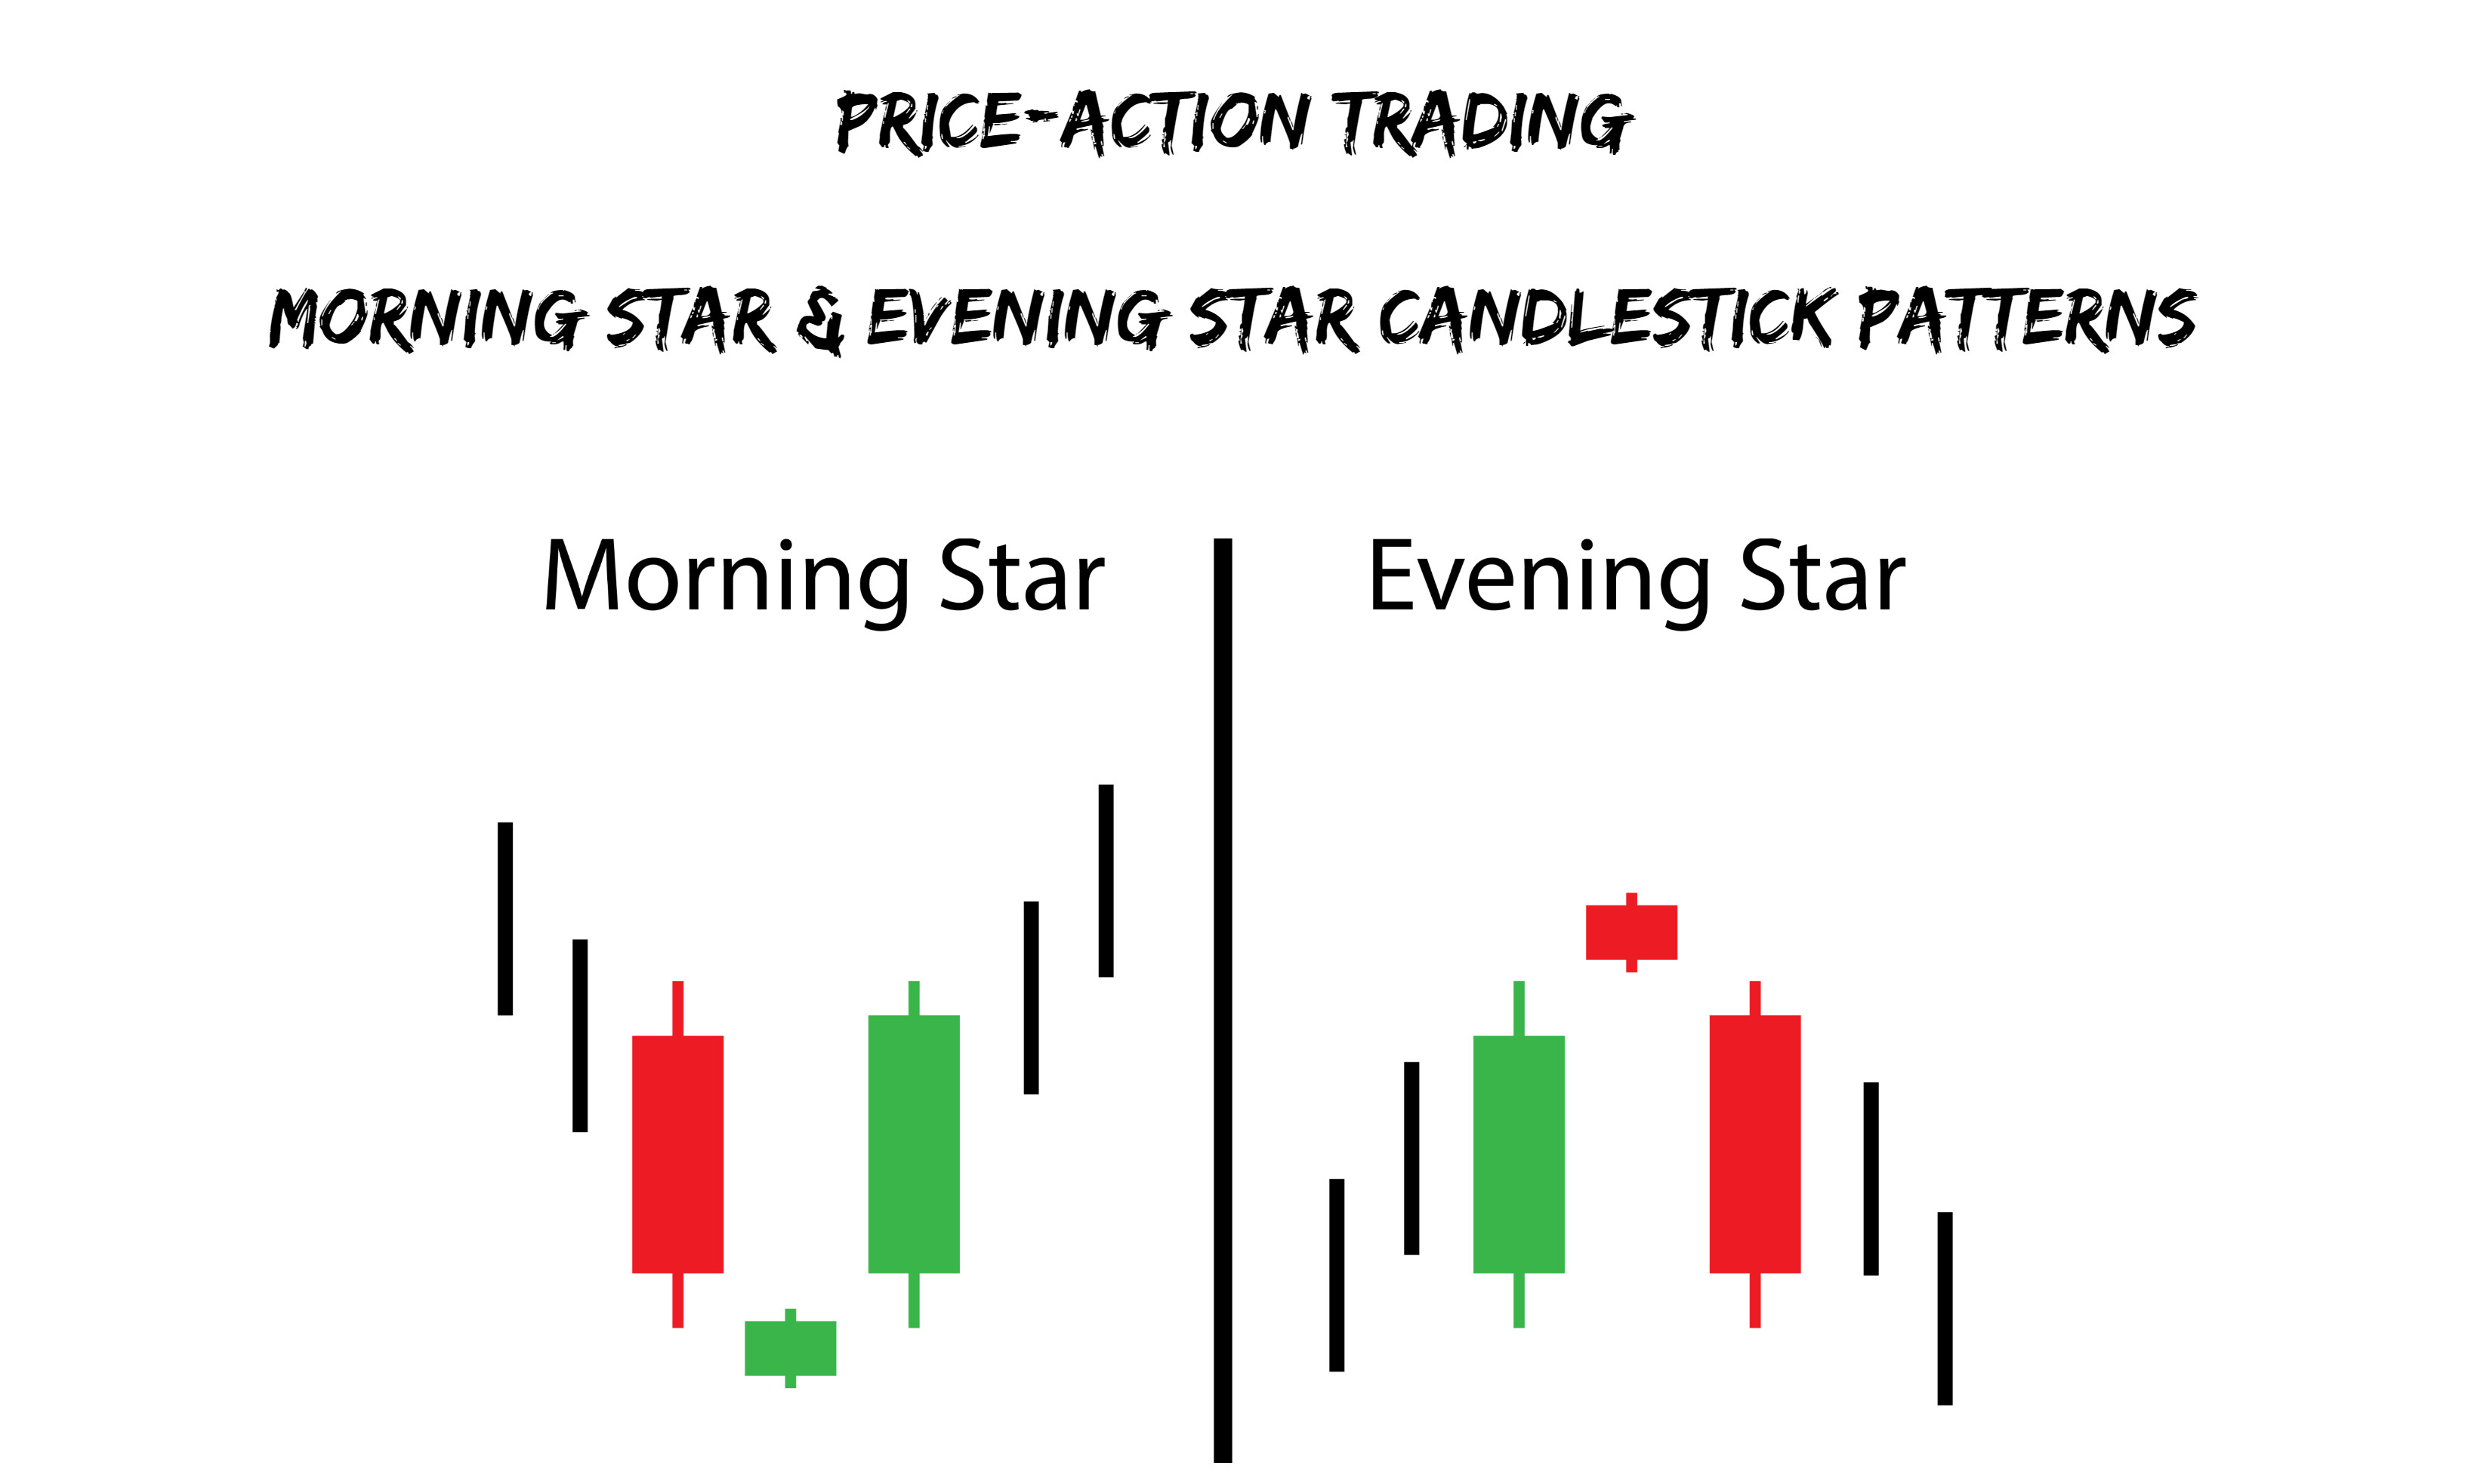
Opposite formation is Morning Star - that 's a bright day is ahead.
Here is more clear picture for both.
5 Likes
Bear Markets Duration -Indian Markets
Major bear markets have lasted for 12- 18 months in last 2 decades in Indian courses.
Based on that pattern, we might keep correcting till Dec 22 /April 23.
And it seems that cirrection has just started …the proportion of fall should somewhat match the rise in previous bull run.

Disclaimer : This is just an assumption, based on past data.
5 Likes
Inter Market -Inter Asset Divergences
Many a times inter-market divergences ( across sectors ,across market-caps ) can help us to gauge the overall situation in the markets.
Similarly , inter-asset divergences can also act as good indicators ( e.g bonds, gold bitcoin vs equity)
Here is an interesting chart of last 20 years of Nifty tops and bottoms (upper part) as well as rshowing ratio of Gold price (INR) vs Nifty levels (lower part).
If you study it closely , most of the times, we have gold trading in between 3.5 times of Nifty levels, we get a major top in the Nifty.
On the other hand , when ratio of Gold prices and Nifty level crosses 5 , we get the major bottoms in the market.
Current level is - 51000/16200 =3.18 . To get a major bottom , this ratio should be near to 5 .
That can happen in 3 scenarios ![]()
Scenario 1 :Nifty falls more (close to 10,000 ) and gold remains at current levels ie 51000 - ratio becomes 5 .
Scenario 2: Nifty remains stable ( ie near 16000) , gold goes to 90000, so ratio becomes 5.
Scenario 3 : Noifty falls to 12000 , gold goes up 60000 , so ratio come near to 5
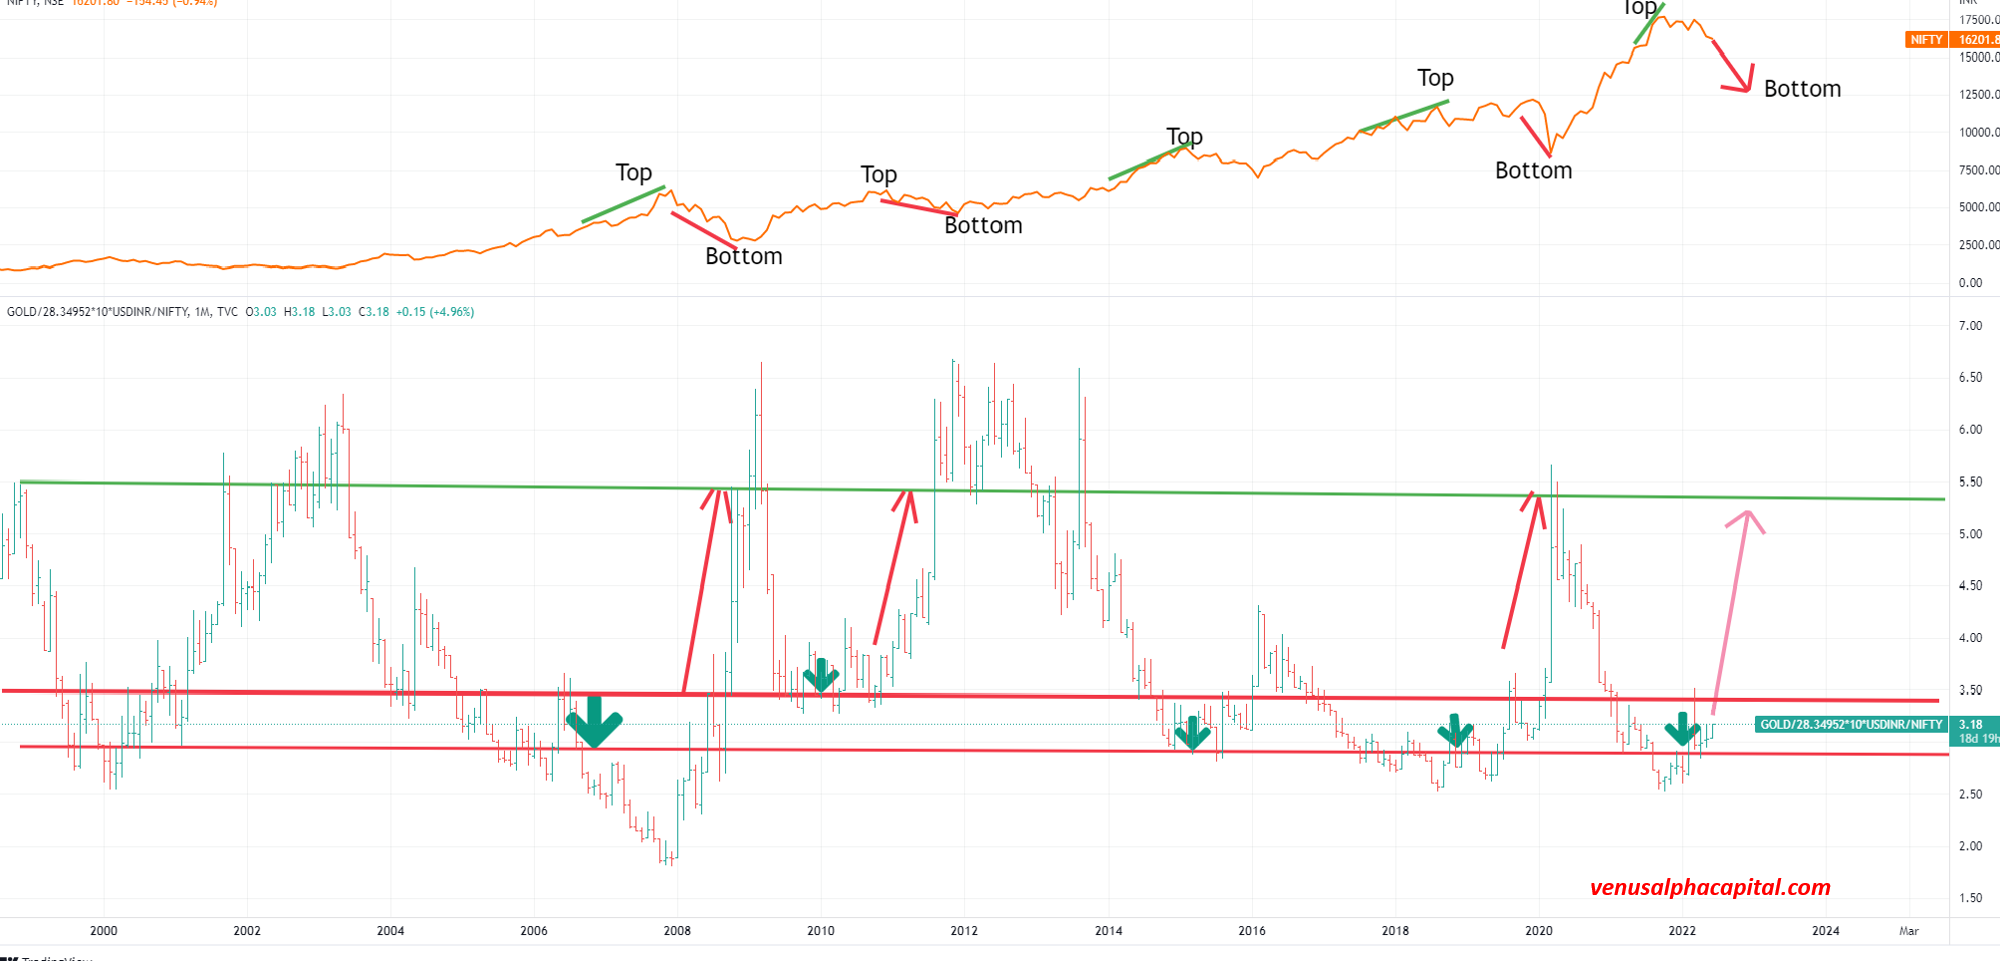
I like scenario 3 and a put high probability on this with 5-10 % divergence .
What’s your opinion ?
Disclaimer : This exercise is based on past patterns. May or may not play out.Did not play out in 2017 when market made a top but the gold-price and nifty level ratio was only 4.25
6 Likes
Bitcoin /Nasdaq
Bitcoin is another macro indicator - it shows the level of liquidity in the markets, the level of sentimental euphoria and extent of gambling in liquid assets.
Rise and fall of Nasdaq and Bitcoin -both follow the similar path.
Can Bitcoin go to <5000 levels ?
Well! Anything is possible. Let it first break the red-line (in yellow -circle )
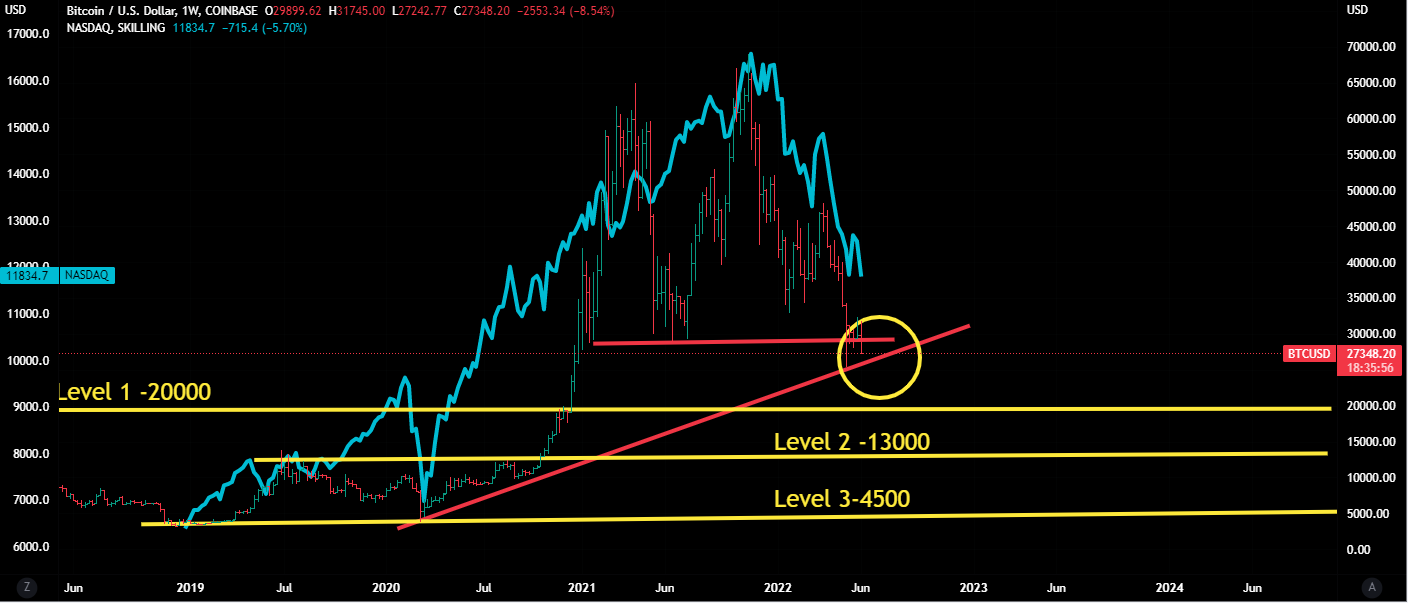
And imagine what would happen to Nasdaq (blue line) ?
Keep in mind ,liquidity creates fundamentals (sales/ revenues, margins )and when liquidity is receding… it decimates anything in its way.
2 Likes
since wave 1 was bigger than wave 3, surely wave 5 has to be smaller. Hence target must be less than that na.
Interesting point mentioned by you in the last. I am also in nascent-to-rookie phase of practicing Elliott Waves. B wave is a very tricky and complex wave - it may run an impulse or it may be formed of various sub-correction waves (WXY). So, a query from my side is how do we judge to go short term trading in B wave zone? I agree with you, if we get a knack of it, definitely good money can be made in less time in equities itself (if we avoid the Options area during this time). Please advise.
Note : Keep up the great work going. I am now starting to follow your threads. All the best!
If someone does not understand technicals, better to be away from B wave rallies in a bear market. It is very tricky.
Bottomline :We’re in a severe bear market -it is better to be on sidelines and if one misses one or two good upmoves in certain stocks, no need to worry. It is like getting into a burning house to get your mobile-charger out.
5 Likes
That’s why kept v=iii. Yes Vth can turncate before that as Vth waves happen to be very very tricky and turncate before achieving the targets.
Keep in mind that we’re in larger C wave on indexes across the globe.
In C waves , only good position is cash position( or hedge in currecies or hard assets like gold in emerging economies)
C wave कपडे उत्तरवा देती है लोगो के …so be extremely cautious.
2 Likes
While we have our own Nifty bleeding good today, do you have any scrips in mind (from technical point of view) which we can see as good short term / long term bets right now? Thanks in advance!
1 Like
Banking, Chemicals,IT should bleed more . But we might see all sectors particpating in the fall in coming weeks/months. When PE derating happens, no stocks can remain untouched.
2 Likes
Embassy Reit
It was lingering in a range from MAY 2020.
Now tried to give a breakout last week but with insignificant volumes. But today made a hanging man candle - it is a bearish candle .May be it is retesting the breakout levels.
Overall structure is bullish, forming a VCP ( and daily/weekly/monthly MACD are in buy mode ).
But many a times, some stocks have bad fortune -किश्ती तब निकली जब समुंदर में पानी न था … they move when overall market sentiments are down - a difficult task.
But keep a close watch , if it crosses 407 again with volumes and stay there at least for a week, then it has a chance to move further. Even if it gives a breakout again, don’t go all in …better to SIP and if it again comes below 395, one should exit fully.
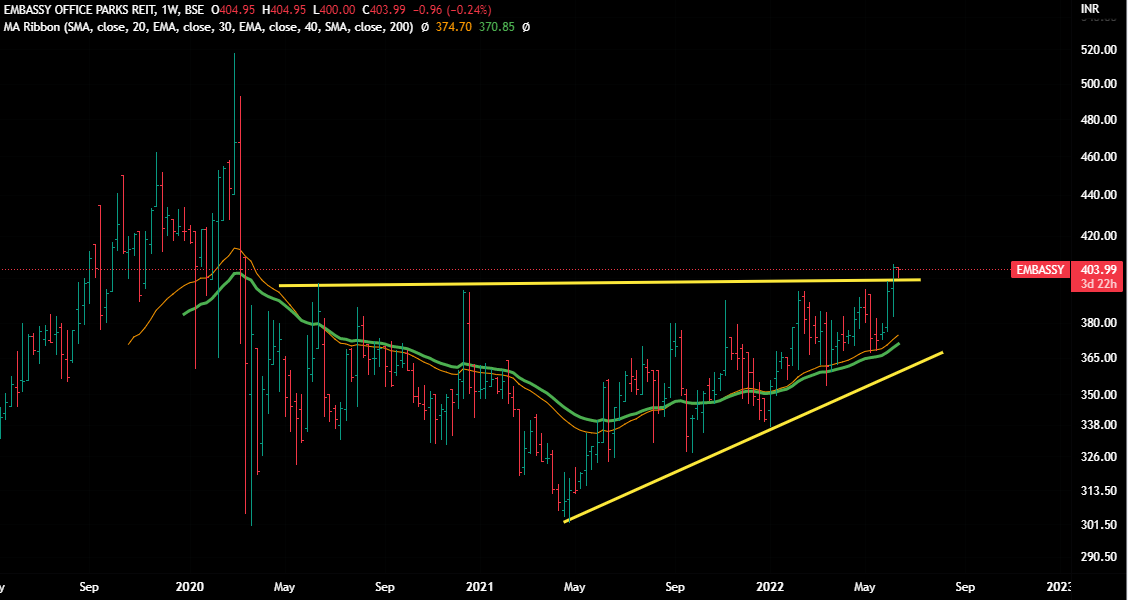
Disclaimer : These are just personal opinions, may or may not play out. No recommendation, no suggestion
3 Likes
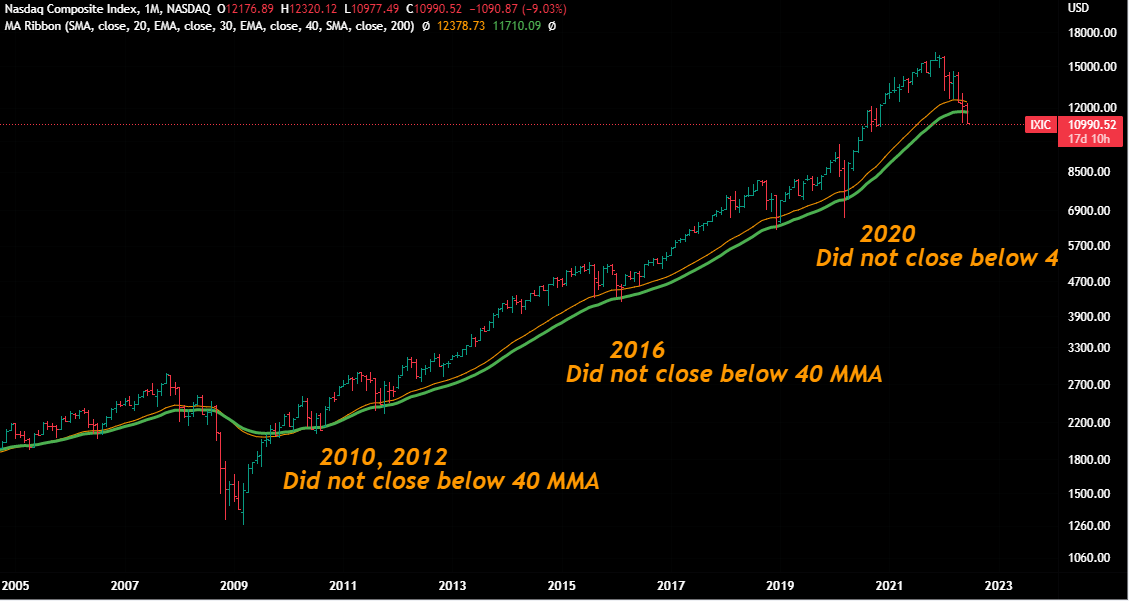
Nasdaq -Below 40 Months Moving Average
Nasdaq is trading below 40 months moving average after a long time.
If it closes below this 40 MMA at the month -end , expecting a lot of pain ahead.
Let’s track it.
3 Likes
Indusind Bank
It is in Stage 4 (declining phase ) and is correcting in Wave 2 ( ABC )
Apart from that it seems to be forming a Head and Shoulder pattern (neckline is between 810-815)
It can play out in 2 ways - either A =C ( EW target ) or H & S target ( distance between head and neck-line) . Pattern fails if the prices corsses above right shoulder.
Let’s wait for neckline break.
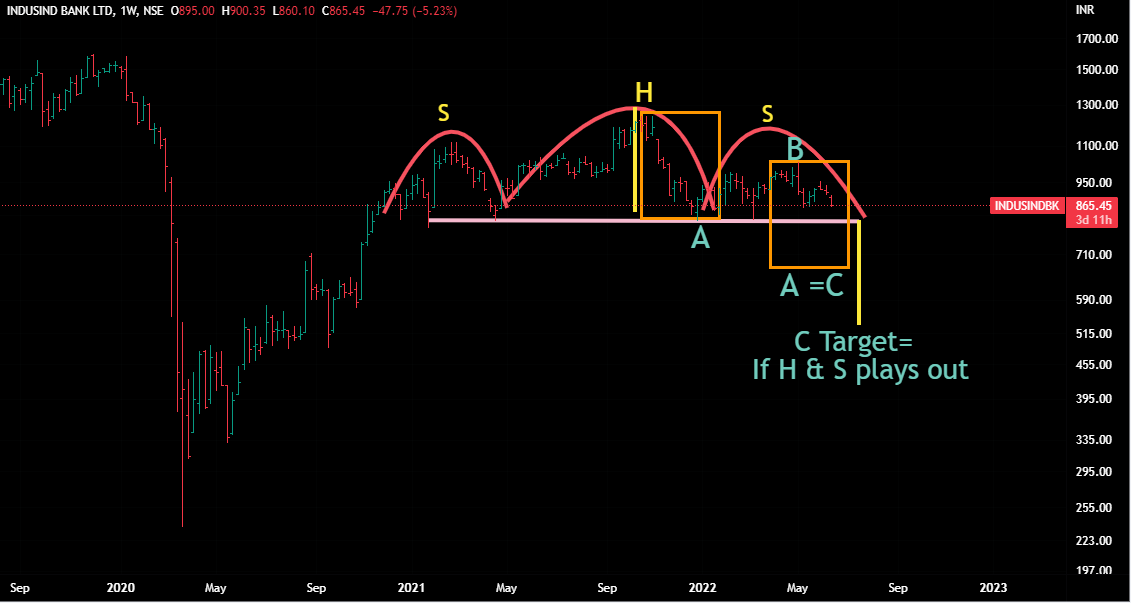
Disclaimer : Chart for study purpose. Market as well as sector sentiments should be in-line with the stock. Still there is no guarantee. No reco ,no suggestion.
1 Like
Chola Finance
It is in Stage 4 (declining phase ) and is correcting in Wave 2 ( ABC )
Apart from that it seems to be forming a Head and Shoulder pattern (neckline is in between 600-605)
Just like previous chart (Indusind),it can play out in 2 ways - either A =C ( EW target ) or H & S target ( distance between head and neck-line) . Pattern fails if the prices crosses above right shoulder.
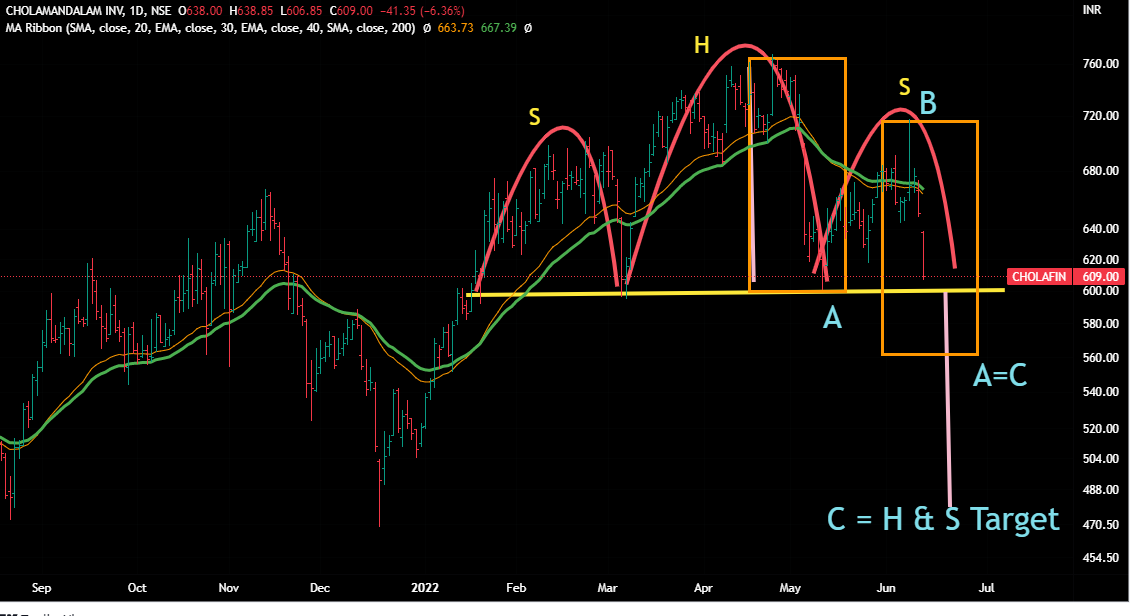
Disclaimer : Chart for study purpose. Market as well as sector sentiments should be in-line with the stock. Still there is no guarantee. No reco ,no suggestion.
1 Like