
Thanks
You may consider for quaters, P&L, Cashflow etc. Said so it can be applicable to any field.
For example visit https://www.qualtrim.com, they have good graphical presentation.
1 Like
Hi,
how can I add an column for 5 year median EV/EBITDA and 5 year median market cap to sale?
Basically I want the data that is available in the graph in the column.
Hi Kowshick,
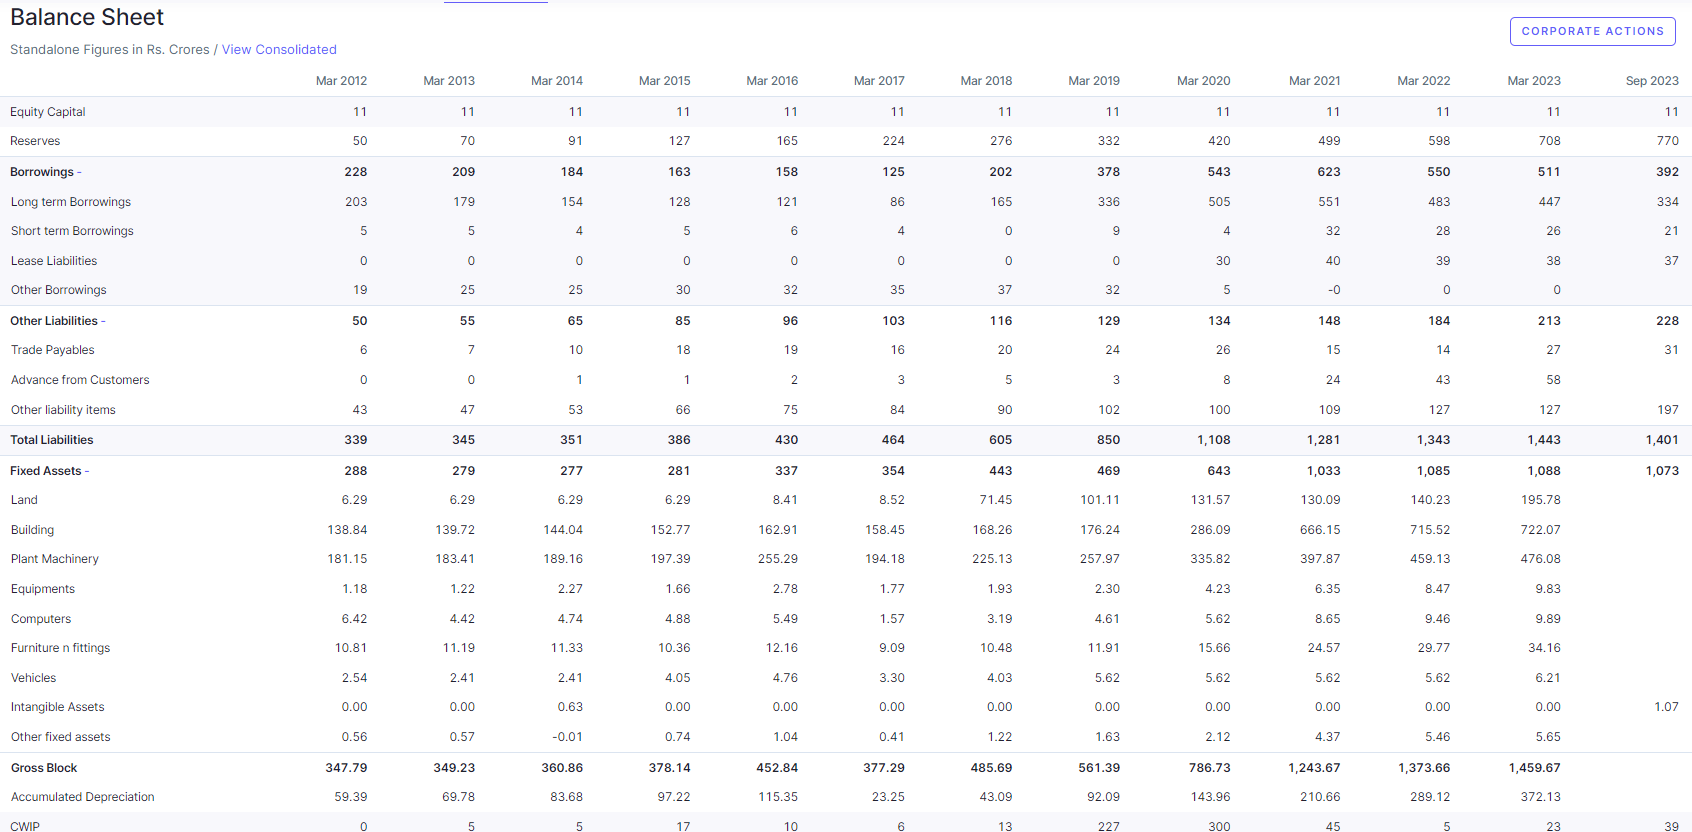
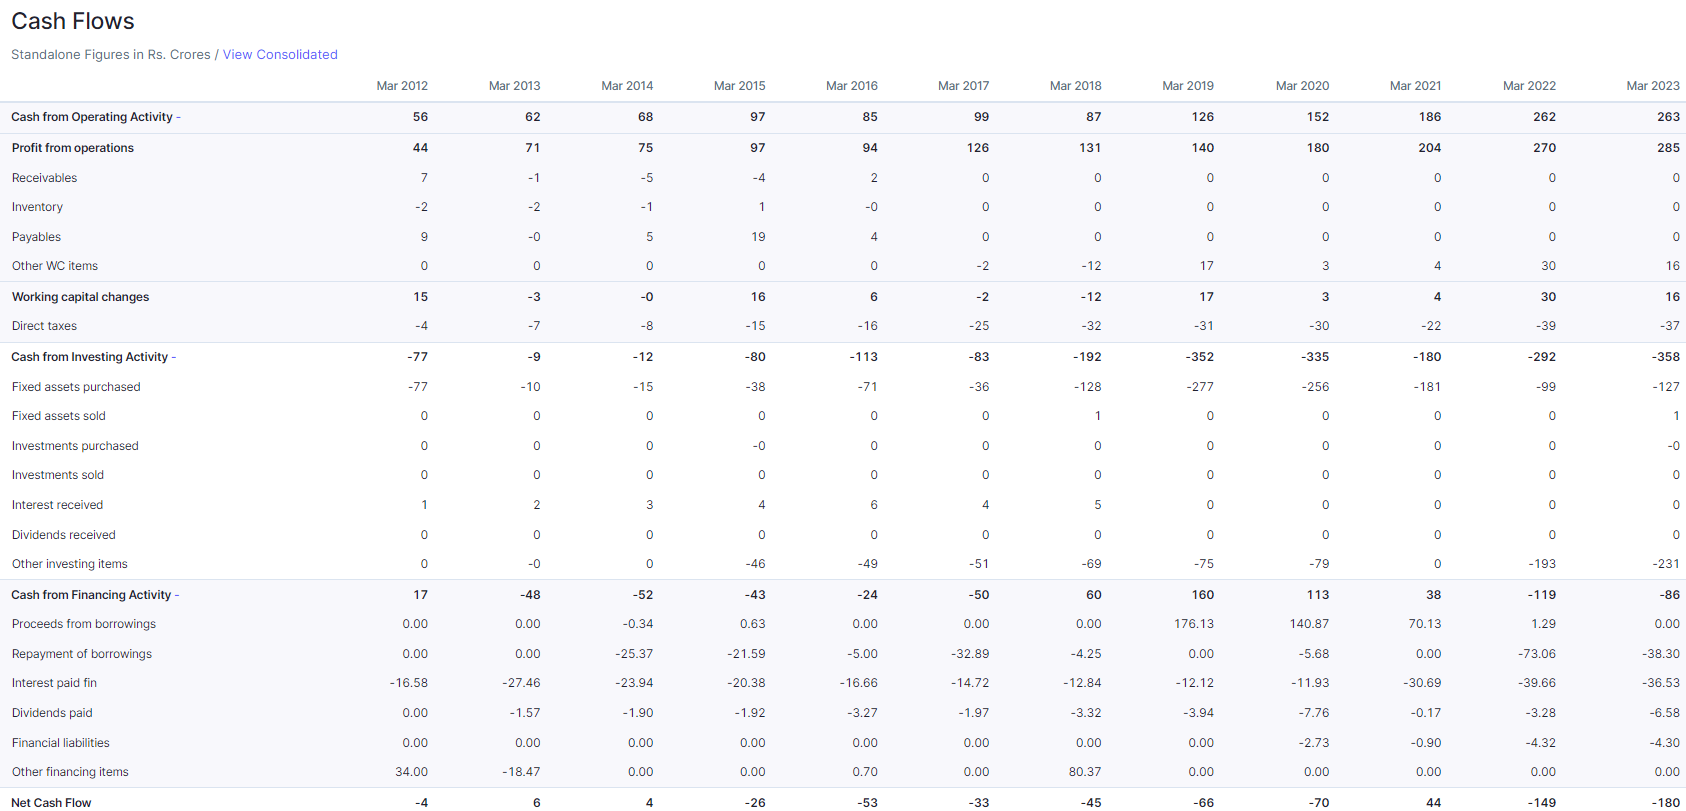
Can you add the detailed balance sheet figures in the “Data sheet” tab of default excel file? This detailed information is only available on the site (as shown below) but is not available in the “Data sheet” tab of excel. The same request goes for the cash flow statement.
2 Likes
Hi @shunz,
The Excel sheet was made years ago and doesn’t contain the line items we have recently added to the website. Our team is working on developing the next version of excel where we are trying to provide 15 years of Historical data and other meaningful line items.
6 Likes
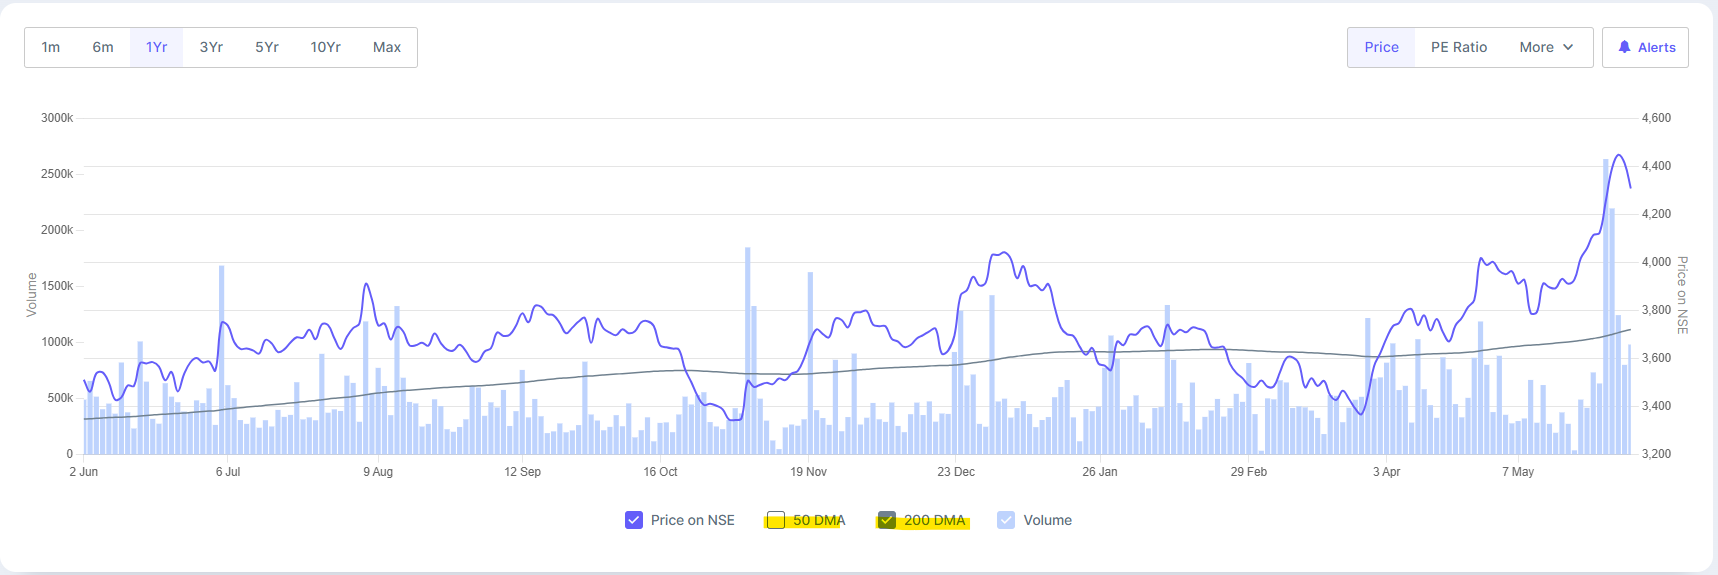
Hi (@kowshick_kk ) : Could you ask the team to start showing 900 DMA as well like 200 DMA & 50 DMA on the chart?
Rationale: Each of them helps to judge the optimism level for different horizons - 50 DMA for the short term, 200 DMA (40WeeksMA) for the medium term, and 900 DMA (40MonthsMA) for the long term.
1 Like
Hi Sir, Currently we don’t have such plans at the moment. We are planning to add 20 DMA data as a ratio in the coming days.
We don’t want to add too much data on the chart as it would disturb our UI. However, I have also made a note of your requirement and will share it with our team for consideration.
1 Like
Hello Screener team, i have a question about the peg ratio?. How do you calculate the peg ratio? For growth nos, do you consider past records or projected growth no given by mgmt
1 Like
Hey, The formula that we use to calculate the PEG ratio is PAT/Profit growth 5 years. We take the historical PAT growth for the above calculation
2 Likes
Why Autoriders International Ltd is not appearing in the list when simply screening for only one parameter:
Market Capitalization >=0
Market Capitalization >=0 , should list all listed companies…Why it’s missing in the list?
Thank you for the response. Usually for peg ratio, its p/e ratio divided by growth. Any reason why this change. Also how do you get the growth projections for next 5 yrs ?
@Worldlywiseinvestors sir, do you have any thoughts on this?
3 Likes
Hi, We exclude companies that haven’t traded for the last 20 continuous Trading Sessions. In the case of Auto Riders International, the company was last traded on 03 Oct 2023. The company will get included in the screen results, even if a single transaction is made.
6 Likes
Hi, There are two methods for Calculating the PEG ratio.
1) Trailing PEG Ratio - In this method, we can take the historical Profit growth data
2) Forward PEG Ratio - In this method, we take the Future Profit growth data
In the screener, we calculate the PEG ratio based on the Trailing Growth Rate. We take the historical Profit growth 5 years and we don’t measure the Forward Profit growth rate
3 Likes
My earlier suggestions are not being implemented, when should I expect the same?
Mainly GUI update as that of Finology one, stock edge or trendlyne.
1 Like
Hi Sir, We are managing the website with a limited team. Our team is already working on several new features like Adding Whatspp updates for Corporate Announcements, Adding new ratios like Median Book Value, Price change, and several other features.
I will share your suggestions with our team and we will try to implement it when it meets our timeline. However, we assure you that we are working our best to provide more value to our user community.
6 Likes
I appreciate it, advertise, monetize your product more sustainably for wide reach and large market.
3 Likes
Hi @kowshick_kk and Screener team, just posting here for visibility as I have already shared with the team but I’m hoping this can be implemented on priority.
Need additional data for ‘3 quarters back’. (corresponding previous quarter of upcoming quarter)
Currently - Sales, Operating Profit & Net Profit are available.
Here are the parameters needed:
- Other income 3 quarters back
- Extraordinary Income 3 quarters back
- Profit before Tax 3 quarters back
I need it for the upcoming earnings season so that data can be compared Year on Year.
The same data is available for the ‘preceding year quarter’ like this:

I have been requesting this since a couple of quarters now and while I do understand it is more data you have to show, but it is data that is already available and just needs to be accessible to users.
Hoping for a quick resolution! ![]()
1 Like
How to download it. Please elaborate.
Hi, @saumil25 Thanks for your suggestion.
Why our team is conservative on adding new ratios?
Every new ratio added reduces the response time of our system. Thus, we are conservative on adding new ratios.
However, we have made a note of your requirement and will share the same with our team for consideration.
Request if we can add any identifier for companies… like whether it is listed on mainboard or sme company. Would help investors like me to not analyse the company in detail if not interested in sme.
1 Like
Please do post an update on what the team has to say. It will not take more than 2 mins to add these as the framework is already established!
Appreciate the response ![]()