
Hi! Is it possible to apply parameters on stocks of a particular index? e.g. Nifty 500 or BSE A stocks?
Is there any place where i can get the price of Xanthine?
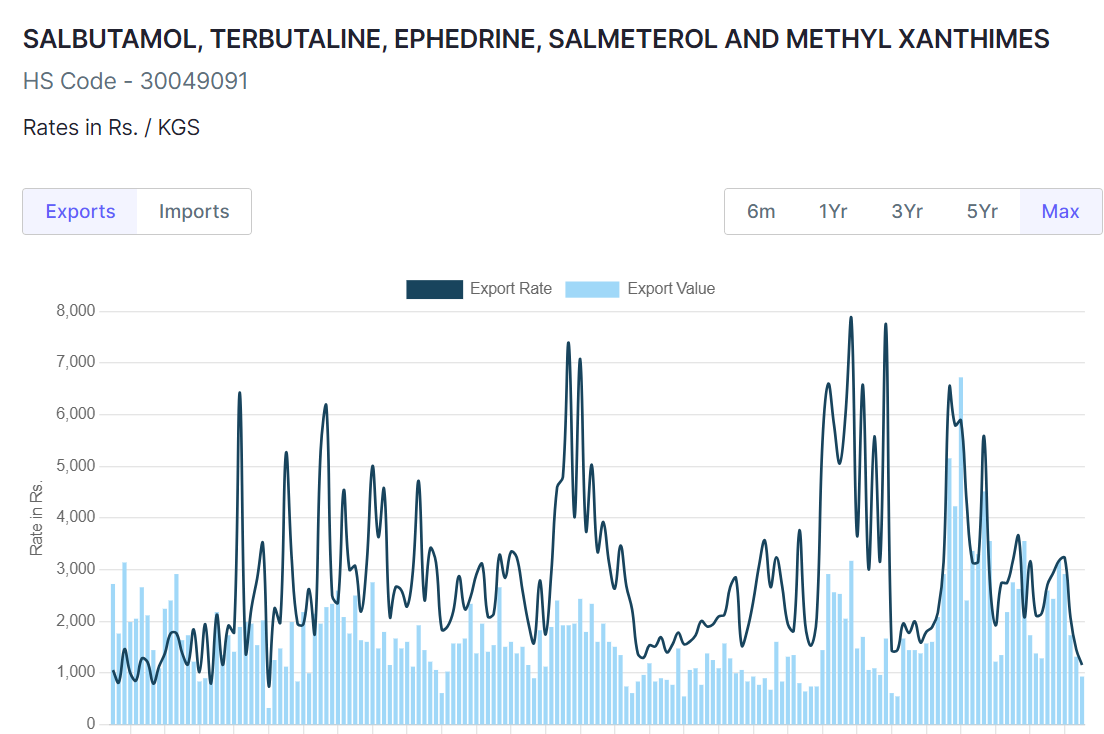
Got this from screener but it’s mixture of multiple chemicals/API
I need only prices of Xanthine alone.
need help here!
How to get this type of detail chart?
Available for premium members by annual payment
Hi Siddharth, We have recently started providing Index related on the website: Added Index Data - Screener
We also allow our premium users to download the data and filter them on Excel. However, we can’t create a customized screen for any particular index at the moment.
2 Likes
Hi Nikhil, We provide the Trade (Import/Export) data of more than 6000+ products on this page: Login - Screener
However, the above is a premium feature at the moment. Do let me know if you wish to know anything more about this feature.
I am a paid user and the benefits of screener is tremendous for my research.
One thing I would request is an ability to see any financial item x number of period ago
For instance, in amibroker if I want a price 2 days back I can write a formula I think ref(c,-1) where c is close.
Other programs have similar syntax
It would be great to have a quarterly or yearly net profit, x periods back in user columns
That will probably make it a bit intuitive for usage
Currently quarterly profits can only be referenced, upto 5 quarters back.
Some data like cash flow from operation is only available for latest year.
Some data cannot be referenced at all like “Fixed assets purchased”
Ideally if I could make a column called Ref(fixed assets purchased, -1) I should be able to get last periods fixed assets purchased.
I know those who come from IT background scrape this data and its quite easy to do but it puts unnecassary load on the server.
4 Likes
Hello Screener Team, i am an avid user of screener. This portal is unique in its space. Thank you for making our lives easy.
I am just curious to know if you plan to add weekly moving averages to the screen. 10 20 30 weekly exponential moving averages would be really beneficial to the community
3 Likes
Can someone please help me to know the criteria for calculating ‘Expected Quarterly EPS’ of any company on screener. The description only talks about the Expected sales growth as the criteria. I am unable to understand that how does screener forecasts the future sales and also the EPS. Is it that some AI being used and if so then what is the raw data.
1 Like
Let me know this by an example to illustrate how Screener might calculate the “Expected Quarterly EPS” using hypothetical data.
Company XYZ Example:
-
Historical Sales Data:
- Q1 2023: ₹500 million
- Q2 2023: ₹550 million
- Q3 2023: ₹600 million
- Q4 2023: ₹660 million
Observed Sales Growth Rate:
- Q1 to Q2: 10%
- Q2 to Q3: 9.1%
- Q3 to Q4: 10%
Average Sales Growth Rate: (10% + 9.1% + 10%) / 3 ≈ 9.7%
-
Expected Sales Growth Rate for Q1 2024:
Using the average growth rate of 9.7%, we project the Q1 2024 sales:- Q1 2024 expected sales: ₹660 million * (1 + 9.7%) ≈ ₹724.02 million
-
Historical Profit Margins:
- Gross Profit Margin: 30%
- Operating Profit Margin: 20%
- Net Profit Margin: 15%
-
Projected Gross Profit for Q1 2024:
- Gross Profit: 30% of ₹724.02 million ≈ ₹217.21 million
-
Projected Operating Profit for Q1 2024:
- Operating Profit: 20% of ₹724.02 million ≈ ₹144.80 million
-
Projected Net Profit for Q1 2024:
- Net Profit: 15% of ₹724.02 million ≈ ₹108.60 million
-
Outstanding Shares:
- Let’s assume Company XYZ has 10 million outstanding shares.
-
Projected EPS for Q1 2024:
- Projected EPS = Projected Net Profit / Outstanding Shares
- Projected EPS = ₹108.60 million / 10 million shares
- Projected EPS ≈ ₹10.86
Summary:
Based on this example, Screener’s expected quarterly EPS for Company XYZ for Q1 2024 would be ₹10.86.
Key Points:
- Sales Growth Rate: Derived from historical sales data.
- Profit Margins: Historical profit margins are applied to projected sales.
- Adjustments: Expenses, taxes, and other factors are considered based on historical trends.
- Outstanding Shares: The number of shares is used to calculate the EPS.
Screener uses historical financial data and observed growth patterns to estimate future performance, ensuring the projections are based on realistic and data-driven assumptions.
3 Likes
In screener can i get forward p/e?
1 Like
Can you please implement number of outstanding shares in income statement please.
One more suggestion mentioned below…apart from the stock type suggestion mentioned earlier (whether it is sme or mainboard)
- Is it possible to mention the index and then the stocks in it…for instance small cap index, then when we click it can show the list of companies in small cap index. This will help investors like me to invest in these specific companies. Sometimes it is time consuming to search.
Our team is more focused on providing features around the fundamental aspects of the company. However, we have been receiving a few requests from users to add DMA 20 and we are planning to provide the same as a ratio for screening purposes.
Currently, we don’t have any plans to add other Moving Average data to the website.
1 Like
We don’t have forward PE on the website at the moment. We have a few projection ratios like:
Expected quarterly sales growth
Expected quarterly sales
Expected quarterly operating profit
Expected quarterly net profit
Expected quarterly EPS
The Expected Nos. are statistical computations based only on variances in historical results. So it is roughly an average of historical growth rates in quarterly results and these numbers are arrived at based on our back-end computations.
It is just a statistical ratio and can differ significantly from actual results. Always cross-check the shown ratios with your own computations, as companies may post one-off good results that might not be sustainable in the future.
1 Like
Dear @kowshick_kk ,
I request a simple addition and should be easy and can help those who track recent quarterly results. In the latest results page, can you add result date in the top, probably after the company name, before the price …That will give an easy way to decide how old was the result when we look at recent quarterly results of any given company.

We have a separate Index Page on the website.Added Index Data - Screener
On the Index page, we show the Index Constituents, Index Value & the Price Chart.
Will the above page satisfy your requirements?
1 Like
Hi @R_Sawkar,
We have the ratio '‘No. of Equity Shares’’ that shows the total outstanding shares of the company. You can also add this ratio to your Ratio Summary Table or as a column.
Adding another line item to the P&L statement is hard as it would disturb the User Interface. Could you also elaborate on why wish to see the data on the P&L statement? Your elaboration would help us understand your requirements better.
Is it added on the App as well?