
Anyone know how the “Company is expected to give good quarter” is derived at?
More importantly is it reliable ? ![]()

Hi,
The Expected Nos. are statistical computations based only on variances in historical results. So it is roughly an average of historical growth rates in quarterly results and these numbers are arrived at based on our back-end computations.
It is just a statistical ratio and can be very different from actual results. It is prudent to always cross-check the shown ratios with your computations, as companies often post one-off good results that might not be sustainable in the future.
4 Likes
Hi Dinesh Sir,
Currently, it wouldn’t be possible to deselect the stocks while running your custom query. When you run a query our system takes the whole universe of stocks for consideration.
We do show the companies that you have already done your research by highlighting them as shown in the below screenshot.
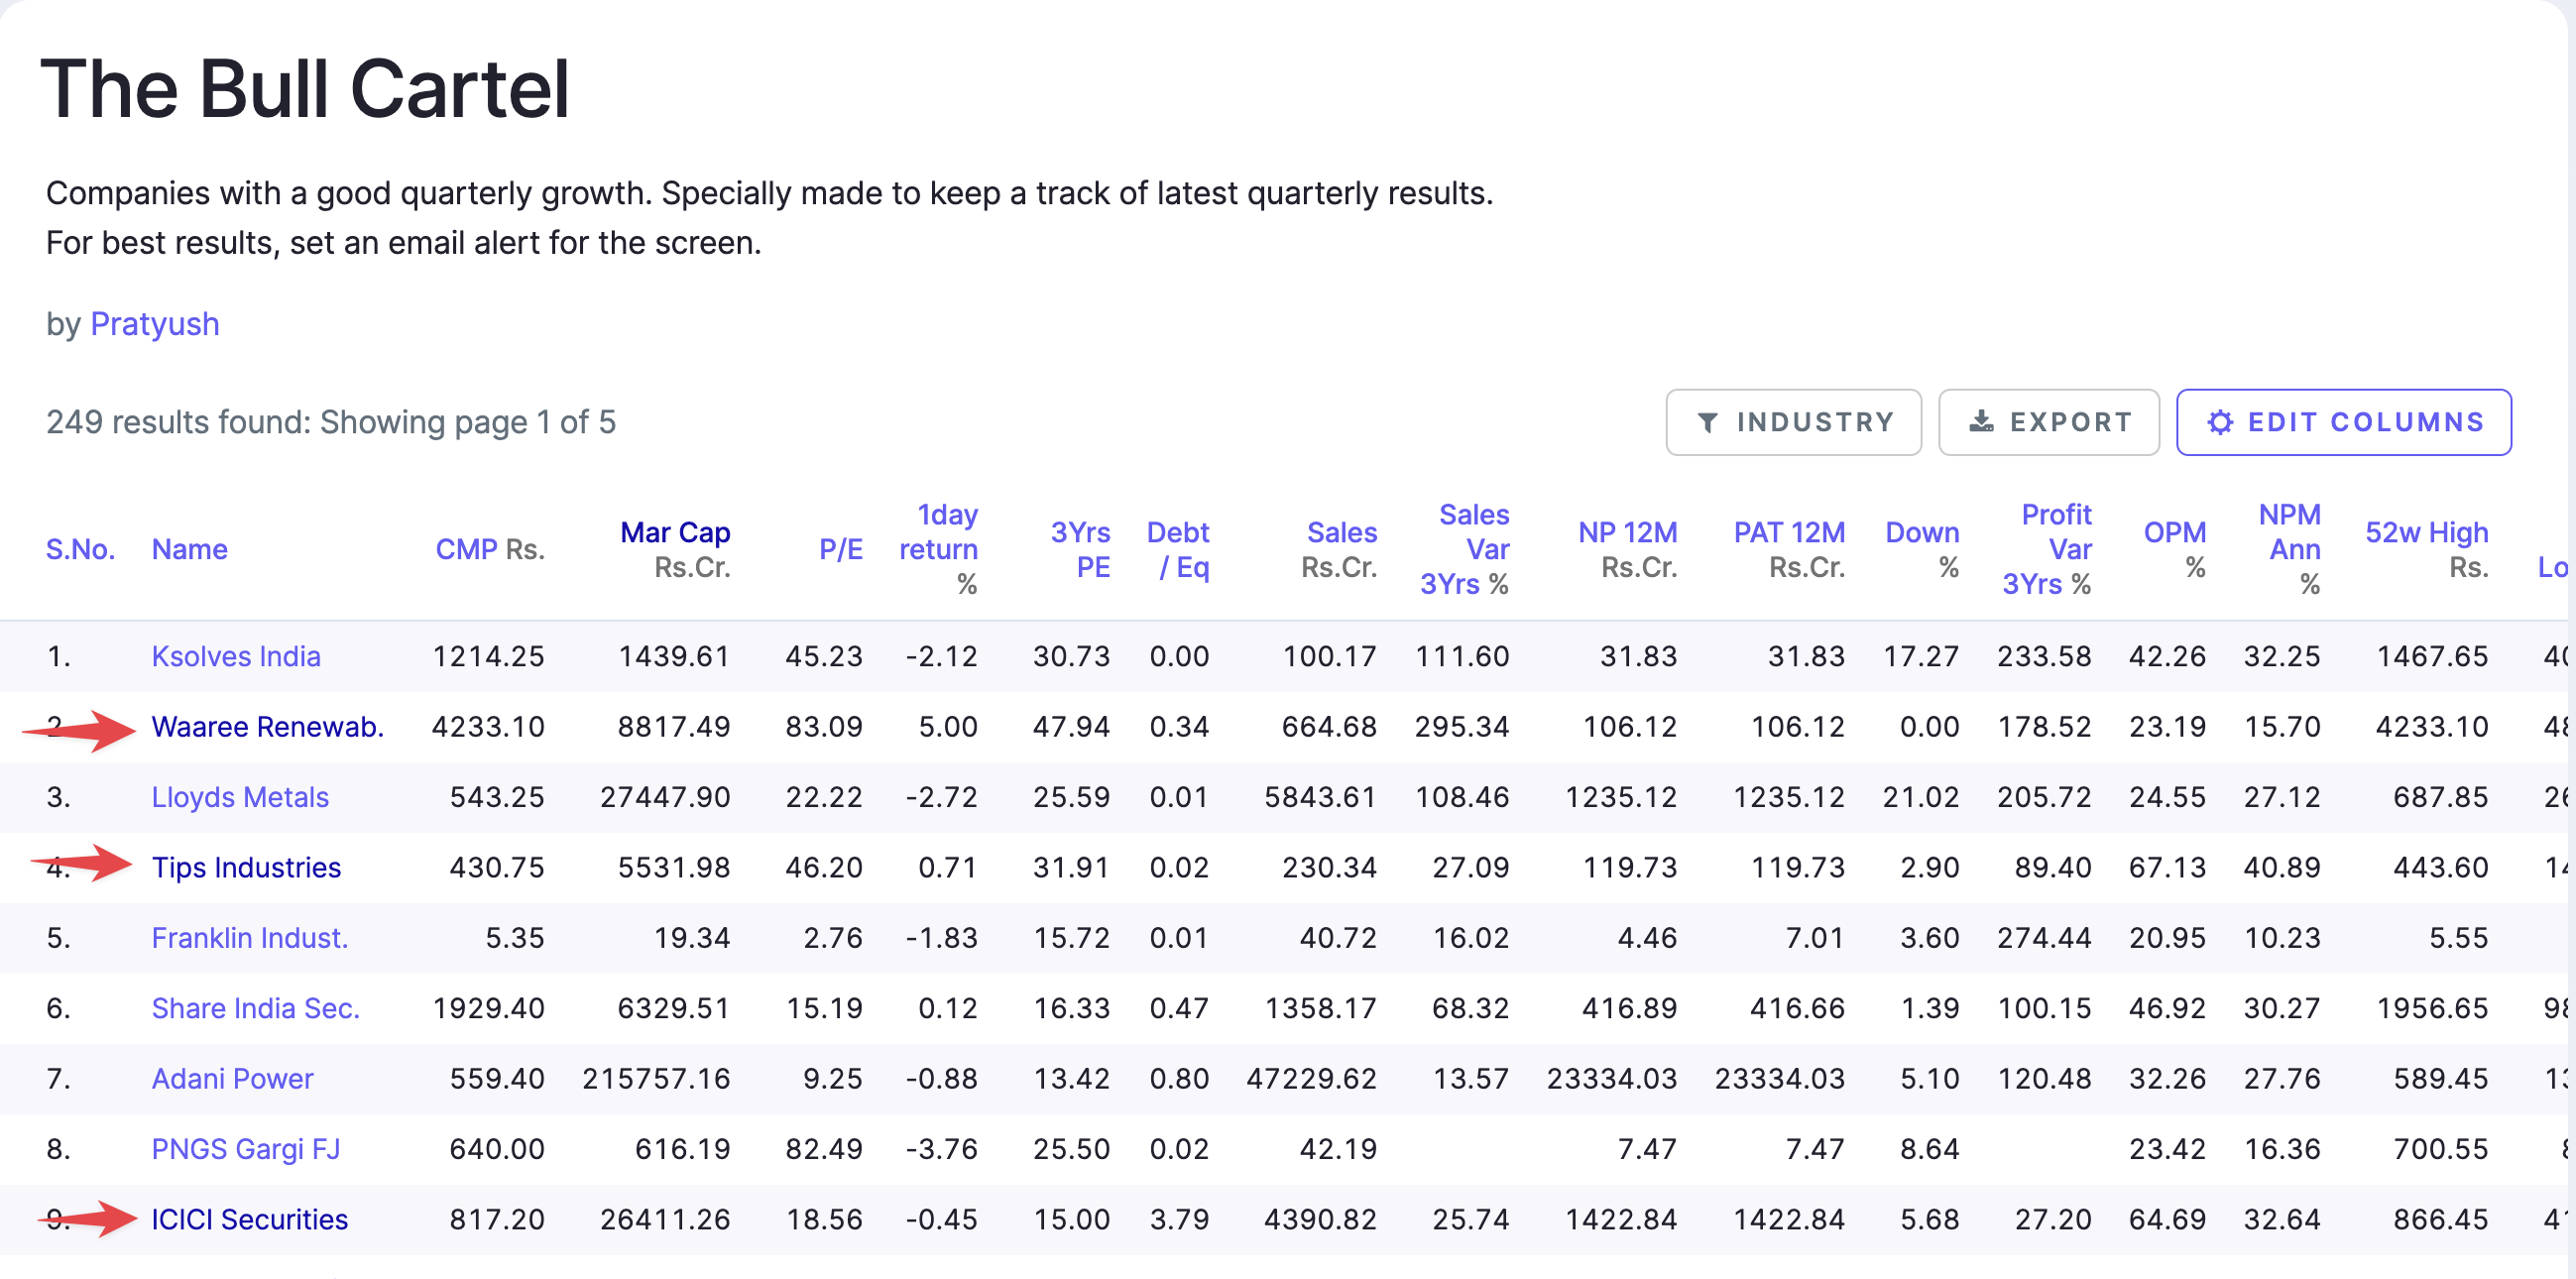
As you can see in the above screenshot, the names of the three companies are highlighted in a dark color. It means that I have already gone to the company page on Screener.
However, I have also made a note of your suggestion and will share it with our team for conisderation.
1 Like
Hi Sir,
Thanks for your subscription. We have the Portfolio Tracking feature on our to-do list. However, we haven’t started to work on it yet.
1 Like
Thanks @kowshick_kk … I will still request to add a filter (if possible) so that I could permanently filter out some companies to appear in my watchlist…
Hi Kowshick,
What is the basis for peer stock list, when I am in stock details page… Some stocks listed under peers are out of place…
Hi Sir,
we show the industry classification as provided by our data providers. They are a little dated.
We have a few ideas to fix it at our end and use a “tag” system instead of a “tree” structure.
However, it requires a little extensive refactoring and thus takes time. In the new update, we will have a broader classification.
How about integrating the feed with WhatsApp or Telegram?
Also can esm etc actions be added to feed?
Hello kowshick_kk
Can we shortlist company based on who is publishing first time ever Investor Presentation or ConCall?
Any update on monthly subscription plan?
Hello, I wanted to check if there is a way to calculate free cash flow CAGR for say 3, 5 or 10 years in screener.in?
Thanks in advance.
Hey, We do have certain plans to provide alerts through WhatsApp. It is on our to-do lists and we will try to work on it in the coming days.
Hi, You can see the latest Concalls and investor presentations on this page: Register - Screener
However, we can’t filter companies that are coming up with their maiden presentations at the moment.
Monthly subscription plans are still on our to-do lists and this has been one of our most requested features by our users. We haven’t started our work on it yet. We will try to prioritise in the coming days.
2 Likes
Hi, We have ratios like Free Cash Flow 3,5,7,10 years ratio on the website which shows the Sum of (Cash Flow from operating activities - Fixed assets purchased + Fixed assets sold) over the last 3,5,7,10 years respectively.
We don’t have the option to calculate them using CAGR at the moment. I have made a note of your requirement and I will share the same with our team for consideration.
@kowshick_kk
In the ratios section, valuation parameters such as P/S and P/E are calculated mechanically by using prevailing or TTM numbers. However, valuation parameter EVEBITDA seems to be based on an EBITDA that’s derived based on certain logic. Why is it treated differently? How is it calculated?
Your response will help decide whether the user should consider it as is or apply their own mind.
Dear Team,
I am an ardent follower of this team as to what you have brought for all investors out there.In order to make it more amazing , kindly do give read stated as below.
How about you change the name of “ETF” in Sectors list to “Indices”.
With these we all will be able to get a list of all the Indian indexes in one go. I know we can easily search in the search bar , but i am unable to get a full list apart from NSE website.
https://www.nseindia.com/market-data/live-market-indices
I have also attached the whole list of the indexes.
With these the second recommendation is to add the weightage column in all Index as if we open Nifty 50 , I am unable to get how much weightage does Reliance/ITC/HUL has in Nifty 50.
For that I again have to check on google or go to NSE website.
The above were 2 small recommendation which will help everyone.
In the end , This website is amazing.
Thank you for all your efforts
1 Like
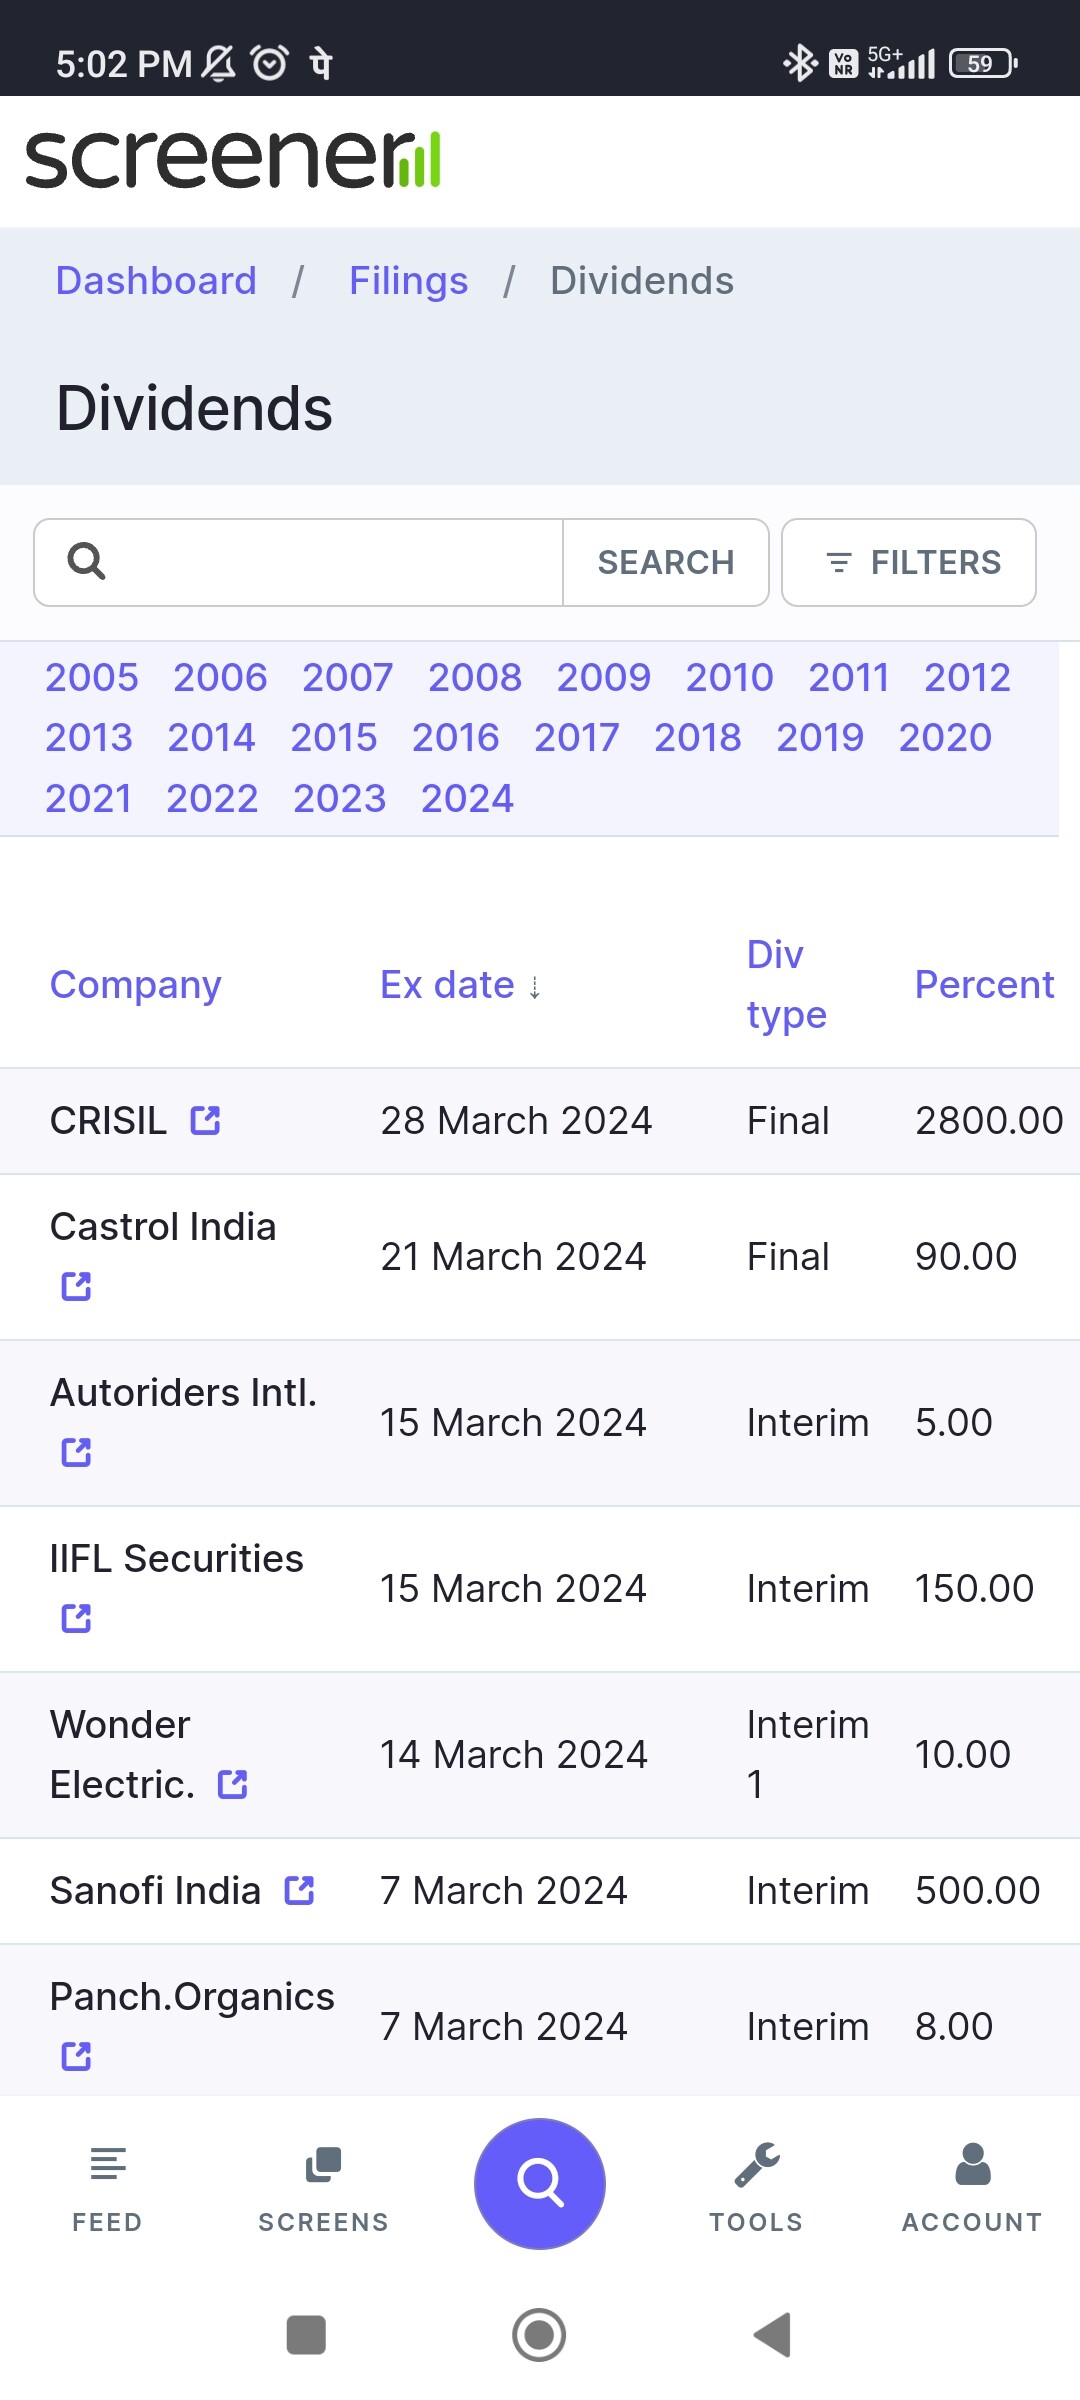
Is there any way to add dividend yield % in dividend tab ?
Only percentage based on face value is shown.
Screener Templete Final.xlsx (1.1 MB)
5 Likes
Hi Sir, I am sorry, I couldn’t get the context of your query. Could you please elaborate on it so that I can guide you better?
Hey, it is not possible to customize this page at the moment. We have plans to add the absolute Dividend amount to this page. I hope this might help you.
1 Like
Thank you so much for your suggestion! We truly appreciate your feedback and the time you took to share your idea.
1) Adding Index to the sector list.
I like this idea personally and I will share the same with our team for consideration.
2) Weightage data
We are not capturing this data at the moment. I have made a note of your requirement and will discuss it with our team.
2 Likes