I am taking liberty to reply. You are comparing Standalone vis-a-vis consolidated numbers.
Regards
I am taking liberty to reply. You are comparing Standalone vis-a-vis consolidated numbers.
Regards
Friends, is there any way where i can last 10 yrs financial data of a company along with the price movements, roe, roce, p/b ratio year on year basis. Typically on screener you see average of last 1 , 3, 5 , 10 years. Any help would be appreciated.
You can check ratestar.in
Have you tried the Custom Excel template in Screener? Customised Excel Sheets for Companies - Screener
This will meet your needs if you are looking for those parameters per year for 10 years. You might have to look elsewhere if you need a rolling chart for P/B across 10 years.
Does the screener.in support for portfolio management and portfolio performance tracking?
If no, that’s one thing which will improve the appeal of website.
Would like to register if it is available.
Thanks!
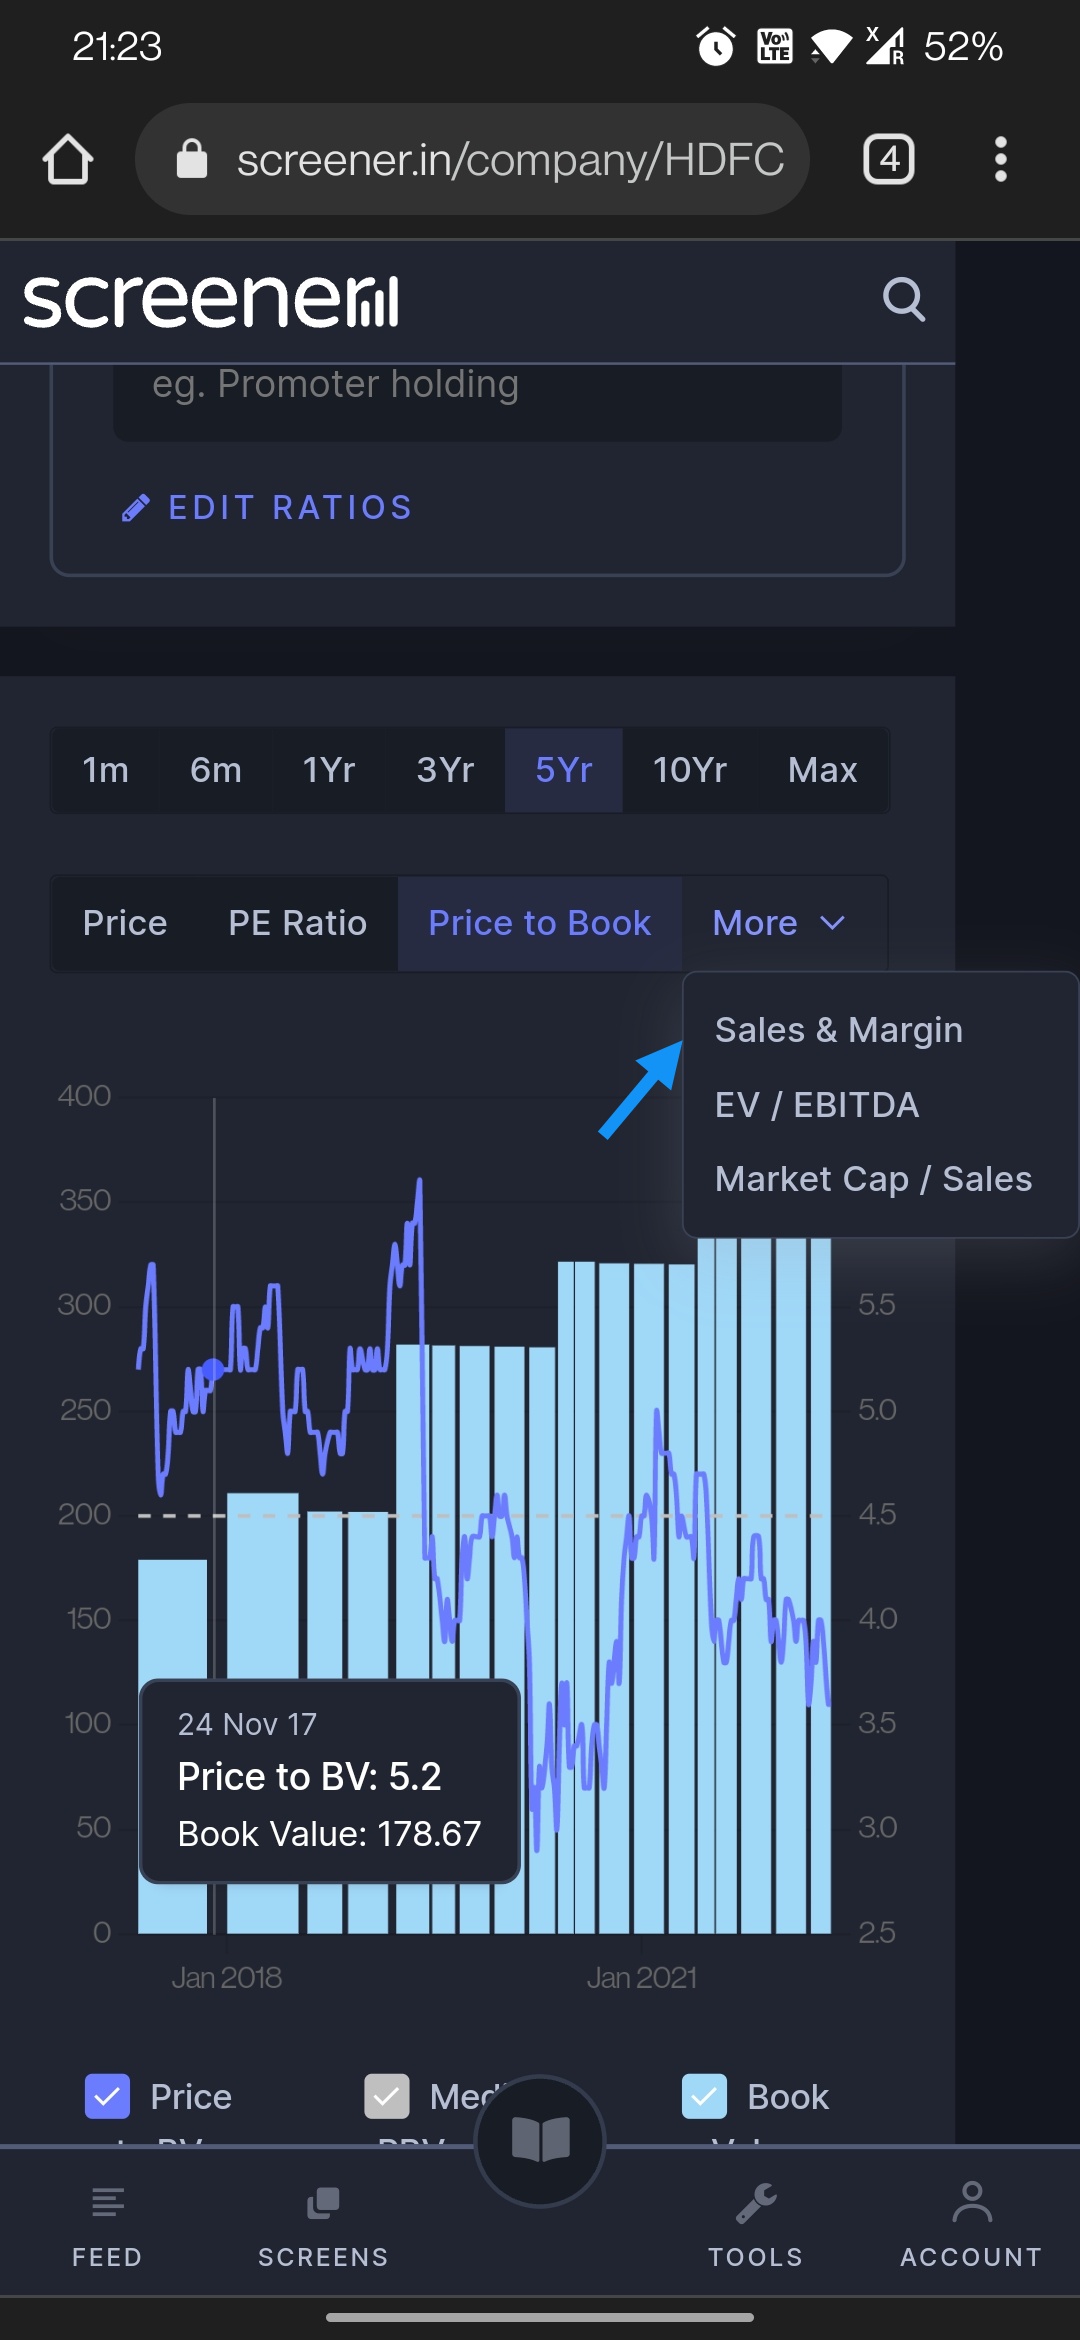
Just saw this latest update on the site showing additional metrics on the chart beyond price/volume, PE and Sales & margin. Now we have P/B, EV/EBITDA and P/S! Brilliant, very useful update for all!
Thanks @ayushmit @pratyushmittal
Thank you for adding new valuation ratio charts apart from PE. Can stocks listed in only BSE (or NSE) or in both be filtered in screener. I have looked around but I could not find anyway to filter based on exchange a stocks is listed in. @pratyushmittal @ayushmit
If anybody knows any website which can help in filtering the stocks based on exchange it is listed in please share. Thank you.
@ayushmit @pratyushmittal
Could you please add QoQ % change also in “Latest Quarteryly result” at Latest quarterly results - Screener
That would be so help. In one page everything. otherwise one has to calculate that.
Thanks in advance.
regards, Saurabh
Does someone know how to screen for promoters buyback over the last few days, months or quarters in screener? Appreciate inputs
There are many screens created related to this already. I am not sure did you check that or not.
If not, click on “Screens” → “Show All Screens” → Search Term “promoter buying” → Search
Does anyone have any excel template/sheet to calculate WACC that can be used with screener excel.
Can you please share it here or on DM
Thanks.
You have not mentioned why you want it but if you want to use it as a discounting factor, use the (Risk Free Rate + Equity Risk Premium) logic to arrive at the discounting rate. RFR is a given, ERP can be anything you feel comfortable with, depending on your equity exposure, type of stocks chosen, macro factors etc.
IMHO, Cost of Capital is a theoretical concept with little practical utility. No one knows how much it is and you can’t do anything with it either.
Yes, I wanted to use it as a discounting factor but I wanted to increase my accuracy as much as possible. I am still studying WACC deeply and want to check what kind of estimates it can provide my valuation framework.
I am working towards removing biases, not complicating my valuation framework too much and not care too much about preciseness. This WACC thing would probably be just an experiment and the last thing I want to be, is an analyst.
Hi Ayush bhai, Pratyush bhai,
Been using premium screener since a few years and have been lucky to have a tool like screener with me. Can’t thank you enough.
Will it be possible to introduce a target feature on different parameters like Mcap, Sales etc, and Ratios like price earning, market cap to sales, etc.
When a stock hits our desired level we get a notification.
Cheers,
Thanks for the kind words and suggestion. Will take a note of your request and share with team
There used to be a credit rating search option in the tools section. I am not seeing it after the updates. Has it been discontinued?
Hi,
Is it possible for screener to allow to see even more historical quarterly results atleast FY2019, may be on a separate button click. Since both Q1FY20 and Q1FY21 have been covid quarters so very difficult to compare the results with previous year etc and get a sense. thanks.
The most effective tool for screening. Loads to love about them. I did a podcast with Pratyush a year back to discuss his journey. I just love the way they approach product building - from a simple, value building perspective, rather than fast commercialization.

Some suggestions from my side after a more than year of using screener:
Hi,
Please add ratio for EPS CAGR 3/5/10 years.
Rationale - EPS growth rate allows us to see impact of Buybacks and Dilution via ESOPs, QIPs etc.
Comparing EPS growth rate with Profit growth rate would show the impact of management actions over the years more clearly and empirically.
Thanks.
Edit - Some stocks I found that had moderate to significant divergence between EPS and Profit CAGR
Kaveri Seed
10Y Profit 13.68%
10Y EPS 15.5%
JM Financial
10Y Profit 20.38%
10Y EPS 17.46%
Yes Bank
10Y Profit 0.88%
10Y EPS (-22.5%)