Screener.in: The destination for Intelligent Screening & Reporting in India

@vibhor_vaish - yes, one can do that by adding custom/quick ratios. We are thinking of providing a customizable row in the ratios table.
We are very serious about data accuracy. Kindly email us at support@screener.in if you have any doubts/observations, team will help provide reasons/reconciliation.

@siyaram7 - we do intend to add that.

1 Like

Hi Ayush.

Could there be a way to filter stocks based on moving averages.

Something like the following could work:

Market cap > 30000
Price < ema200

It’ll be of immense value.

This will increase the load on the database due acquiring and storage of daily closing price of so many stocks.

So, for starting out u could take Nifty 50 only.

1 Like

Hello Screener Team,
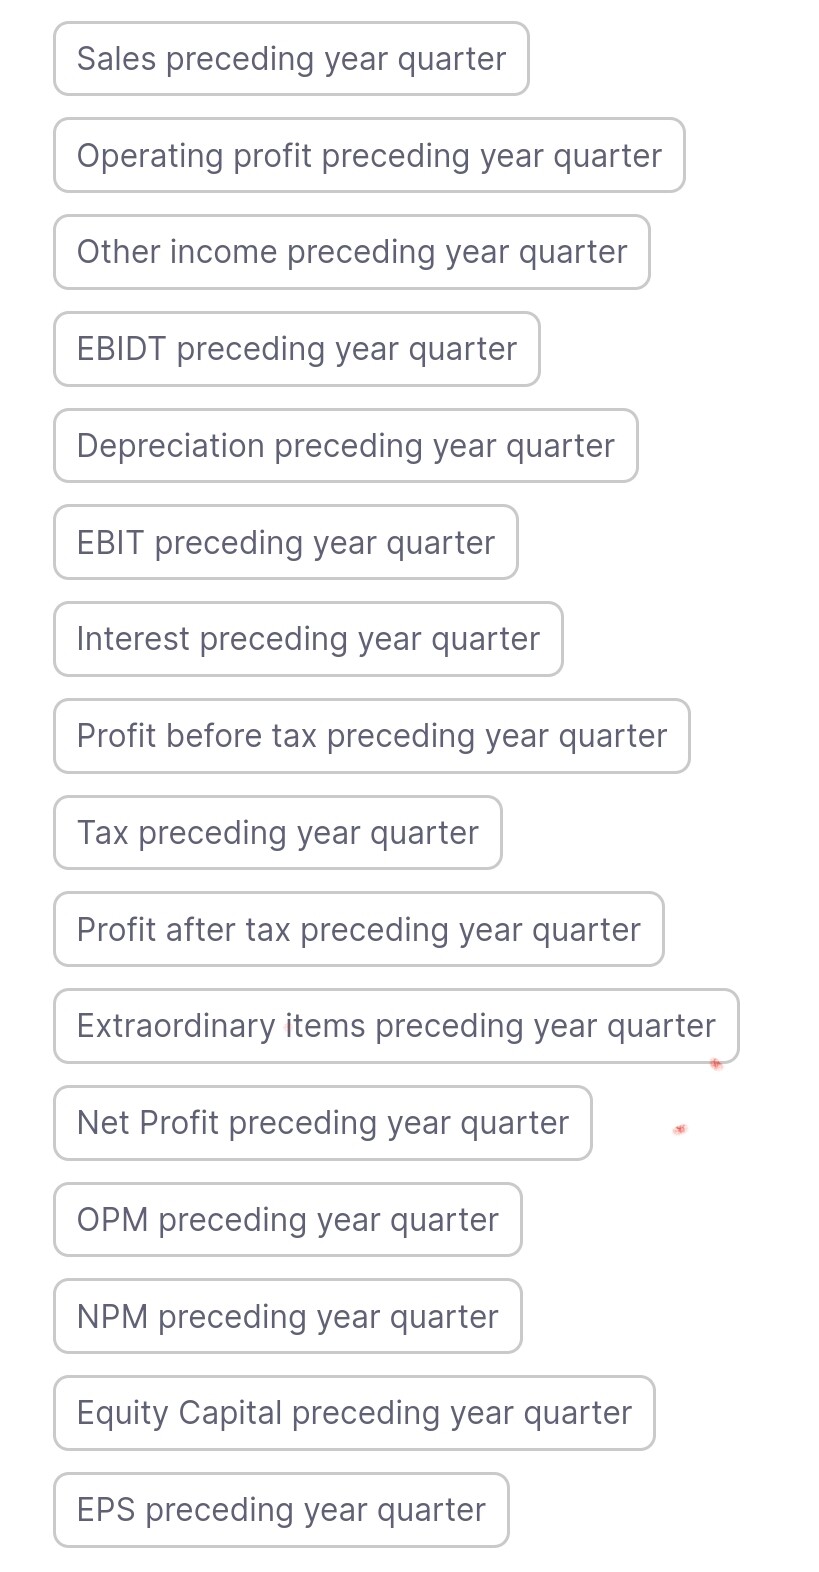
This year for Q1, YoY comparisons will be meaningless because last year Q1 was under complete lockdown. Key sectors like automobiles reported zero sales in April 2020. It will be more meaningful to make YoY comparisons against Apr-Jun 2019 instead. Can you please add ratios for that so that we can make Q1FY22 Vs. Q1FY20 comparisons? Thanks !
@ayushmit @pratyushmittal

You can do it on Chartink.com
Any fundamental or technical or a combination can be used.

Hi, We already have these variable to run screens:

@Chandragupta - you mean in the “New Quarter Result” tab? if yes, good suggestion. will discuss with team

4 Likes

If possible please add new tab for concall alongside AR/Quarterly @ayushmit @pratyushmittal

Hi, Thanks for the response. I meant in the Ratios section which can be used to frame queries and can then also appear in the output. At present we have all these “preceding year quarter”, if we can have “year before preceding year”. It will be useful in New Results tab as well.

2 Likes

How can we use EMA as filter in screen…

@ayushmit @pratyushmittal
Will it be possible to synchronize the Key Points section at the top for similar industry companies for eg) banks.
HDFC bank page shows segmental revenues but not key financial ratios while Kotak Mahindra bank shows ratios and not segmental revenues. Can both show both kinds of data.

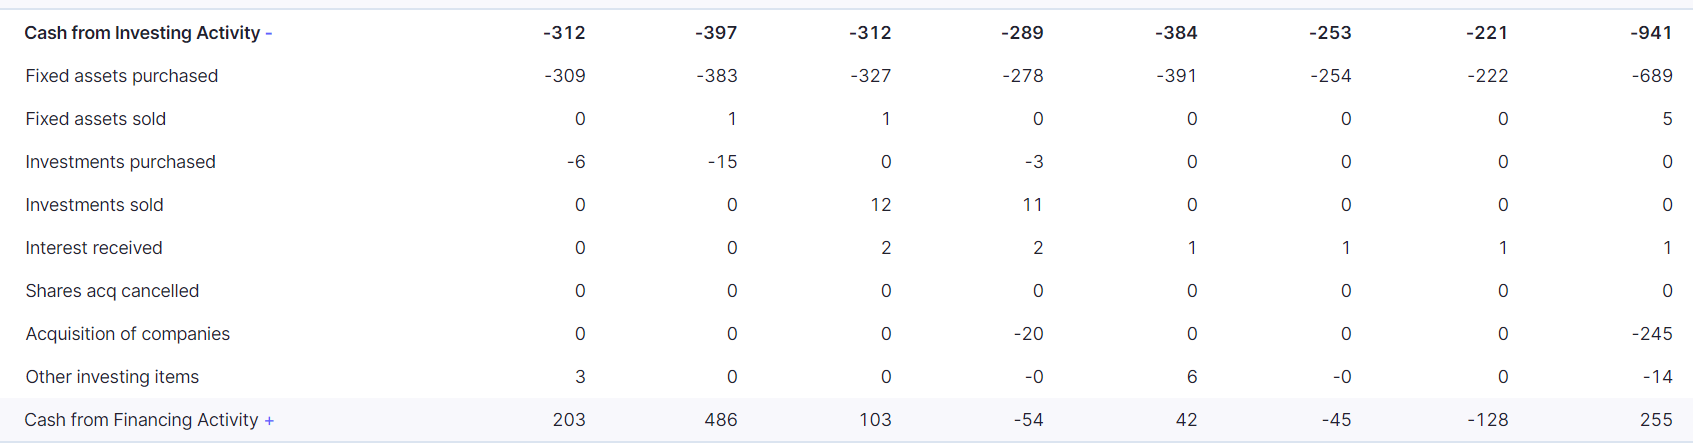
Is there a way to download the underlying sections of cash flow as well. For example, when I download data to excel, all I get right now is Cash Flow Statement divided into Operating, Investing and Financing activities.

I want to be able to download the parts that make up these sections as well.

Hello Ayush,
One Twitter User pointed out an interesting Metrics to evaluate the Moat / Efficient cos through
EBIT conversion.
EBIT conversion = EBIT margins / gross margins
i.e For example, if a company does $10 billion in revenue but has 10% gross margins, that’s $1 billion in gross profit.
But say the company brings in $300 million in EBIT.
That’s a 3% EBIT margin or 30% EBIT conversion (300 mil/1 bil)

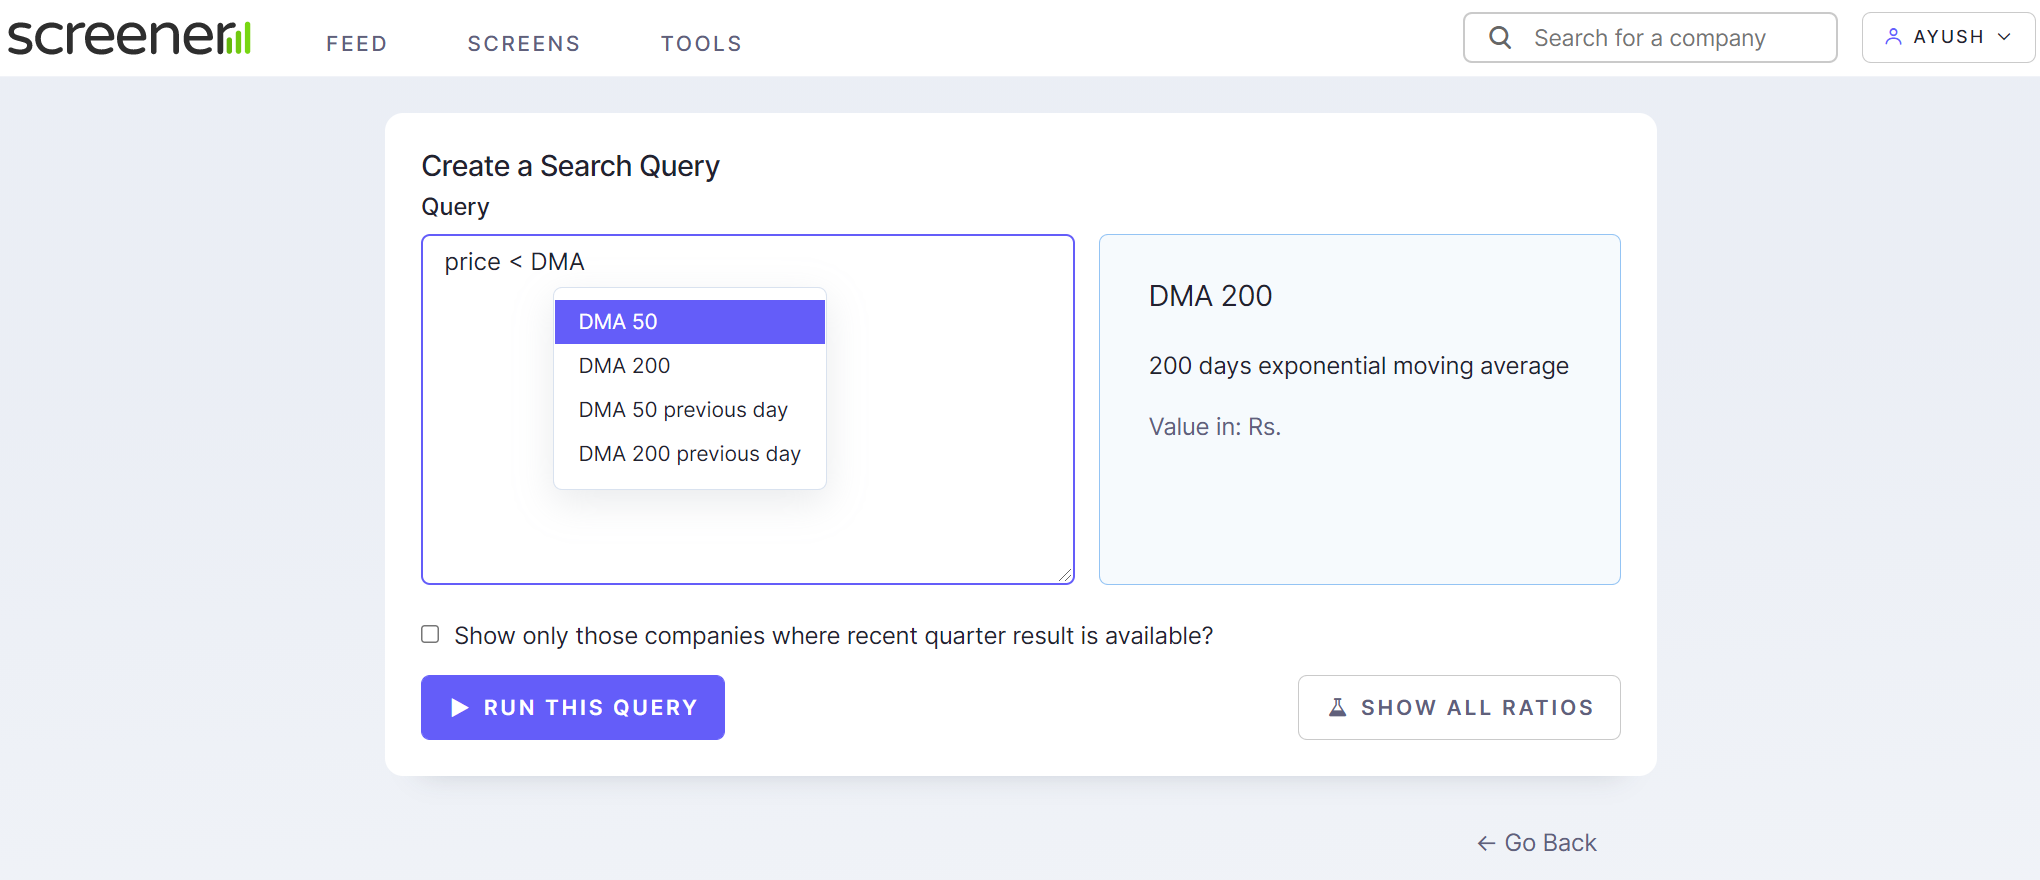
I tried putting this formula in saved ratios on Screener --it doesn’t allow me anything beyond latest Quarter i.e EBIT latest quarter /GPM latest quarter
So 2 Questions :point_down:
1)Is there a way to get this in Screener to evaluate yearly or any other flexible timeframe
2) I also couldn’t get EBITDA added to the formula as it doesn’t recognize it …
Hence, how to get these 2 things sorted in Screener formulas ?

@pratyushmittal the website for Ugro Capital Ltd financial results and price chart - Screener is incorrect. It is mentioned as rrcfinancials.com whereas correct website is https://www.ugrocapital.com/. Would request you to please correct. Also, please consider making websites editable by users (similar to UGC in the about and key points section) so that website edits can also come in for moderation by doing so avoid the need for such lengthy posts. :smiley:

1 Like

@ayushmit @pratyushmittal

Sir, can you please consider adding the metric ‘Reserves last year’ while screening?

I want to build a ratio of Changes in reserves/(PAT-dividend)

I believe even you use this ratio (as described in the video here: Curiosity Driven Research (Wiki) - YouTube)

So instead of doing the calculation manually, we can automate it as a ratio

Thank you Sir!

1 Like

Hi,
Is there any method to make a screening for “YOY preceding quarter - sales/profit growth” & “YOY two quarter back - sales/profit growth” ?

Hi.
Any way to create specific ratios using separate data tabs : for eg) receivables last year(from operating cash flows etc.)
@ayushmit @pratyushmittal

1 Like

I am a paid subscriber of screener.in
Posted several questions a couple of weeks ago but no response from ‘premium’ support! Hence posting on this forum for discussion of the questions and if there is a way to get these information

Which fields in screener in correspond to:

  • Last Quarter Loan Book Growth YoY

  • YTD Loan Book Growth YoY

  • Last Year Loan Book Growth yoY
    Above are very useful for banks

  • Last Quarter Growth in Premiums YoY

  • Growth in Total Premiums YoY

  • Last Year Total Premiums Yoy

  • Last Quarter Growth in Value of New Business YoY

  • Growth in Value of New Business YoY

  • Last Year Total Value of New Business YoY
    Above 6 are very useful for insurance companies

  • Tier-1 Capital Last Quarter (as %age)

  • Tier-1 Capital Same Quarter Last Year (as %age)

  • Cost of Funds Last Quarter (as %age)

  • Cost of Funds Same Quarter Last Year (as %age)

It is not possible. We can do up to 3 years back only.
FCF 1Y ago= Free Cash Flow Last Year

FCF 2Y ago=Free Cash Flow Preceding Year

FCF 3Y ago = Free cash flow 3years - Free cash flow last year -Free cash flow preceding year

But we cannot compute FCF 4Y ago or FCF 5Y ago. To do these, we have to do so company by company by using the “Export To Excel” feature of screener.in

  1. Divis
  2. Jubilant Pharmo
  3. Nectar Life
    It is easy to find on screenr for e.g. for Divis just type
    Gross block >8040 AND
    Gross block <8043
1 Like

Sir,
Can we have a filter of NSE listed stocks in screener.in?