
The new look is more impressive kudos to Team serener @pratyushmittal @ayushmit . It more readable with nice color schema . GUI icons are really nice . Thanks again for wonderful tool …
Regards
YourRaj
1 Like
The new look is excellent.More readable with nice look and feel.@pratushmittal @ayushmittal
Can we have news feed for multiple watchlists, it helps better organised. And also more attributes(growth rate % etc) in “New Quarterly Results” section. Thanks for providing this wonderful tool.
Thank you @ayushmit @pratyushmittal for the fantastic website. Love the clean UI and query capability. Would be great if you could add a voluntary donation button so that we hobby investors also can contribute in a small way.
2 Likes
There are also a few hidden gems like screeners for specific industries (such as pharma). These are amazing too. Really help see the industry picture in
terms of numbers for all constituent companies. Also, this does seem hand curated since the lists seem fairly accurate.
Intrinsic Value = 16 * PEG * EPS
It’s a very flawed formula so please don’t go by it.
So by this formula, higher the price of a stock, higher the IV. And lower the profit growth of a company, higher the IV.
1 Like
How did you find this out? This does indeed seem very flawed.
I would suggest to @pratyushmittal to remove the field entirely, or come up with a more principled estimate based on DCF. Current field is misleading.
1 Like
You can check out any ratio as follows:
Create a stock screen -> Show all ratios -> Search ratio
How can I create a custom formula which contains an exponent operator (^) ? For e.g let’s say I want to build a CAGR formula as follows -

How can I write a formula for this? Screener does not recognize the standard exponent (^) operator.

1 Like
Any plans to launch API for historical prices and fundamental data that is shown on screen and available for download to excel currently?
2 Likes
@ayushmit @pratyushmittal sir could you please try to view chart price or p/E from different time frames it is not working or some other error on my end also p/e IS NOT ABLE TO VIEW . I am using free version
Hi @yourraj, can you please share a screenshot of the error you are getting? It will help us in debugging it better.

Hi @yourraj, that is weird. It is working at our end.
Can you please share the:
- company name
- the browser and version
We pushed a new design recently. Though we tested it on multiple devices, it might be causing problems on some. These details will help me in fixing it.
Thanks for reporting.
Company name : Praj industries
the browser and version
Microsoft Edge 41.16299.1004.0
Microsoft EdgeHTML 16.16299
it is working on chrome
not even working on : Mozilla/5.0 (Windows; U; Windows NT 6.2; en-US; rv:1.8.1.20) Gecko/20081217 Firefox/2.0.0.20
Thanks for sharing the details. We have tried a few fixes. Can you please check if it works now?
@pratyushmittal, I can see current PE in charts showing different for different periods. For eg: for Thyrocare, 6 months, 5 years, Max shows about 86PE where was 1 year and 3 year shows it around 40+ without any PE charting for a month or so. Would you please check this, if this normal.
1 Like
Hi,
Possible for screener.in team to give YoY % and QoQ% figures also at https://www.screener.in/results/latest/
Hi,
The Numbers for Ashiana Housing seem incorrect. the FY20 revenue as per screener is 304 cr whereas as per Annual Report (page 211 of pdf) it is 317.55cr. There could be other discrepancies as well. Request @pratyushmittal to kindly look into it.
Hi Sahil,
The difference is because we show the other income separately. Income from operations is 298.51 + 5.32 = 303.83
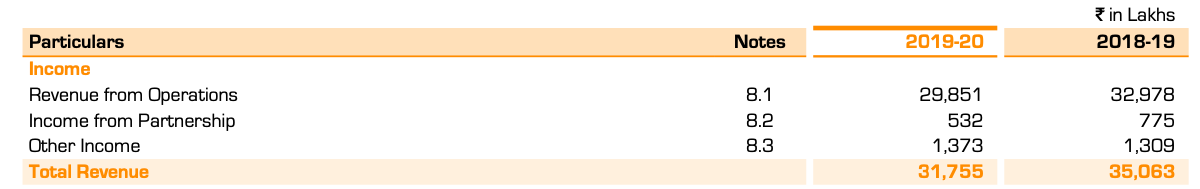
We show other income separately and it includes exceptional items.
Hope this helps.
6 Likes
Hello pratyush bhai.historical pe on screener is very helpful.can historical price to book of say 10 years can be included in screener?
2 Likes