For last several days I am getting daily ‘watchlist update’ email by afternoon only. Whereas earlier it used to be around 6 AM.
Has there been any change in policy or is something broken ?
Could you please look into it and rectify the same.
Screener sends out lacs of emails everyday. The customization and computation of emails take considerable time. We recently updated the algorithm to prioritize premium members while sending out emails. This would have changed the delivery time.
We are trying to improve and optimize the algorithm to deliver all the email before market hours. The optimization is taking time as it requires some extensive refactoring in code. We hope to update and fix the algorithm soon.
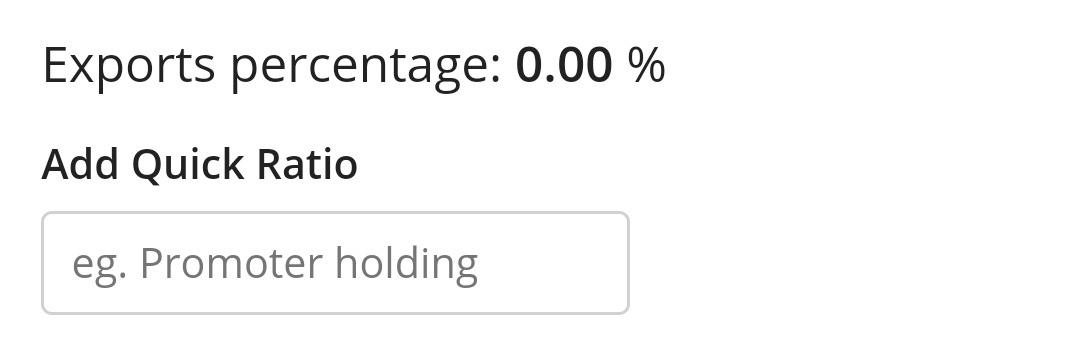
Hi @Parthgarg export percentage parameter in screener is not fetching data properly. I have checked it with Annual report for few company.
Could you please have a look.
Thanks.
Hi Team Screener, As per one tweet on twitter, you also provide ‘intrinsic value’ of the company.
Or its maybe one of the screen made by someone on your website.
I am very much interested in it.
Please let me know how to access it.
Thanks in advance,
Vikas
I’m a new member (from Lucknow) over here and feeling pity how i missed being a part of VP for so long… Also many many thanks @ayushmit sir for building screener.in…im kind of obsessed with it and have built around 300 screens considering different probabilities of important ratios… Thank you once again
Hi, the compliance have been changed now because of which now companies are not required to give export percentage data, and hence screener is not able to get the data out of their annual report.
Now the companies only give FOB earnings which can be other than export as well.
We will be removing this feature from our site very soon.
I am trying to calculate the CAPEX using screener.in. Is this readily available? I tried to calculate using the below formula for tata steel but with no success. (NFA + CWIP) at the end of the year – (NFA + CWIP) at the start of the year + Depreciation for the year
The top row in Part B of the Cash Flow Statement (Purchase of Fixed Assets) should usually approximate the capex. The other option is to look at change in the Gross Fixed Assets or simply the “additions during the year” in the Fixed Assets schedule. Here Capital WIP is given separately at the bottom. In both the options, adjust for the Fixed Assets Sold column though normally this is a very small figure. The third option is to go through the analyst concalls, they usually ask about it.
Thanks a lot for constantly making improvements in the tool.
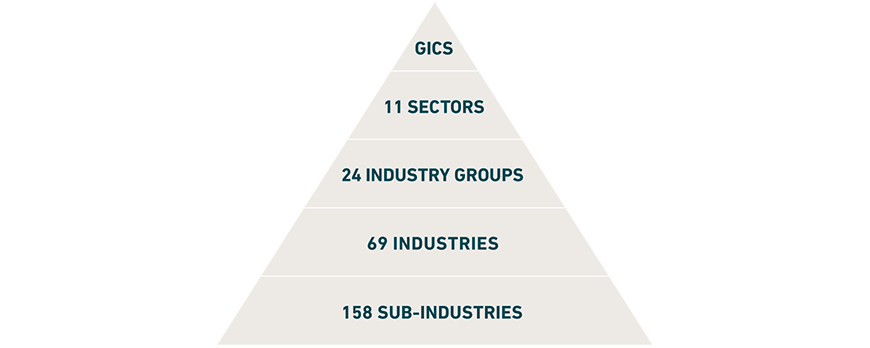
I see that now you have added the Industry filters. I would like to request if you can accommodate the GICS industry bench marking. This is a really useful classification and widely used by all major funds & major PMS’.
This will be an one time task where you need to map each company to one of the 69 industries (this constitutes the L3 values and the L1 and L2 classification will be derived from the hierarchies). Please refer the attached excel for details.GICS Details.xlsx (19.9 KB)
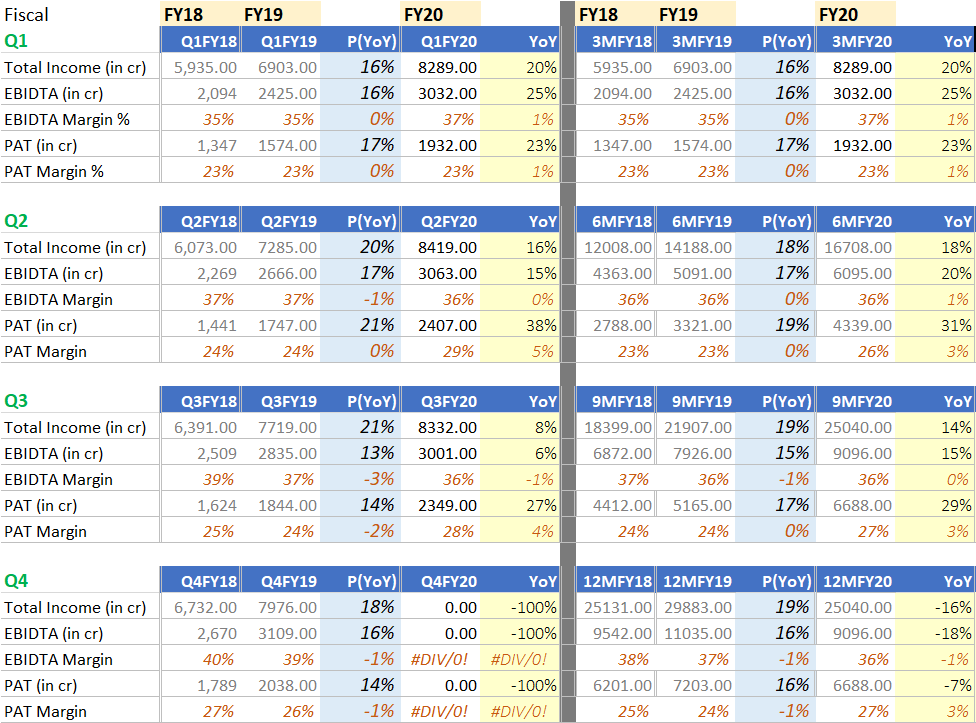
Team - one more request on adding a dedicated “Results tracking” tab.
Would it be possible to add this as a tab. All numbers in the following table are derived from the Quarterly Consolidated numbers (last 12 quarters). This is a very hassle free way to track QoQ and YoY results and we can automate this fairly conveniently.
Many cases it is important to consider the last 2 years as companies have windfall gains in the previous year and only looking at YoY creates a misleading picture. So P(YoY) the previous year’s YoY comparison gives a true picture and helps in the comparison.
Century Textiles is appearing under cement industry but the cement business is now sold to UltraTech. Can you please re-classify Century suitably? Thanks.
I was looking at Avanti Feeds and notice that in the Balance Sheet, the total liabilities and total assets numbers are exactly the same. It looked peculiar to me, so I checked other websites like Value Research and Morning Star but found different numbers. What do you think is happening?