Hi @wexler , Assets minus Liabilities = Equity. And if you reverse this equation Liabilities + Equity = Assets.
So in screener what you see is second part. It’s Liabilities + Equities = Assets
Hope this answers your question.
Hi @wexler , Assets minus Liabilities = Equity. And if you reverse this equation Liabilities + Equity = Assets.
So in screener what you see is second part. It’s Liabilities + Equities = Assets
Hope this answers your question.
@Parthgarg @ayushmit @pratyushmittal
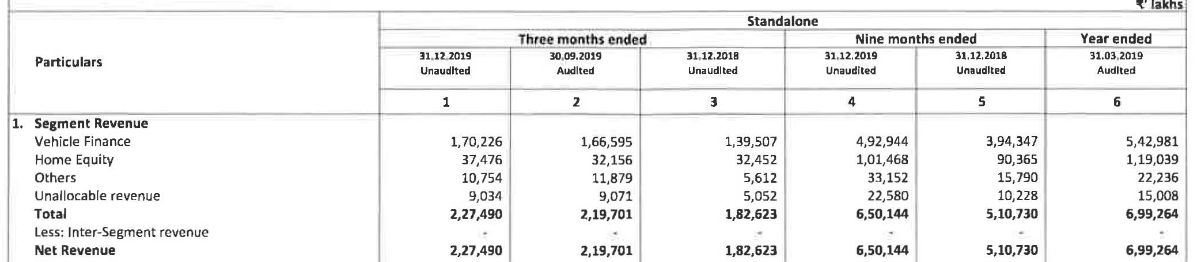
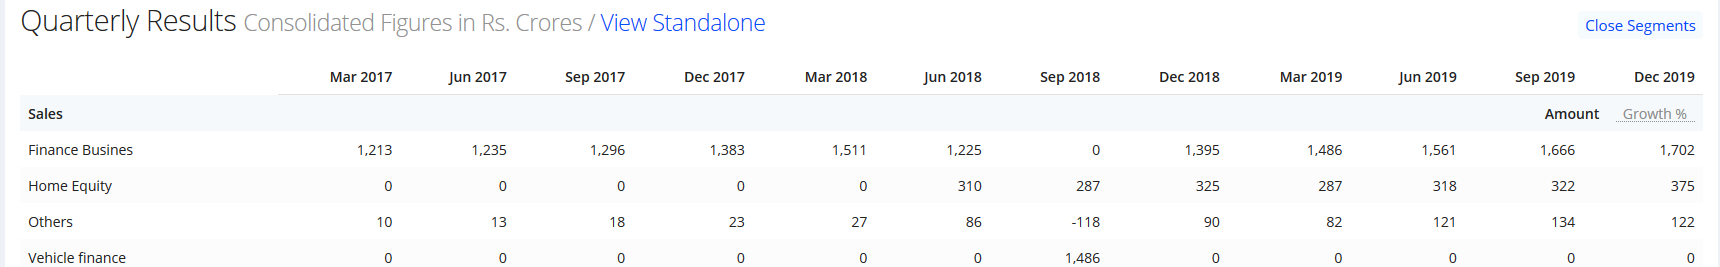
This is about Cholamandanalam Finance. There is discrepancy in the nos shown under various product segments as per screener and BSE disclosures. For eg, screener lists the revenue under VEHICLE FINANCE as zero while acc to BSE disclosures, it forms the highest % revenue. Pls check.
Hi @aswin
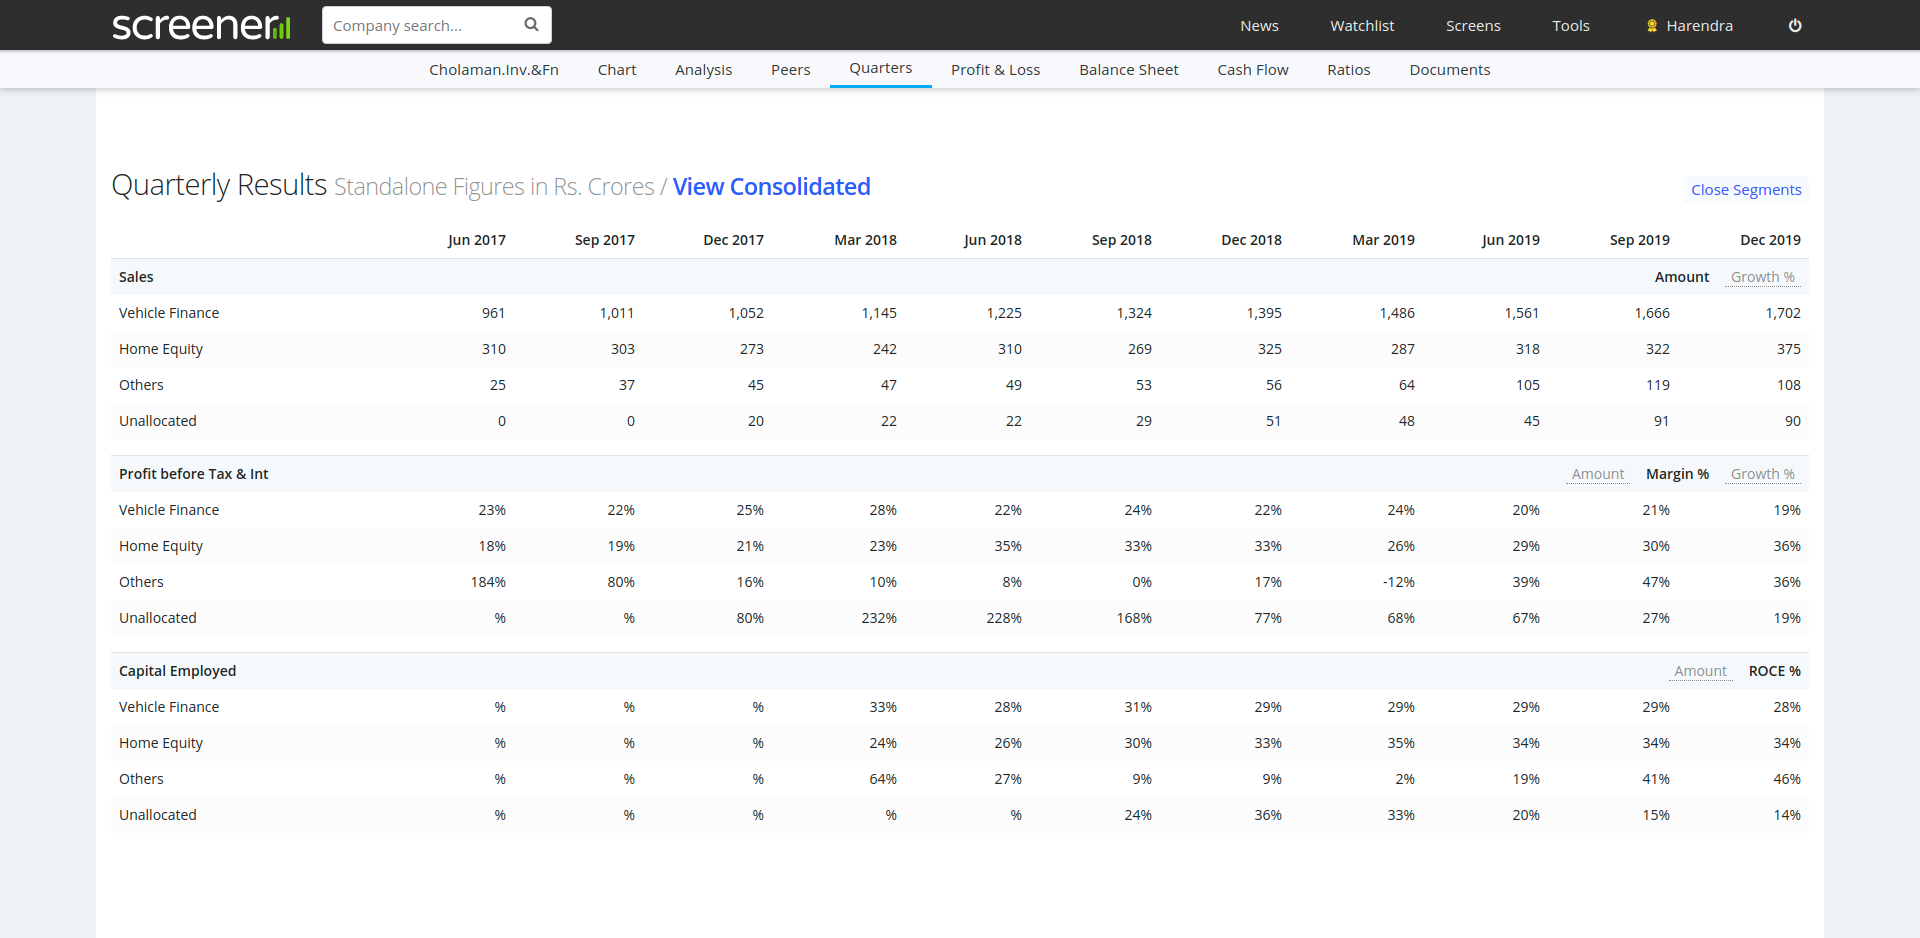
The disclosure you’ve mentioned is on a Standalone basis.
You may click on “View Standalone” option on Screener to see the respective revenue classification under “Vehicle Finance”
i saw your post asking about gurufocus.com .
i was thinking about paying the subscription of it,
have you used it ?
pls share your views about its paid subscription service, thanx.
Hello Team,
Is there shareholding change comparison with last quarter feature available in screener option? Not just promoter/non promoter % change,that is easily available in other apps. I want to see detail public shareholding change comparison.
Thanks.
Is there any way to check historical P/B ratio of a stock, just like we are able to check historical P/E ratio?
You can try ratestar.in
What’s the difference between: preceding year & last year data
For example:
Operating profit preceding year & Operating profit last year
Hi @sk20
Operating profit for last year is from the last reported year and operating profit preceding year is of a year before that i.e. penultimate year.
@pratyushmittal
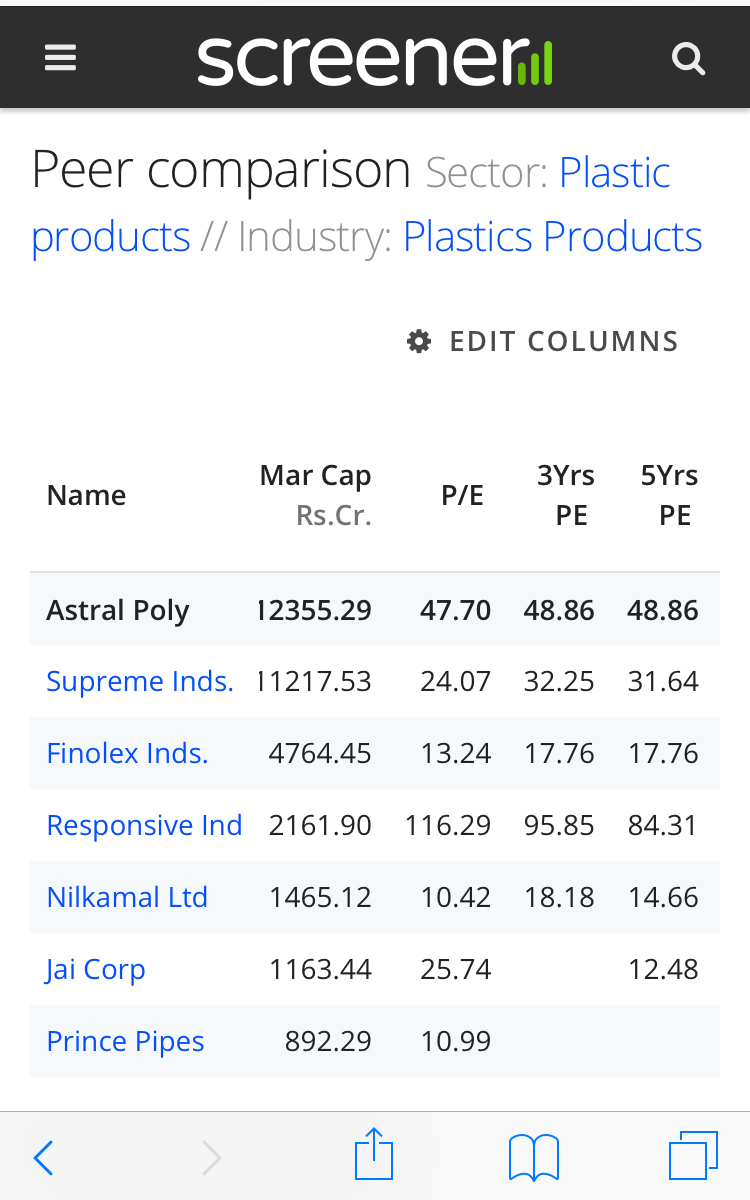
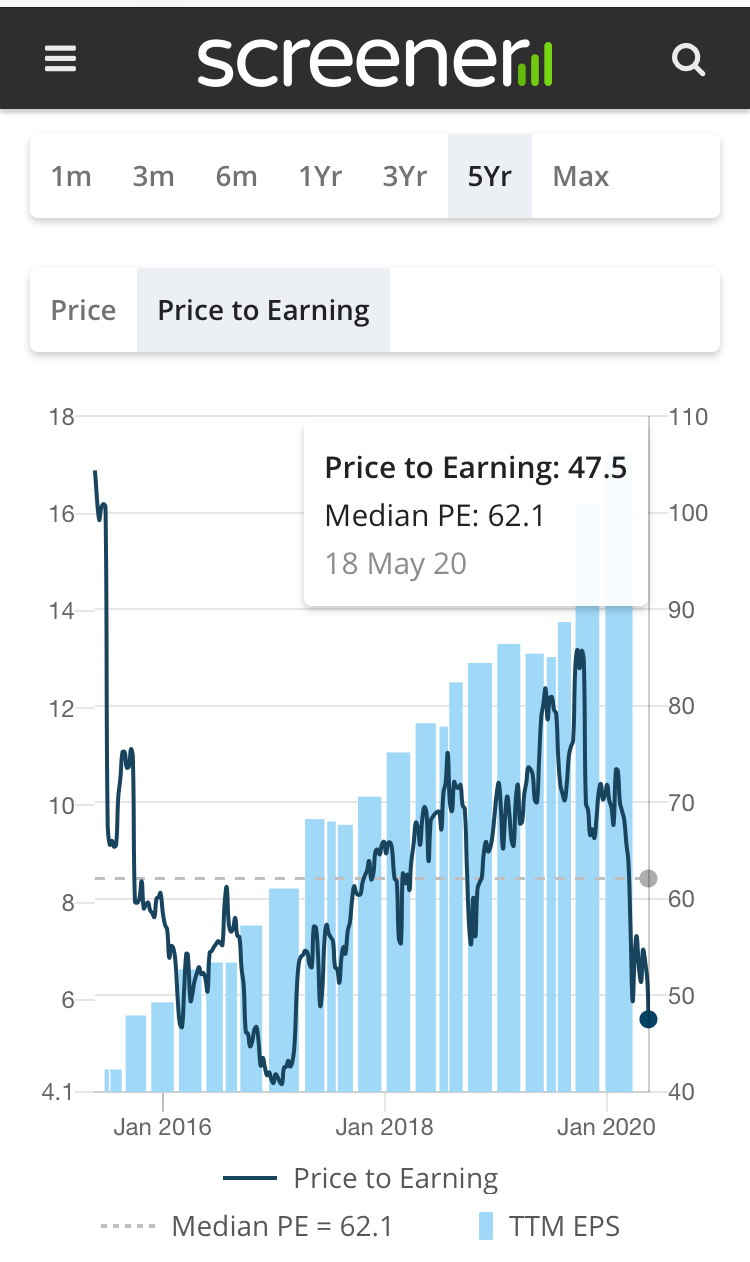
Can u please check the 3year/5year PE values, showing differently in chart and in peer comparison tables:
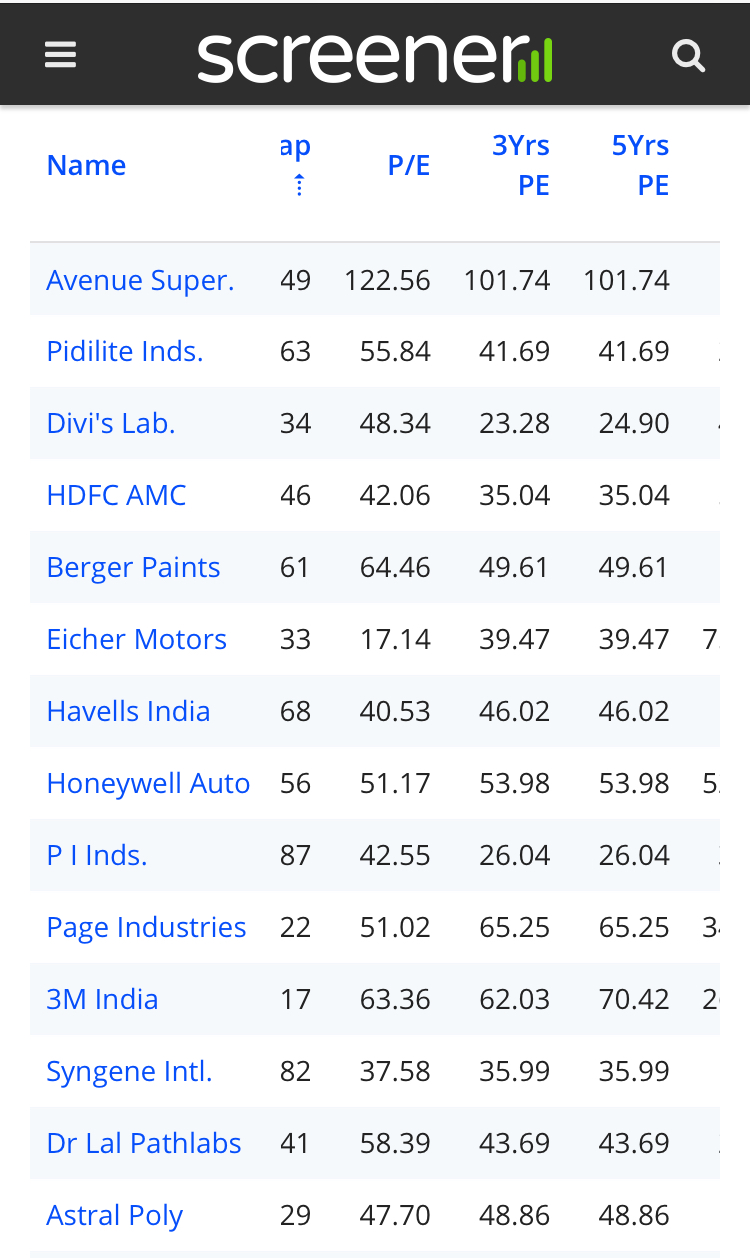
Below snap shots for Astral polytechnic., chart showing 5 year PE as 62.1 where as table showing 48.86, also the Peer table is showing same PE for 3y and 5y period.
Same issue with several companies 3/5Y PE:
Hi, is it possible to create a ratio to see Free Cash Flow growth over last 3, 5, 7, 10 years?
Hi, Screener provides you with Free cash flow 3, 5, 7, 10 years.
So by using this data you can always create your own ratio.
Click on this link to create your own ratio
https://www.screener.in/ratios/
Hi,
I follow and hold KEI industries (10% of Portfolio).
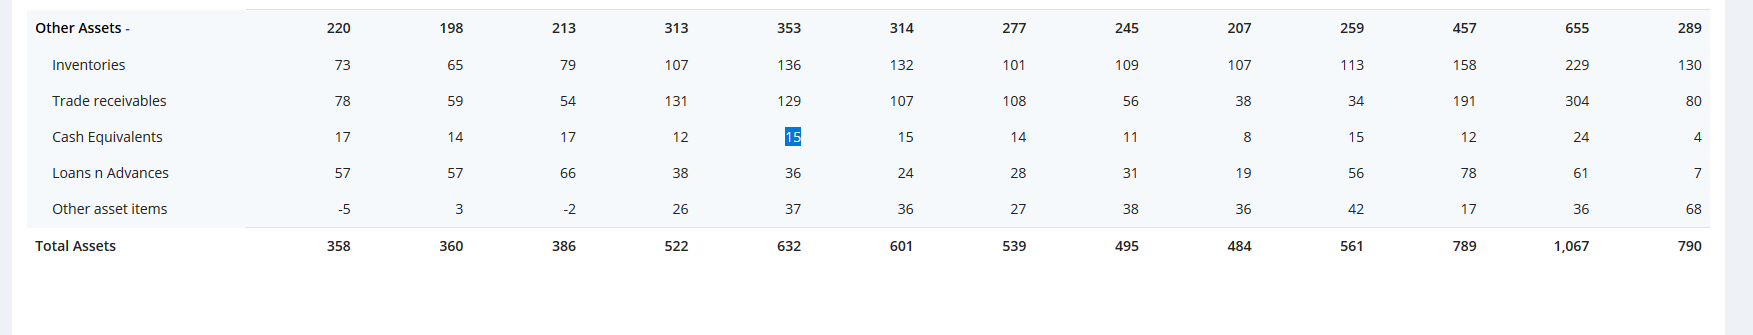
Going through screener.in data (https://www.screener.in/company/KEI/) shows the trade receivables for 2019 listed as 1095 crores.
However in reality the number is 109.5 crores as per the annual report (https://www.bseindia.com/bseplus/annualreport/517569/5175690319.pdf) page 120 of the annual report (page 123 of PDF). Note that this discrepancy is possibly because the annual report reports figures in millions. Can someone please fix this bug, and also fix similar bugs for other companies as well? What would be the best way to follow up and ensure that this gets fixed?
The number in annual report is same as screener.(10946.22 Million = 1094.6 Crore). The balance sheet will not balance if the numbers vary so much.
You’re right. Apologies for the incorrect reading. Everything looks good
That comes from the Annual Report.
I receive screener alerts in email with few stock names, frequently. Wanted to double-check, are these new entries in the screen that I have made? Also, the stocks exiting the screens are not in scope of these alerts right ?
Would be great to know, from fellow members on their take on Screen alerts.
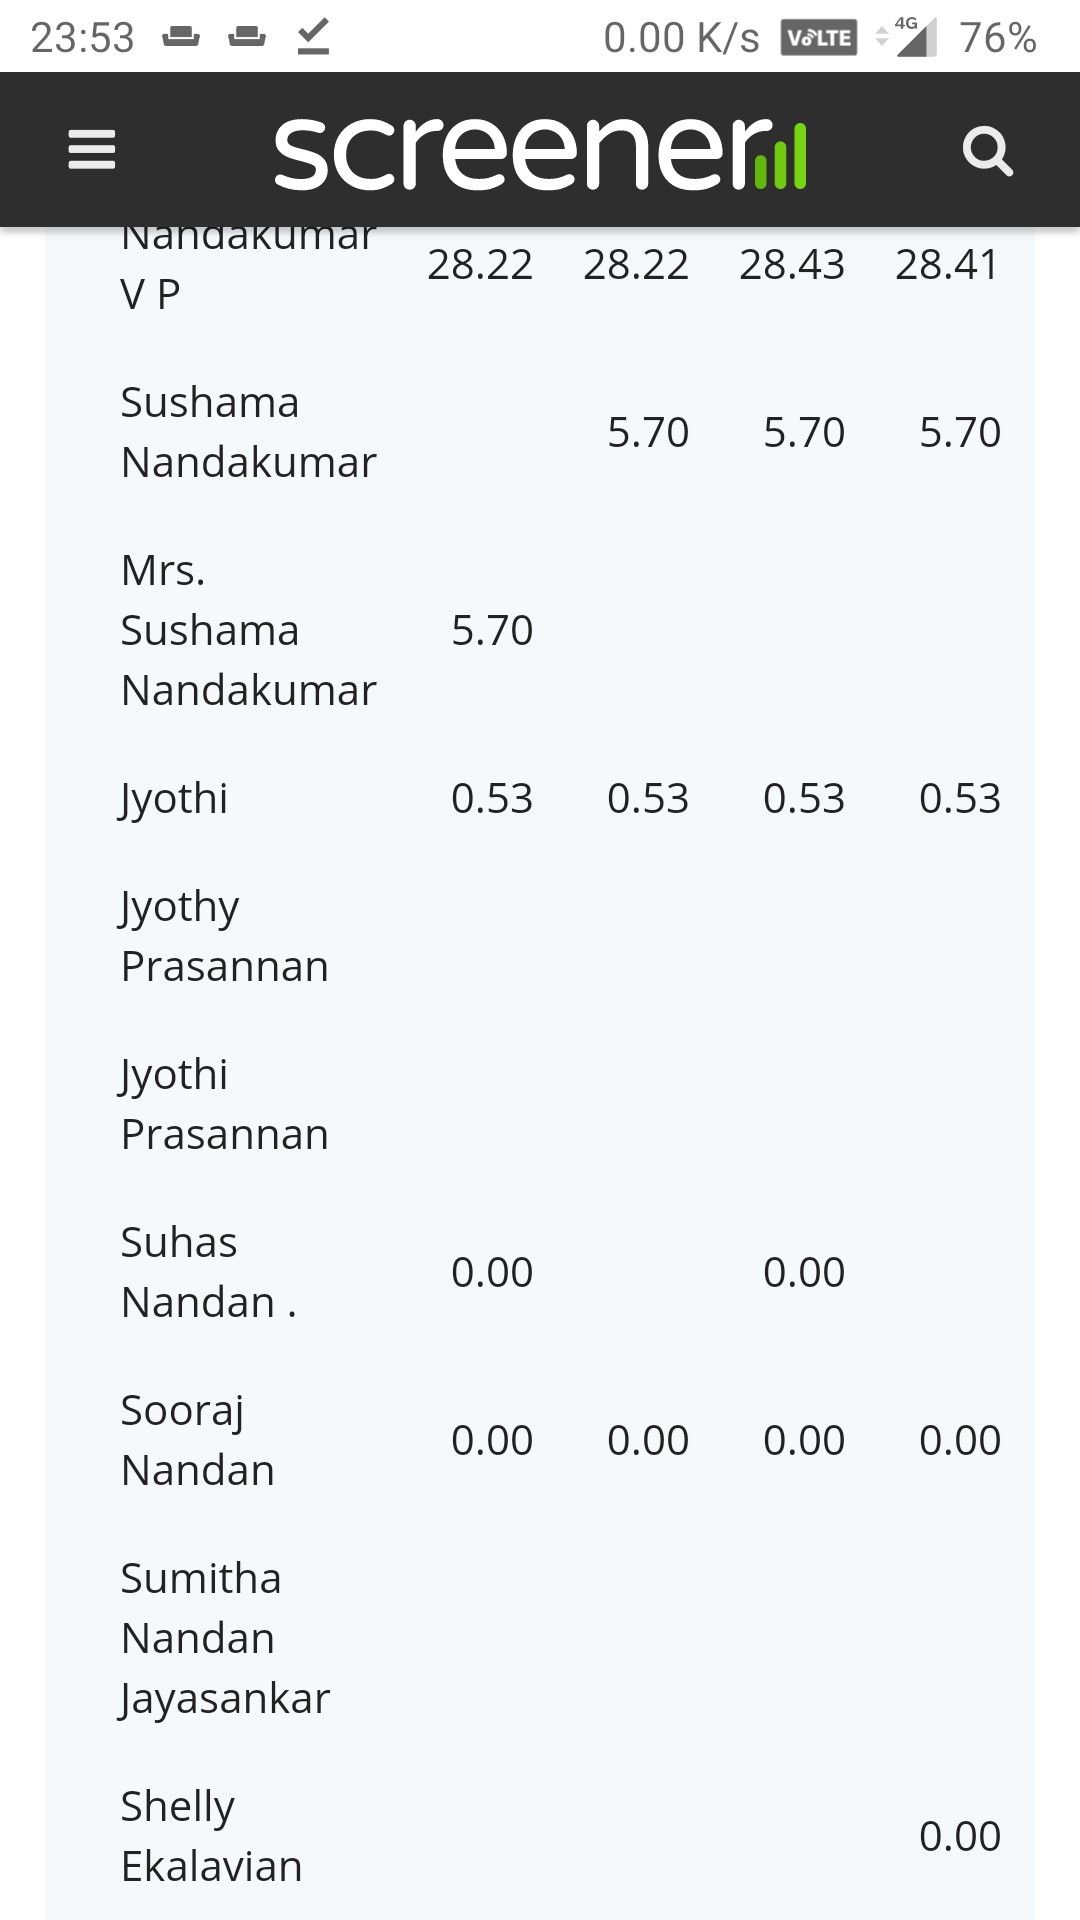
In Manappuram’s promoter shareholding section names are repeating often with minor changes like Mr, Mrs etc. because of which a lot of unnecessary rows exist. @pratyushmittal request you to address this for easy readability sir! ![]()
Yeah, we are working on an algorithm to merge such cases.
Thanks for reporting it ![]()