I have amalgamated data from various sources in one place.
SBI Cards & Payment Services – Charting through History
Let us discuss some metrics of the newest IPO in town. As the heading of this post suggests, we are going to do this through lots and lots of charts. WordPress has a bad habit of compressing images beyond recognition. I will share a repository of all the chart in full resolution at the end of the post. You can download that and read the blog side by side to make sense of it all.
Cards in Force (CIF) Segmentation
Chart 1 – Percentage of total cards in force (CIF) sourced from SBI parent is increasing while the premium portion of customers is decreasing. Mining SBI customers for card issuance is neither good or bad. Other issuers are dependant on their parent banks for the same, just that they haven’t carved out the cards business into a separate entity.
Customer Profile
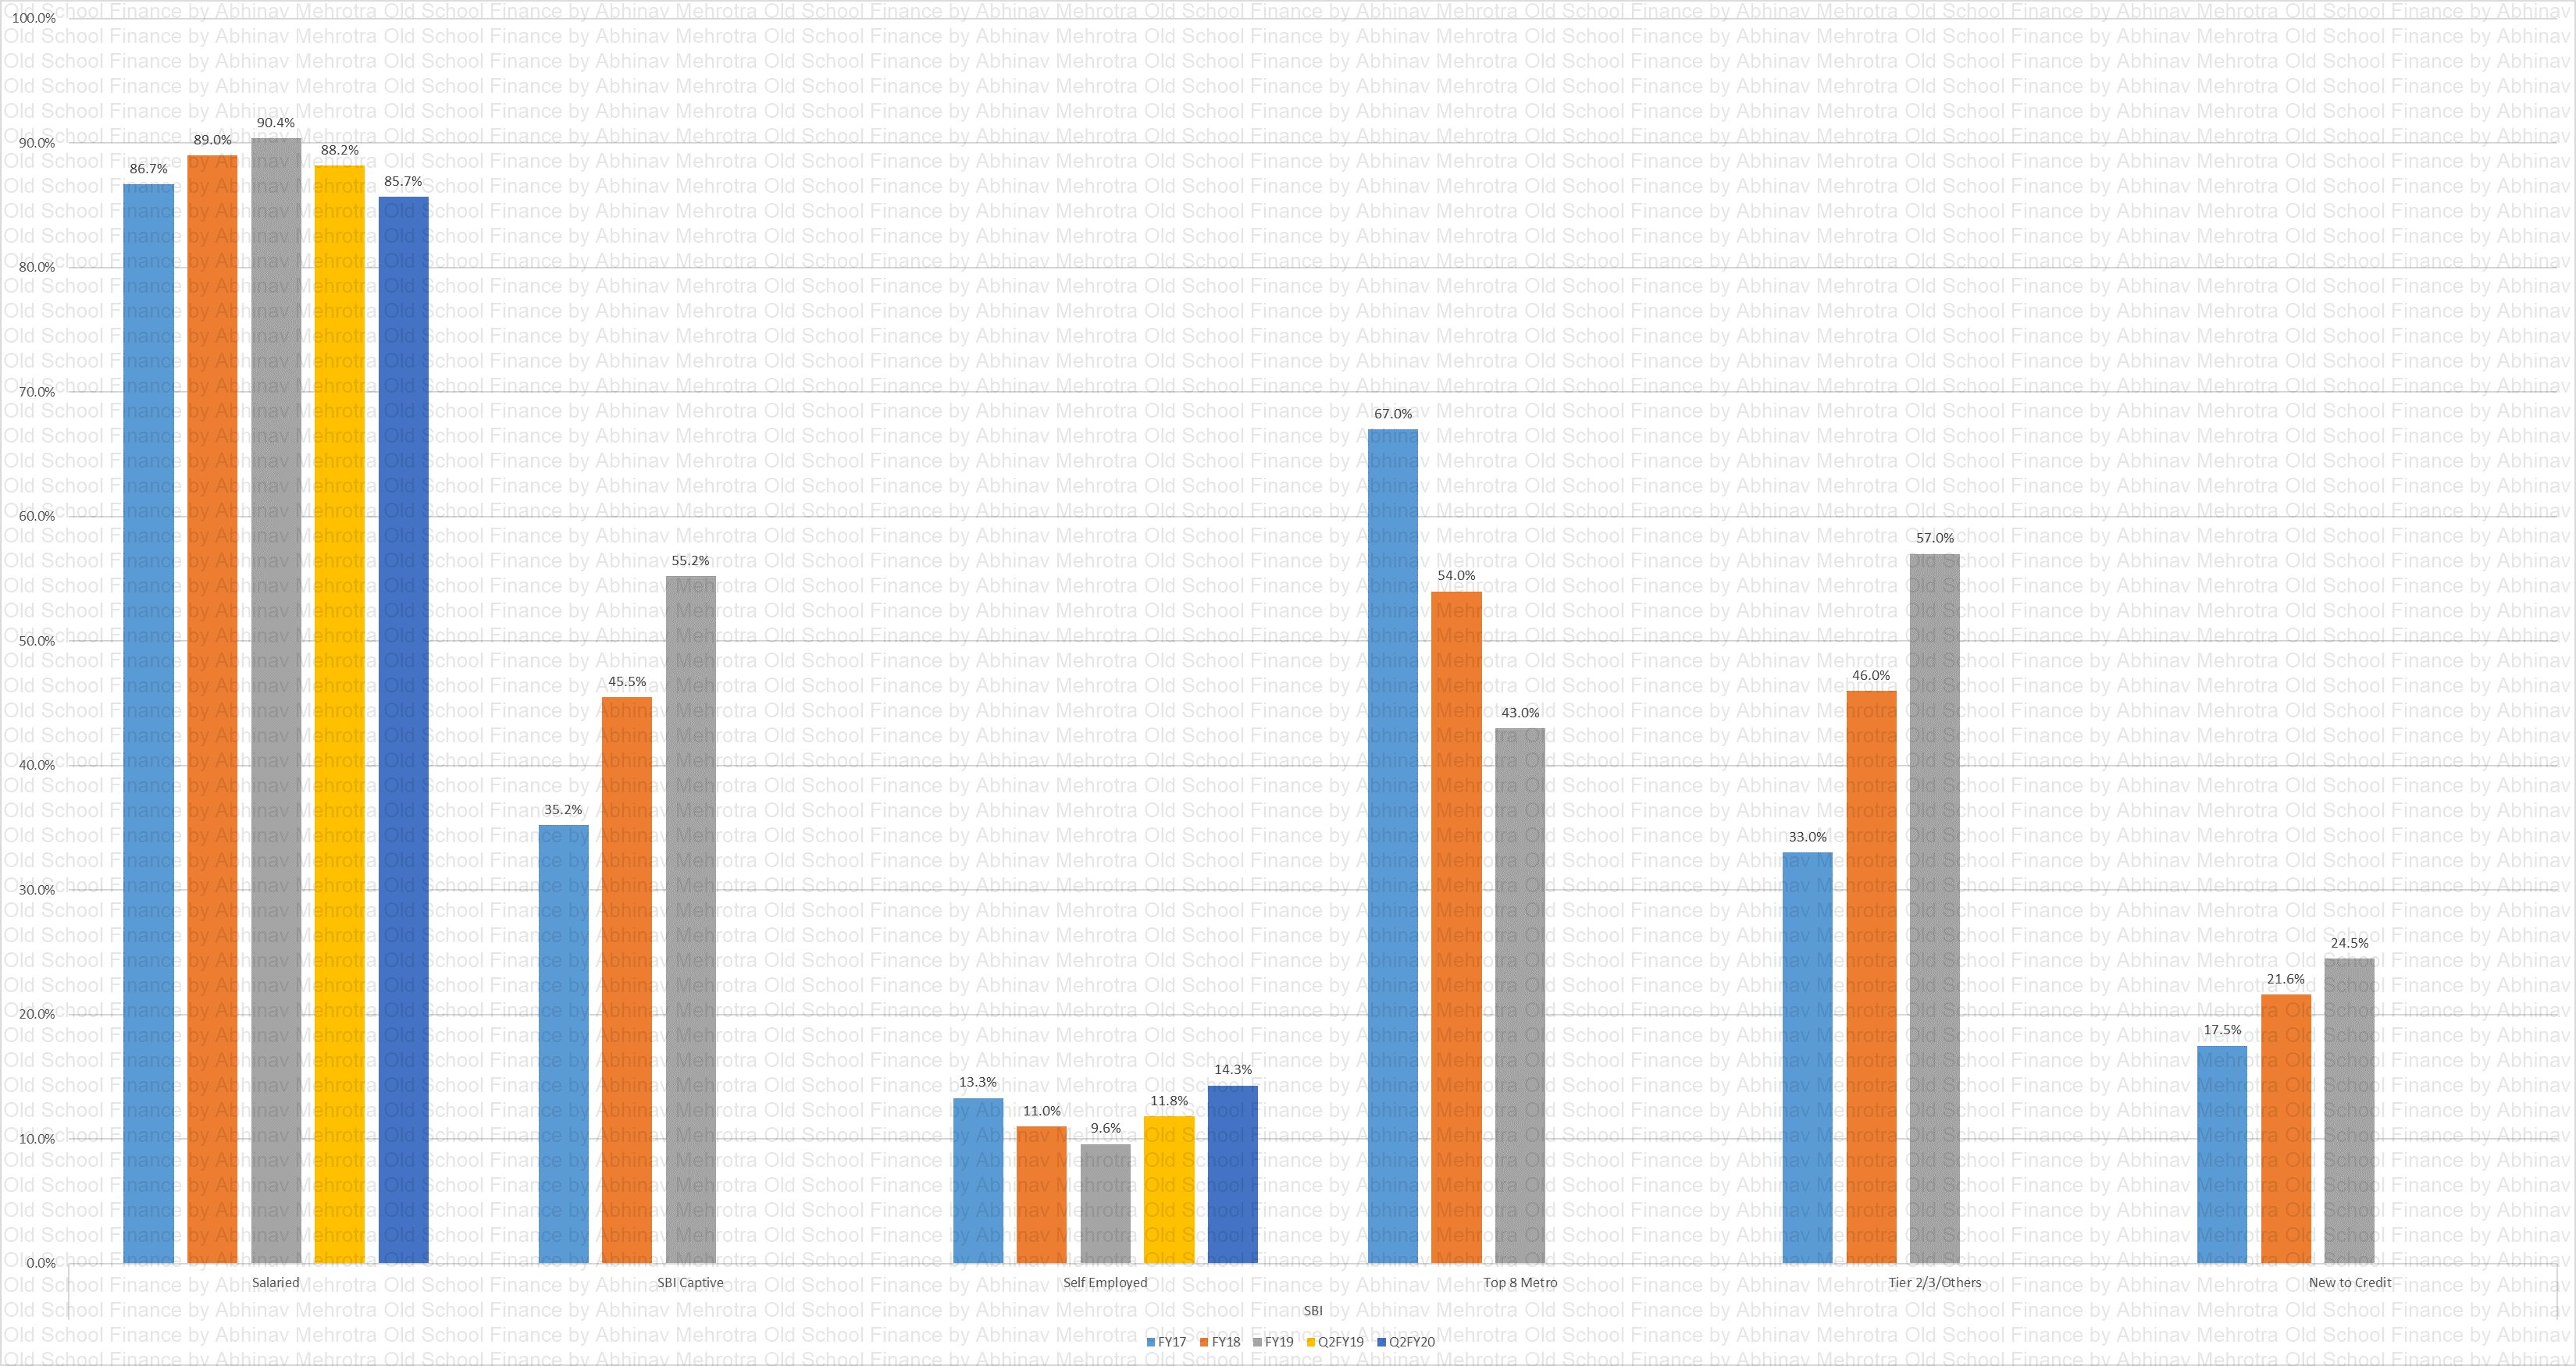
Chart 2 – Percentage of new customers sourced from the parent has increased significantly. We will have a deeper look into this opportunity in the next chart. Segmentation between salaried and self-employed are mostly stable. With the amount of data available with Credit Bureaus today, the self-employed segment is not as risky as it used to be. Pair that with the spending behaviour data from the parent and one should be able to underwrite their loan book fairly safely.
As for geographical segmentation, in the past few years, more of the new accounts are sourced from non-metro cities. These new customers will not necessarily be of the same spending capacity as those in the metros, which should reduce the per card metrics in the coming years.
Percentage contribution of new to credit customers in new customer acquisitions is increasing. For these new to credit customers with little or no credit history, strong underwriting risk management needs to be maintained with smaller credit limits. We should track this with average credit limit per card, any aggressive growth in this parameter should be tracked closely.
CC/DC
Chart 3 – Depicts the ratio between the issuers Credit Card (CC) and Debit Cards (DC). RBL is the new outlier here building its CC base before its DC base. Ignoring RBL and comparing to the other top competitors, there are good arguments to be made that SBI Cards can tap into the SBI banks customer base to improve their CC base for a good amount of time. Industry average being low single digits signifies that other smaller card issuers are skewing the averages.
That being said, the customer profile of SBI and other top private banks will be very different and if SBI’s customer base is skewed towards the elderly, retired or lower-income customers, the utility to tapping parent customer base will dwindle significantly.
I will discuss more industry dynamics at the end of the post.
Receivable
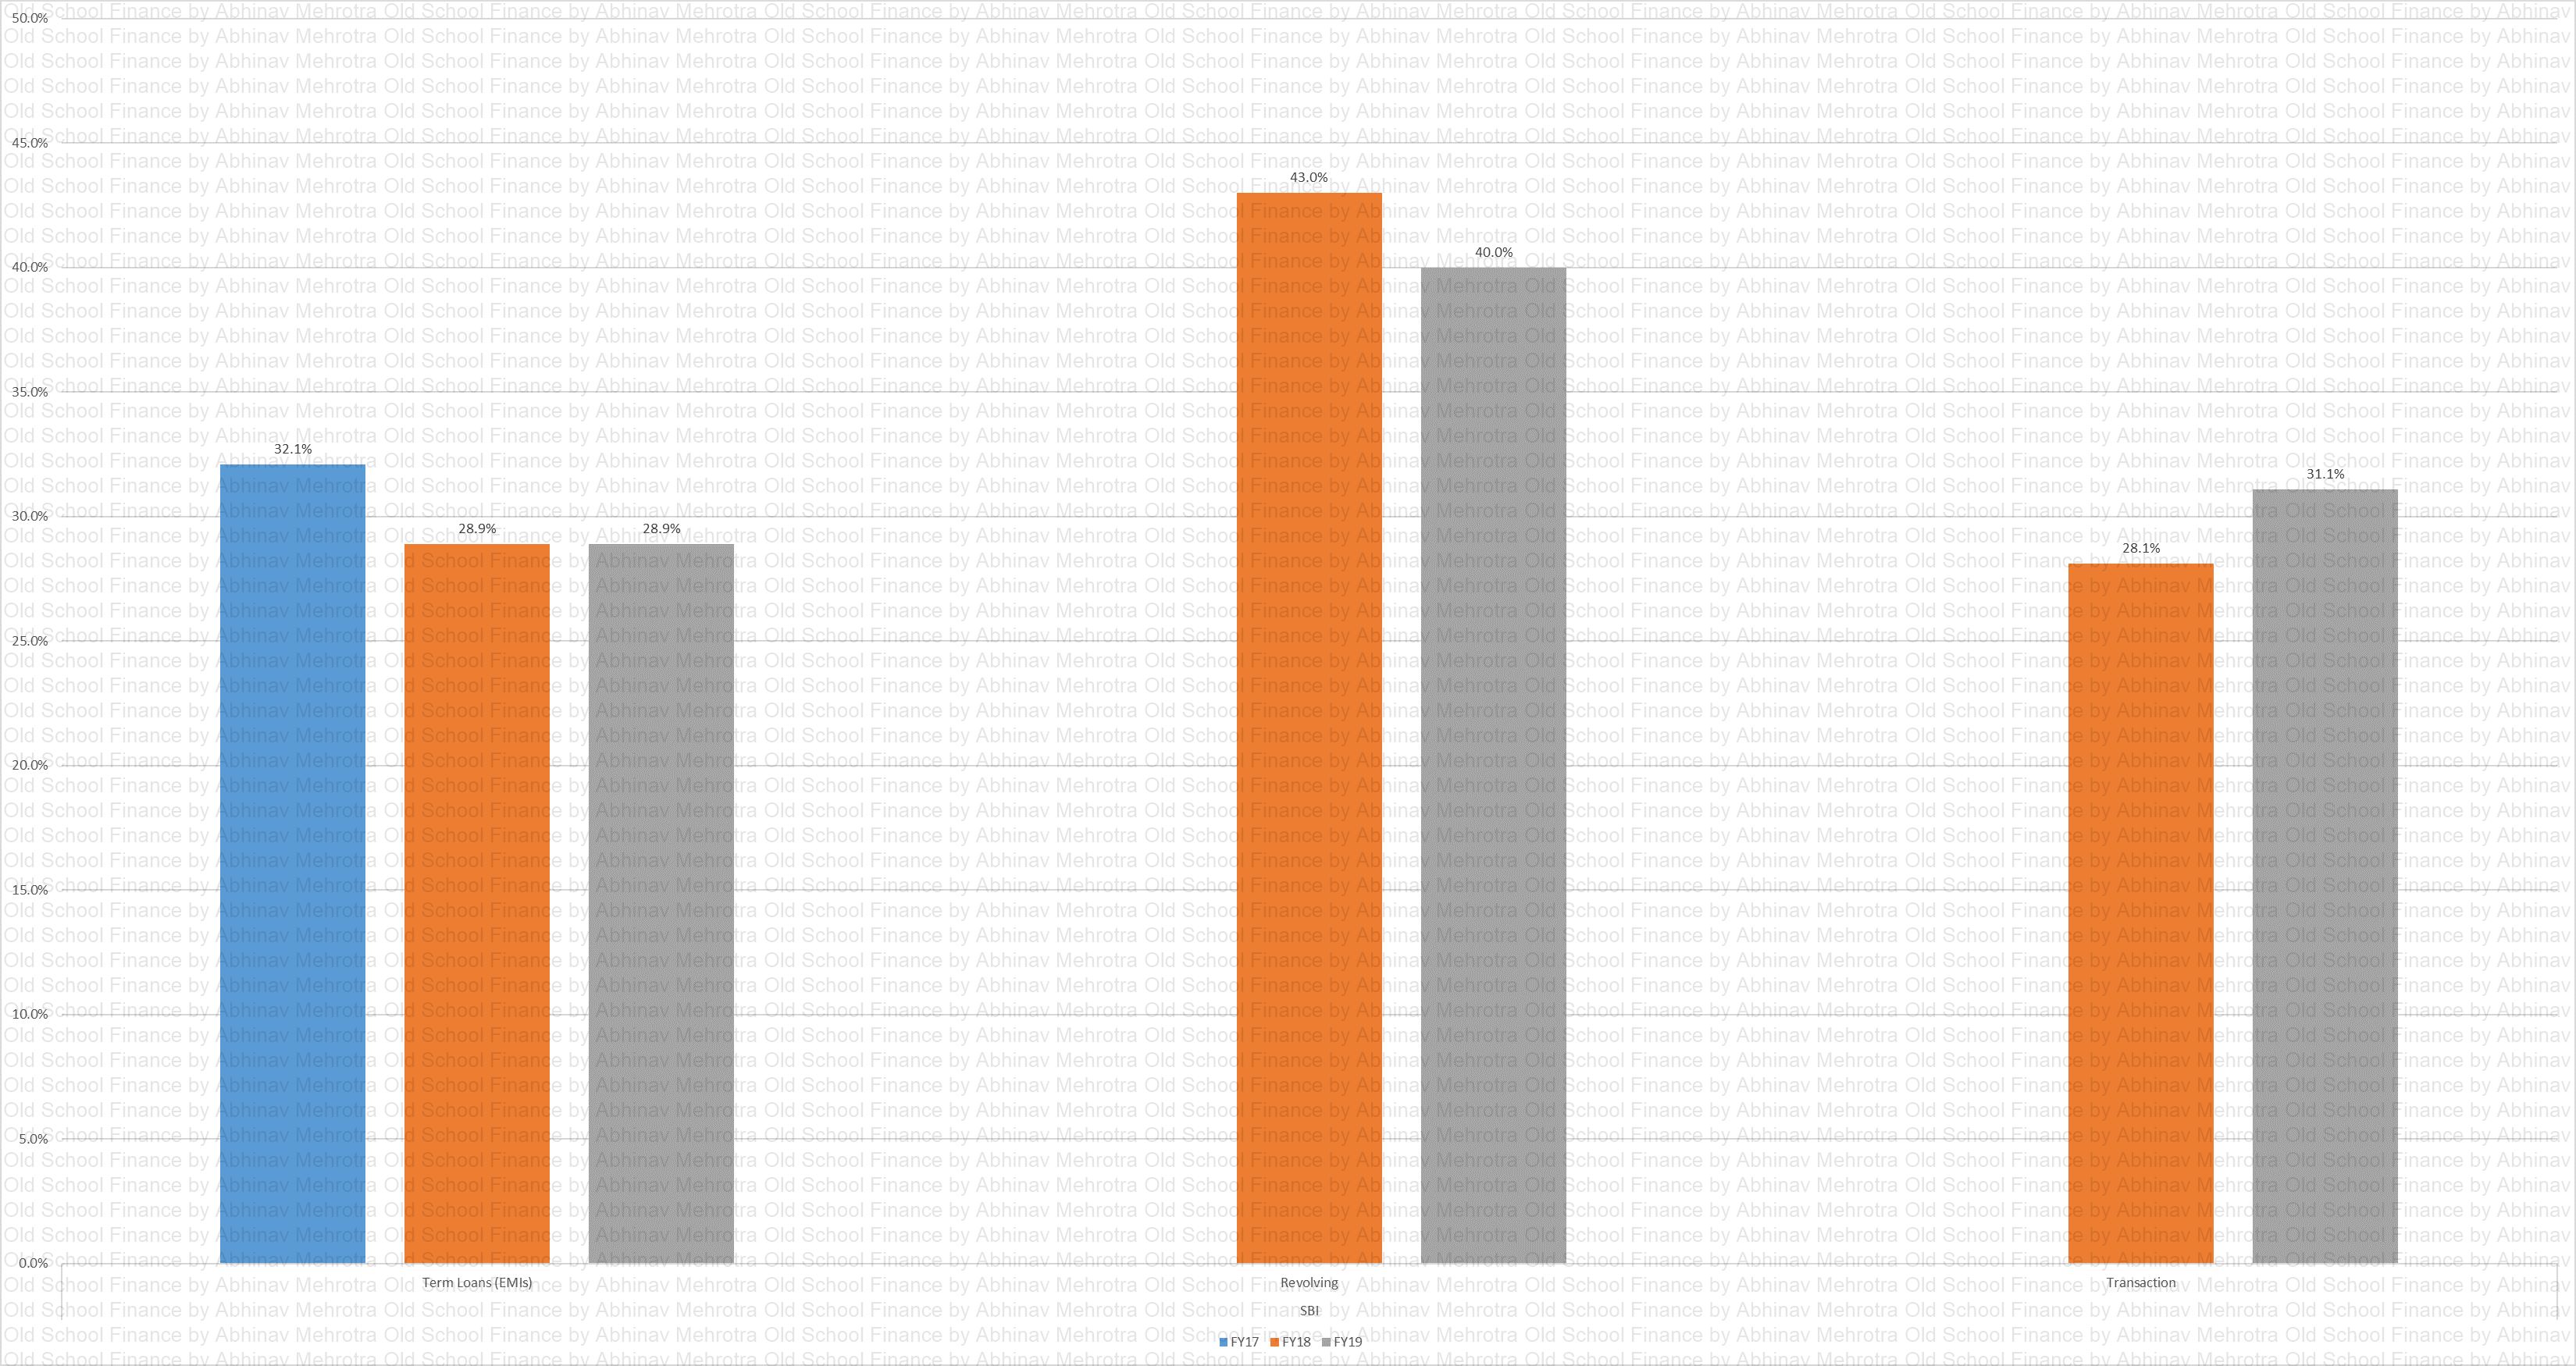
Chart 4 – Depicts the % of receivables from EMI loans, revolving credit and transaction-related fees. The yield on revolving loans is the highest, as a shareholder one can cheer for this metric to rise, but as a fellow human one should never wish for another human to fall into this trap of compounding interest.
Active Cards
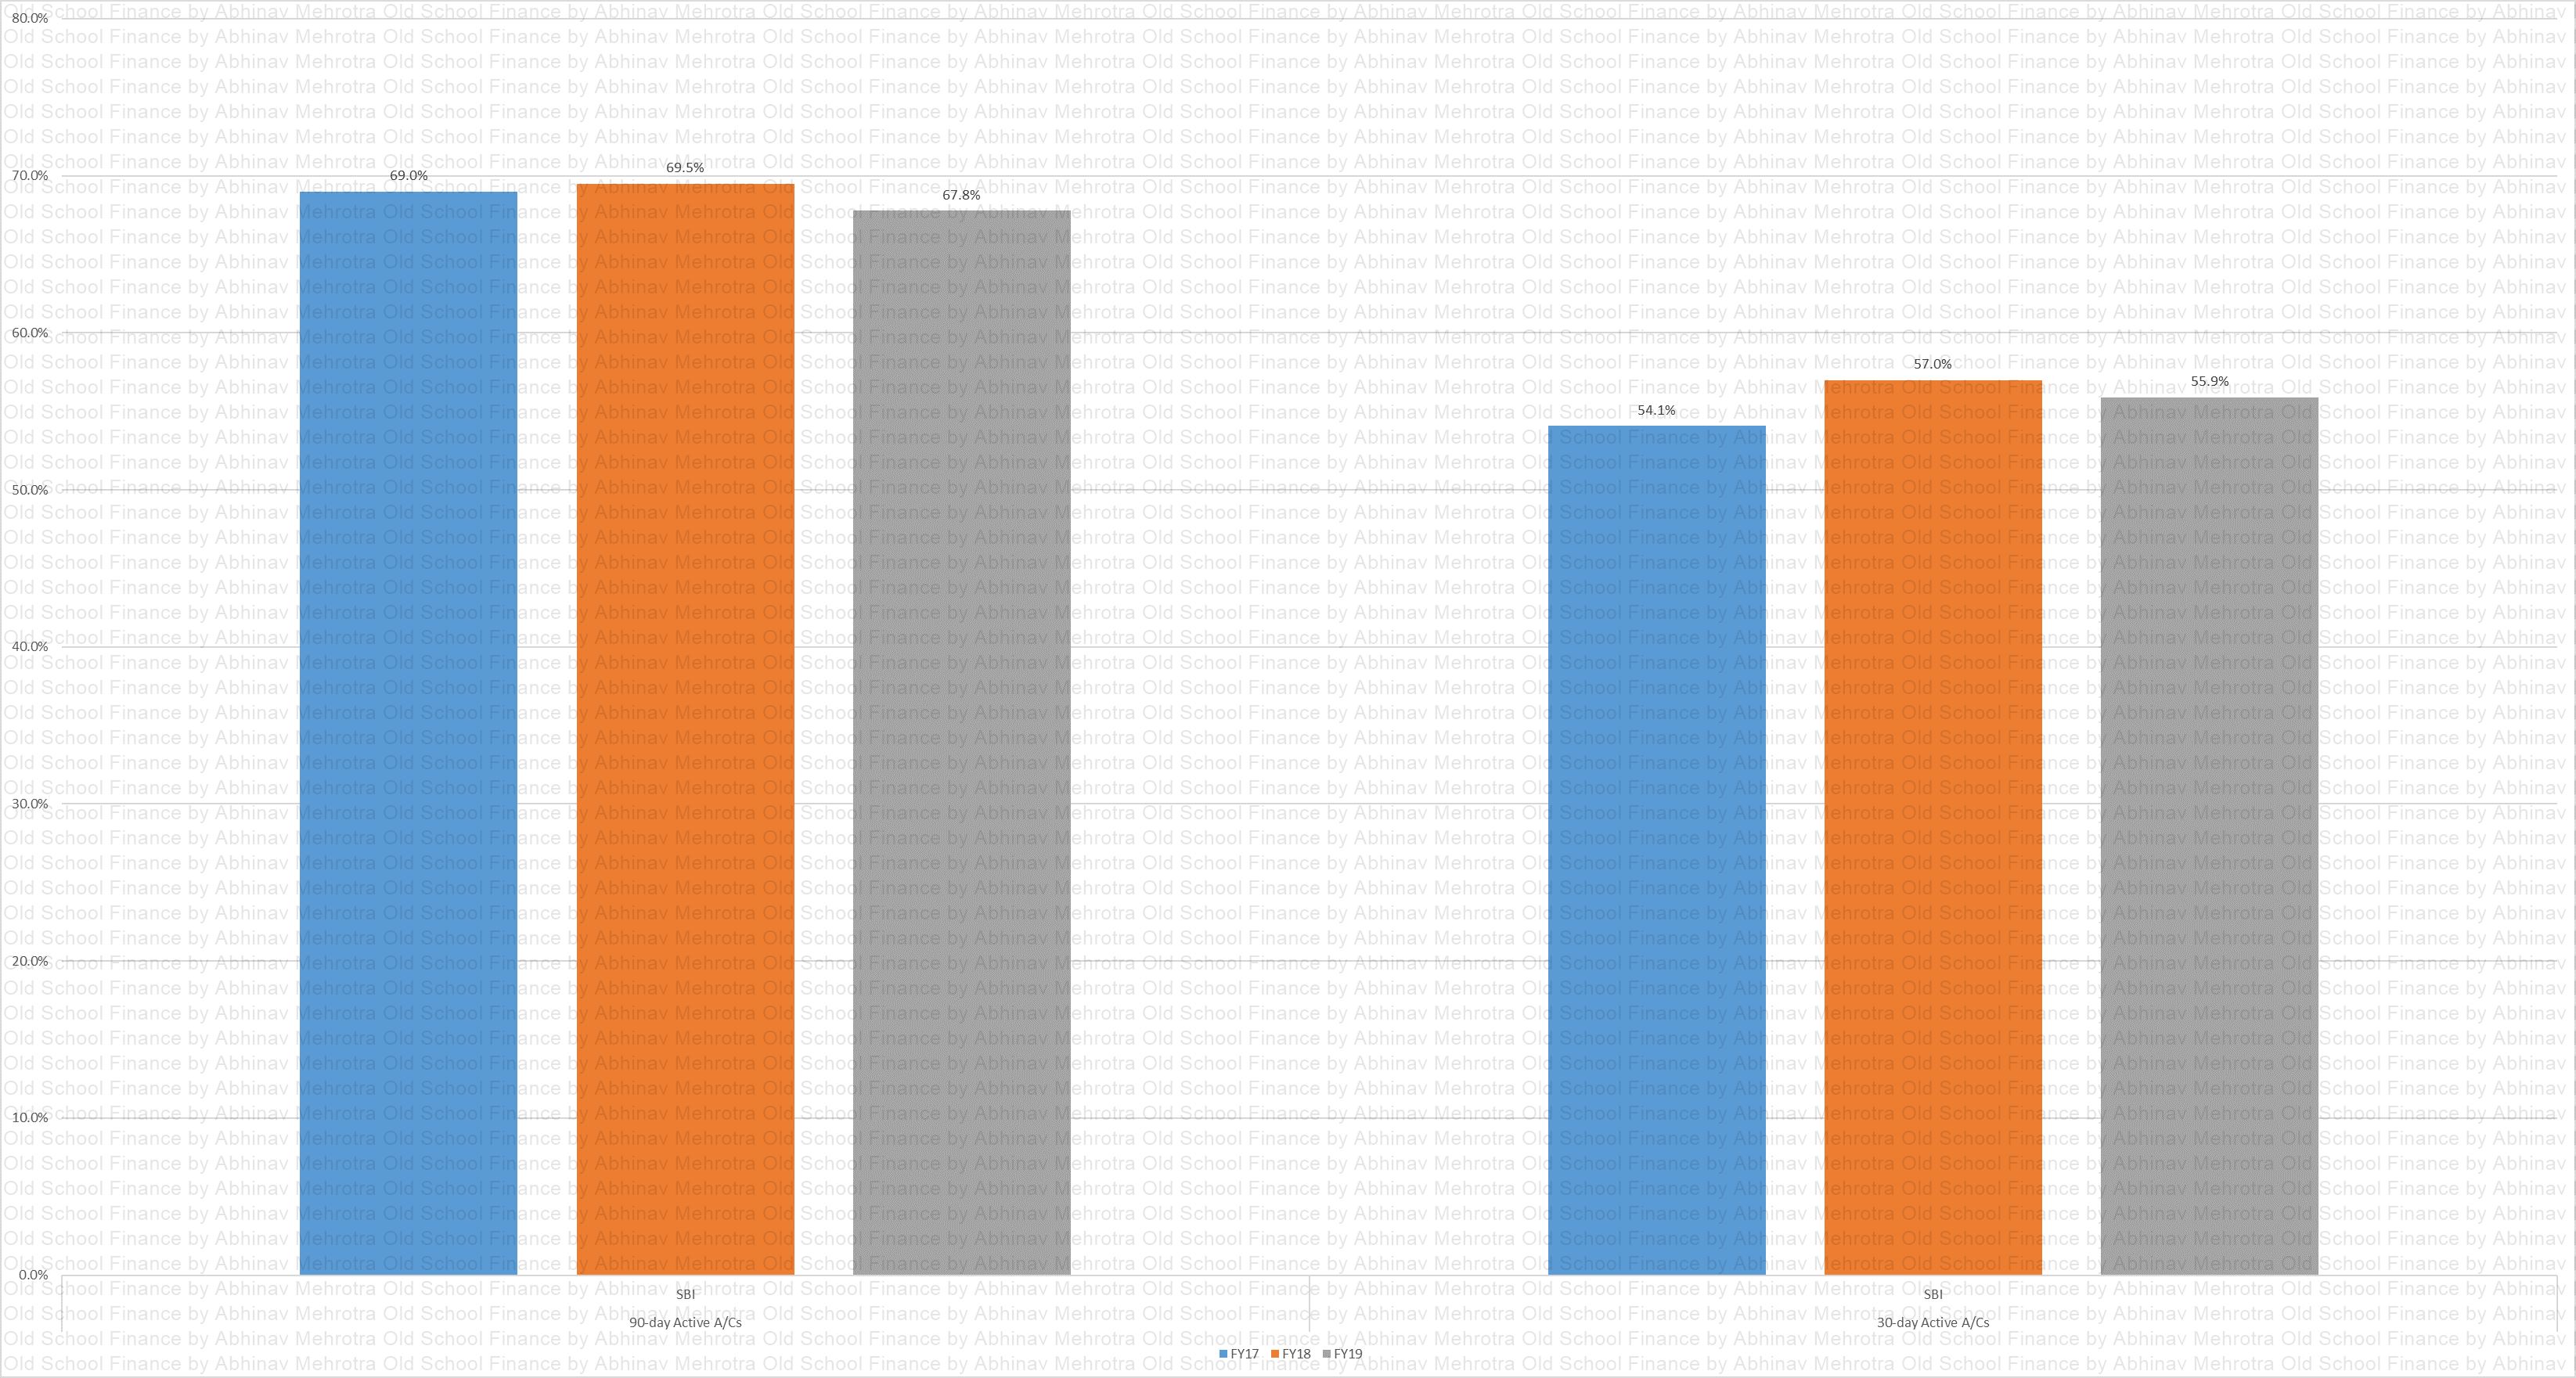
Chart 5 – Percentage of CIF that were used at least once in the past 30, 90 days. Comparison with competitors is necessary to form a baseline.
ABS Rev Seg
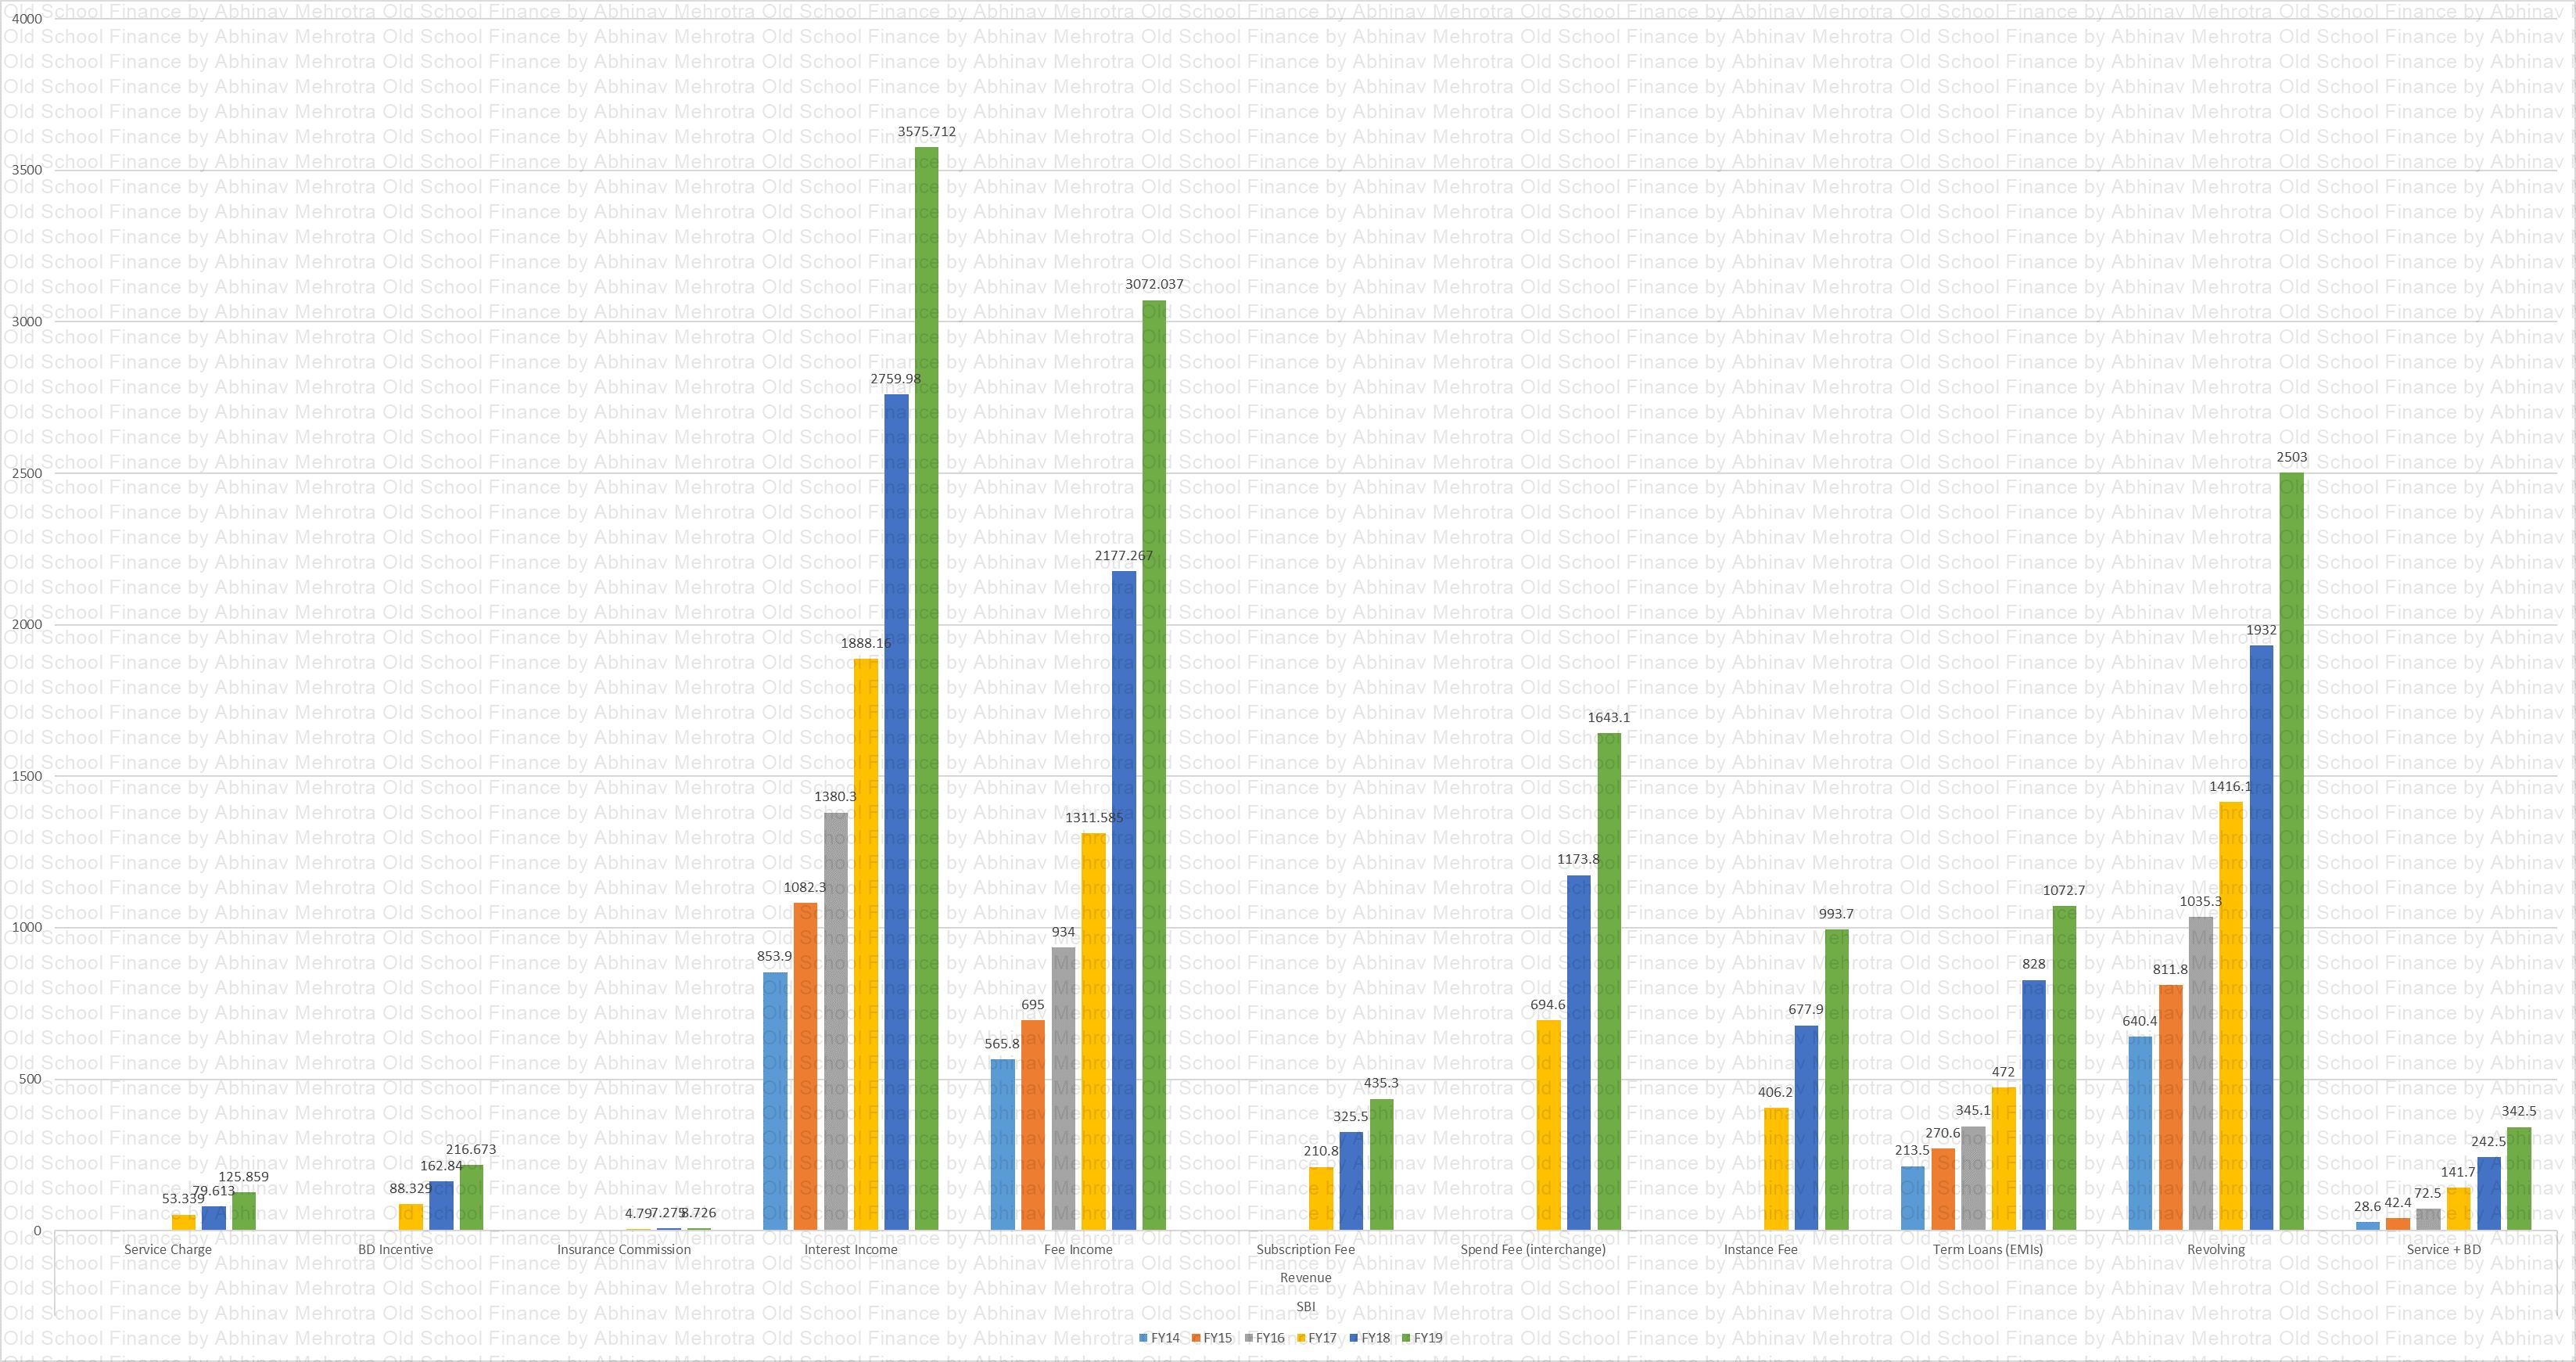
Chart 6 – Breakup of revenue streams from different segments. Majority of income coming from interest earned and fees. In interest income, the majority of it is coming from revolving loans. In my view, this is not sustainable in the long term. Customers are paying exorbitant interest rates on these revolved loans, and they will eventually either default or clear them but once bitten they will not extend the loan on CC. Yes, this metric can continue growing till they keep finding new customers who don’t know painful the interest payments revolving loans are, but what damage does it do the long term relationship with the customer.
Another risk is the regulator limiting the interest rate on these loans when CC penetration reaches high levels and enough people are affected by these. It is better to build an EMI book and fee-based income stream than the revolving loan book.
In fee-based income, the fee is earned from annual card charges and transaction-based fee. The more the customers will swipe their card the better it is for the company.
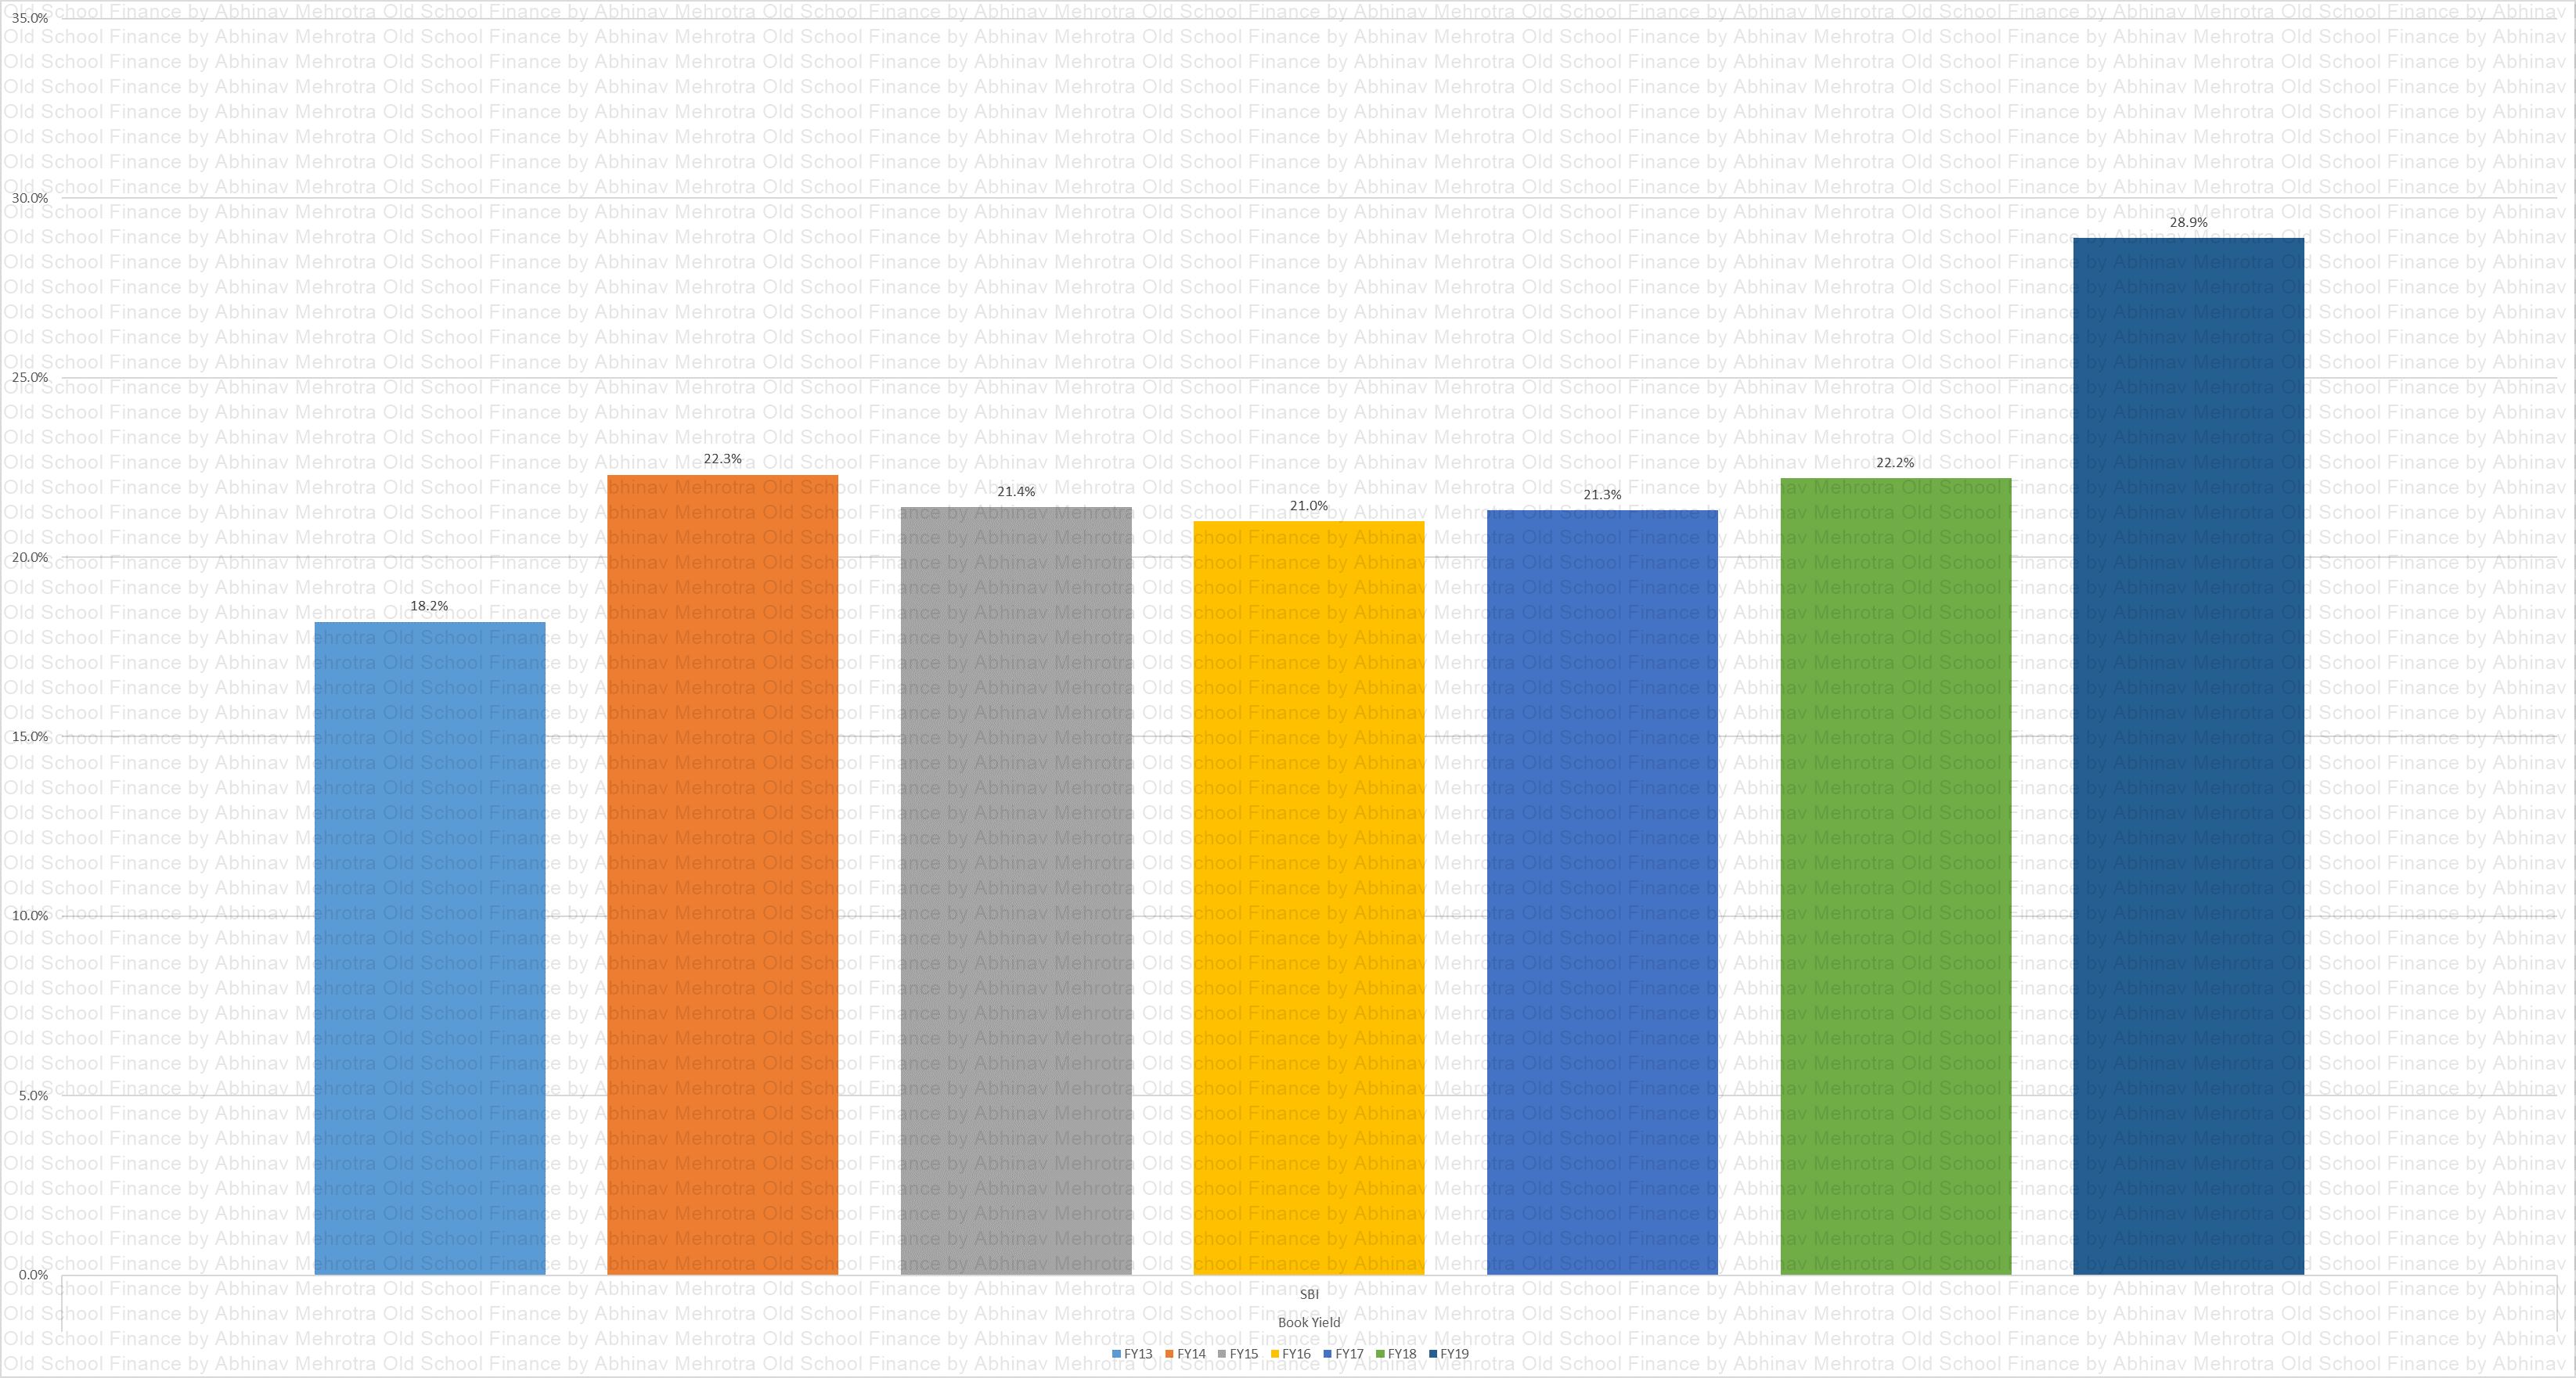
Book Yield
Chart 7 – Book yield has been maintained in the past, not entirely sure of the cause for the recent increase in FY19. Will have to monitor whether this is sustainable.
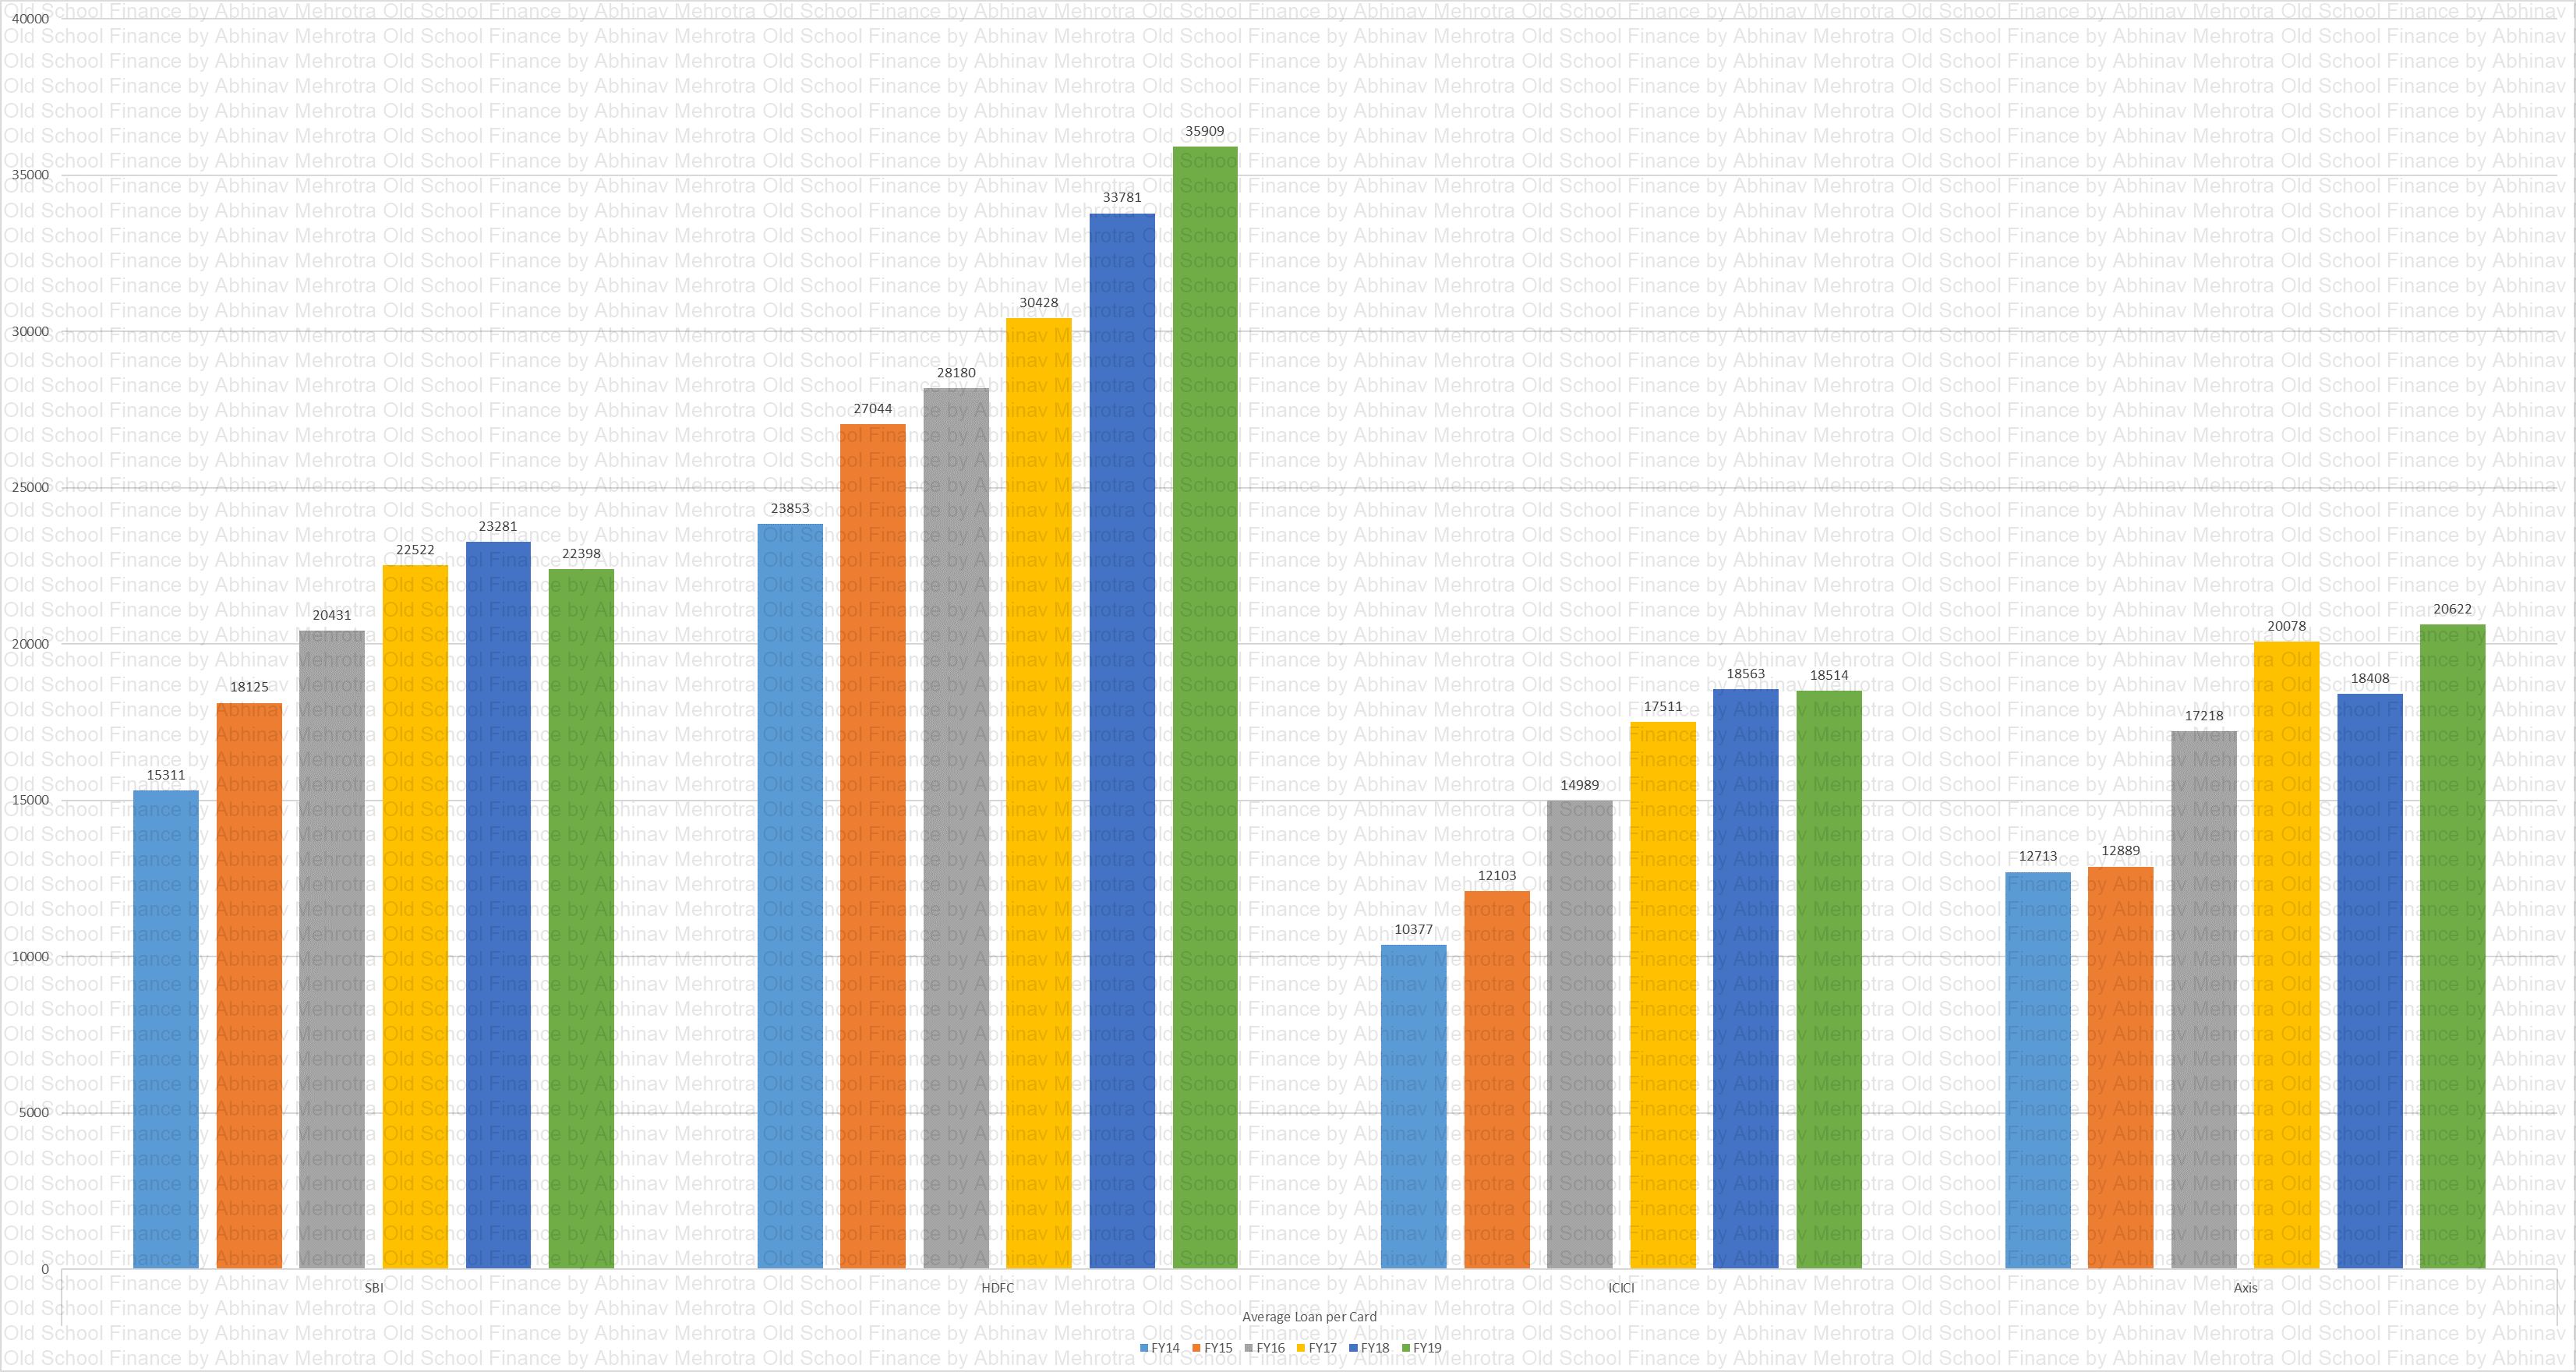
Average Loan per Card
Chart 8 – Depicts the average loan outstanding per card for the top issuers in India.
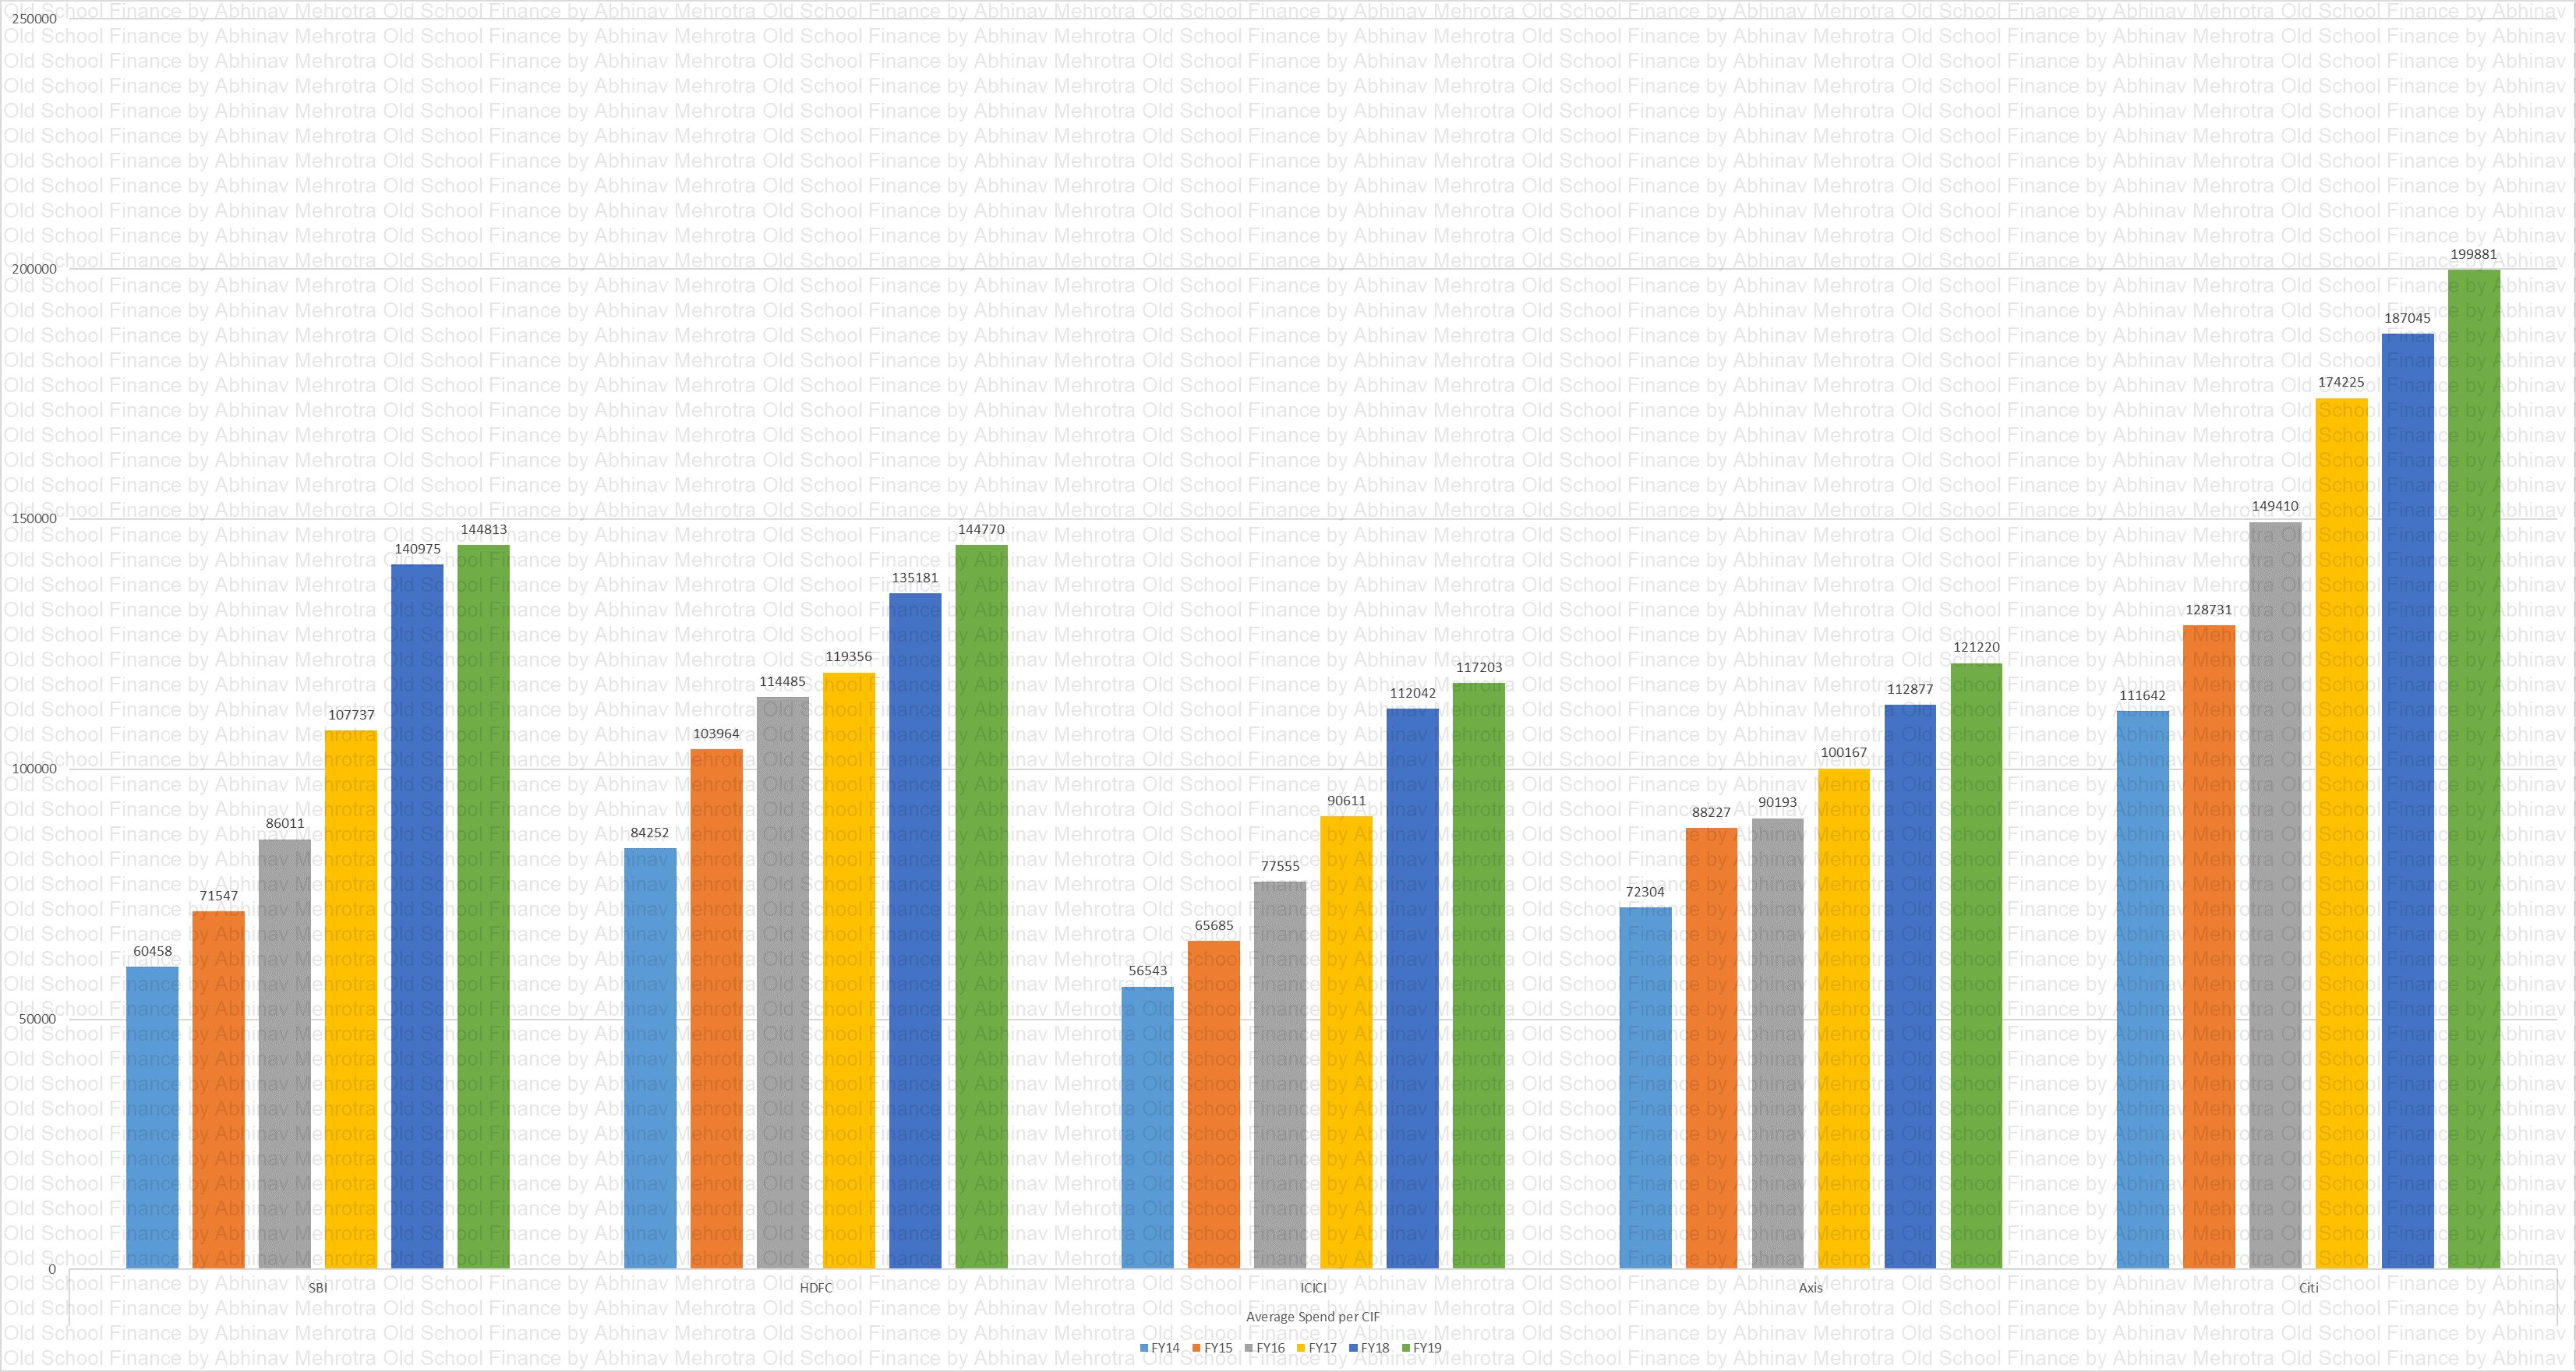
Average Spend per Card
Chart 9 – Average annual spend per card for the top issuers in India. Citi seems to have a good chunk of prime spending customers.
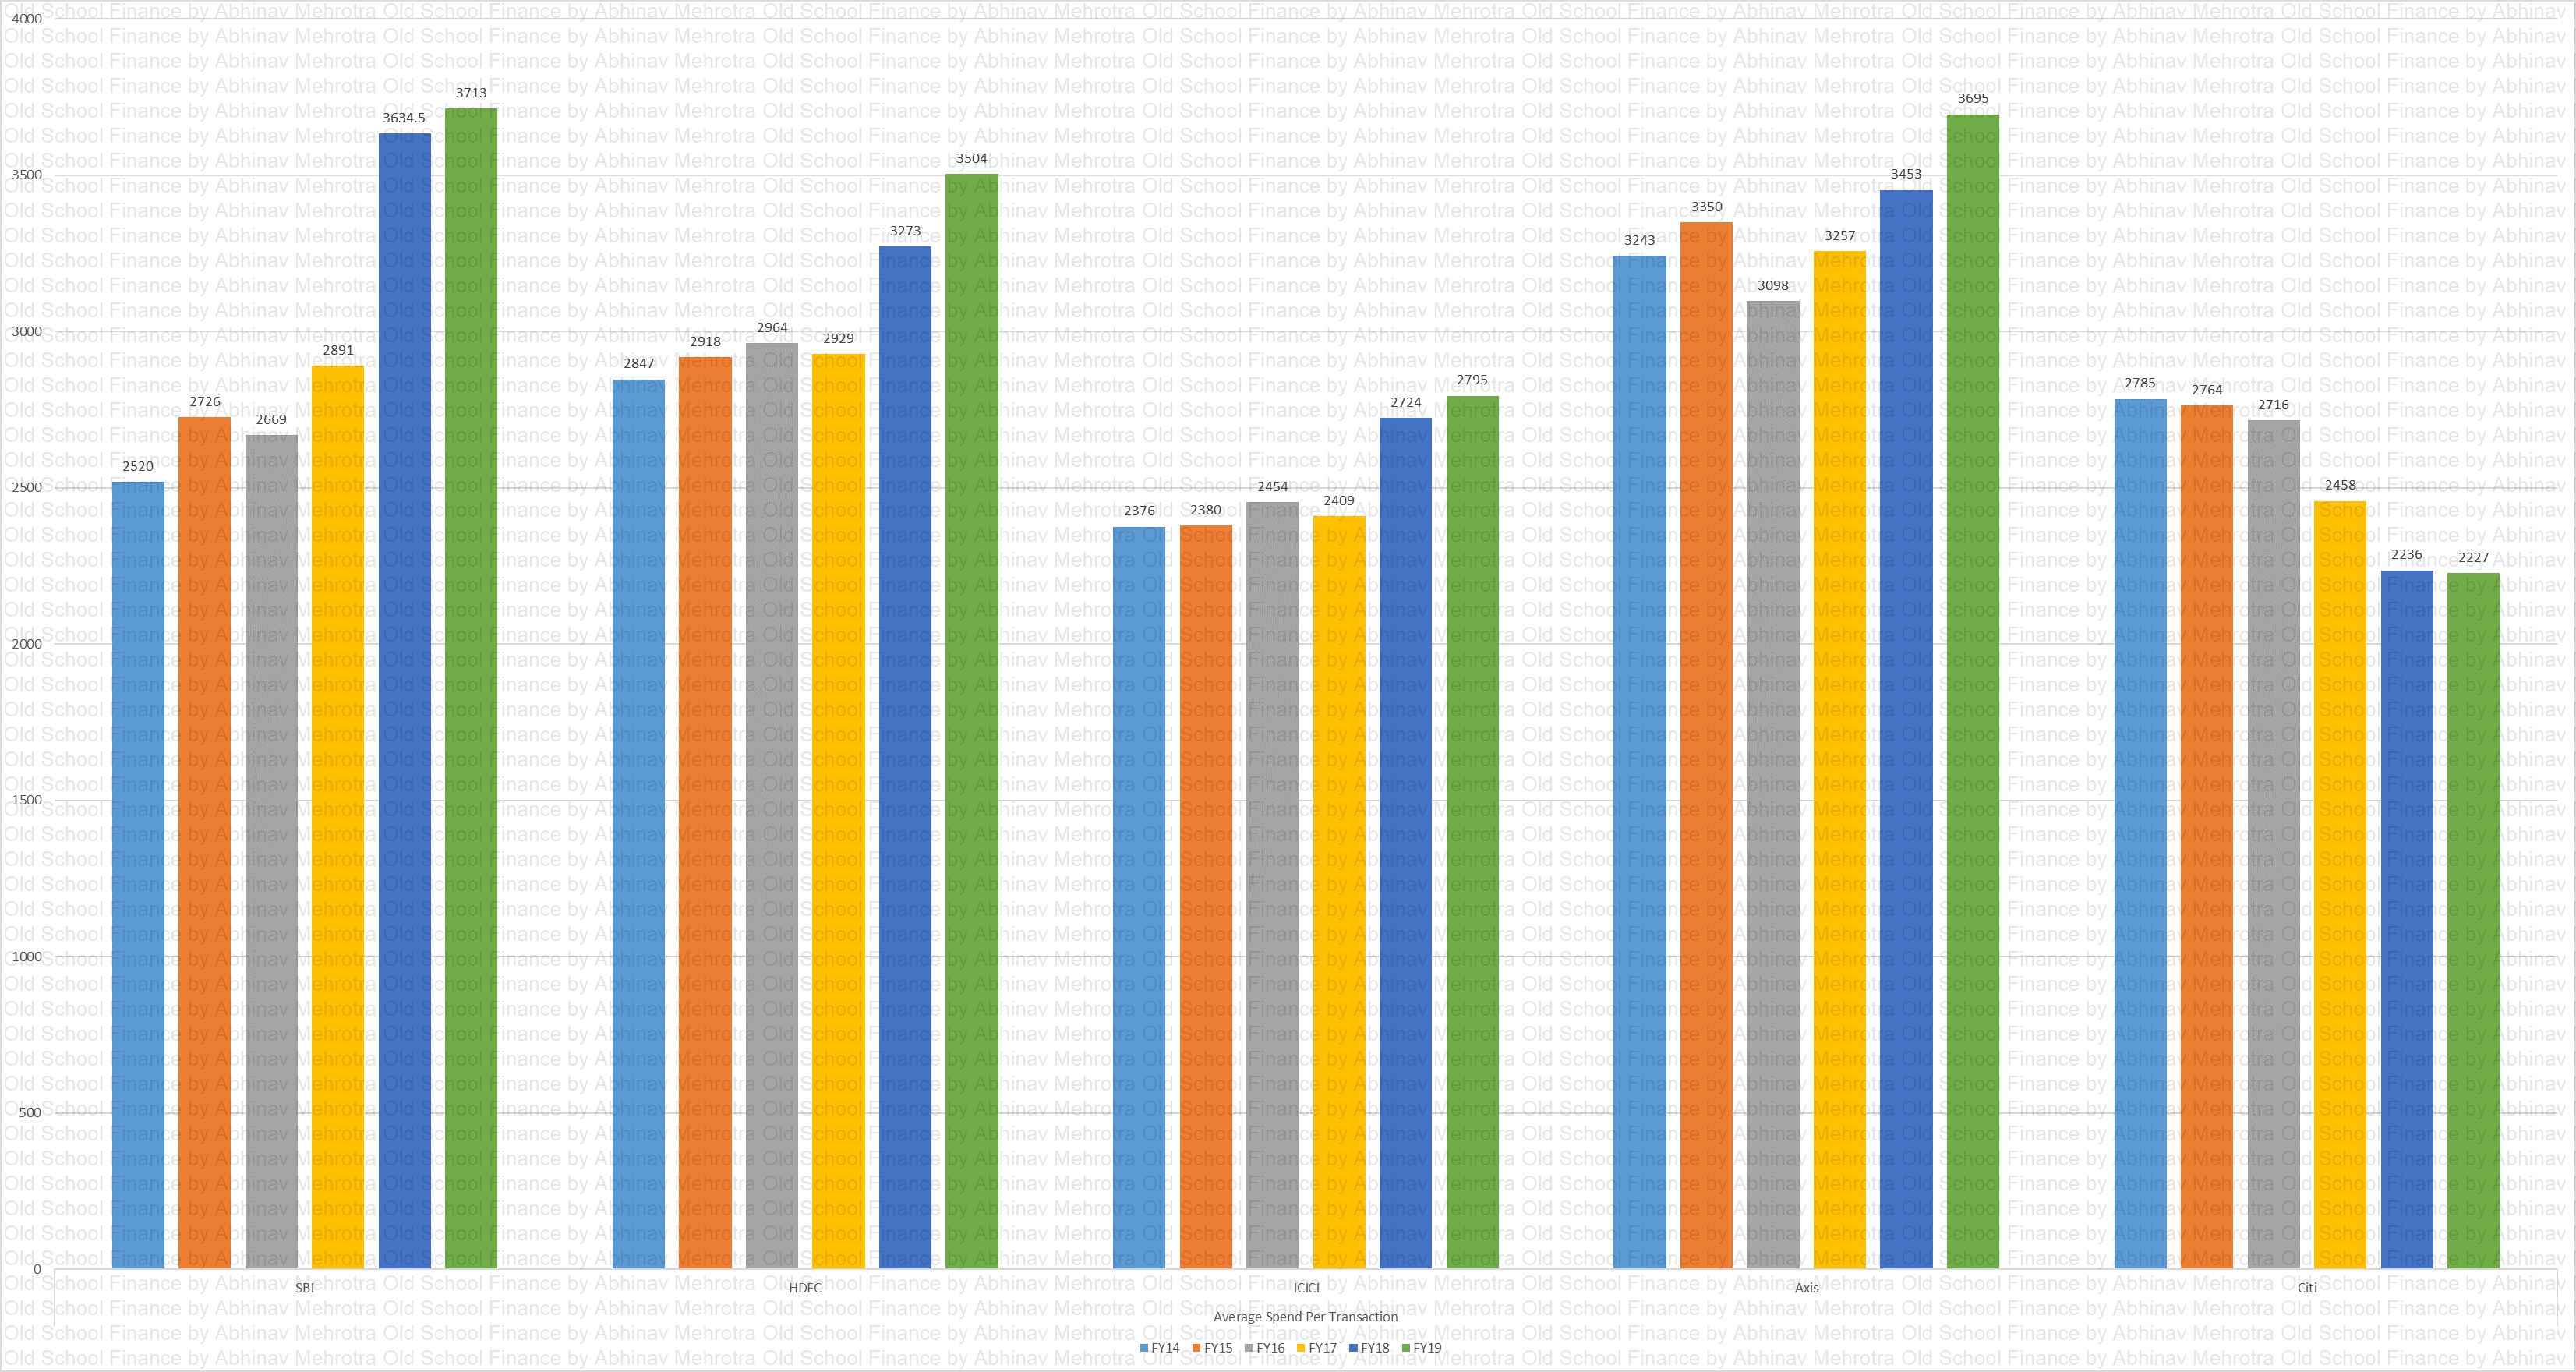
Average Spend per Transaction
Chart 10 – Average spend per transaction for the top issuers in India. Citi’s customers being the biggest annual spenders but with smallest transactions size means they must be having the highest absolute transactions as well, and that means more fees for Citi.
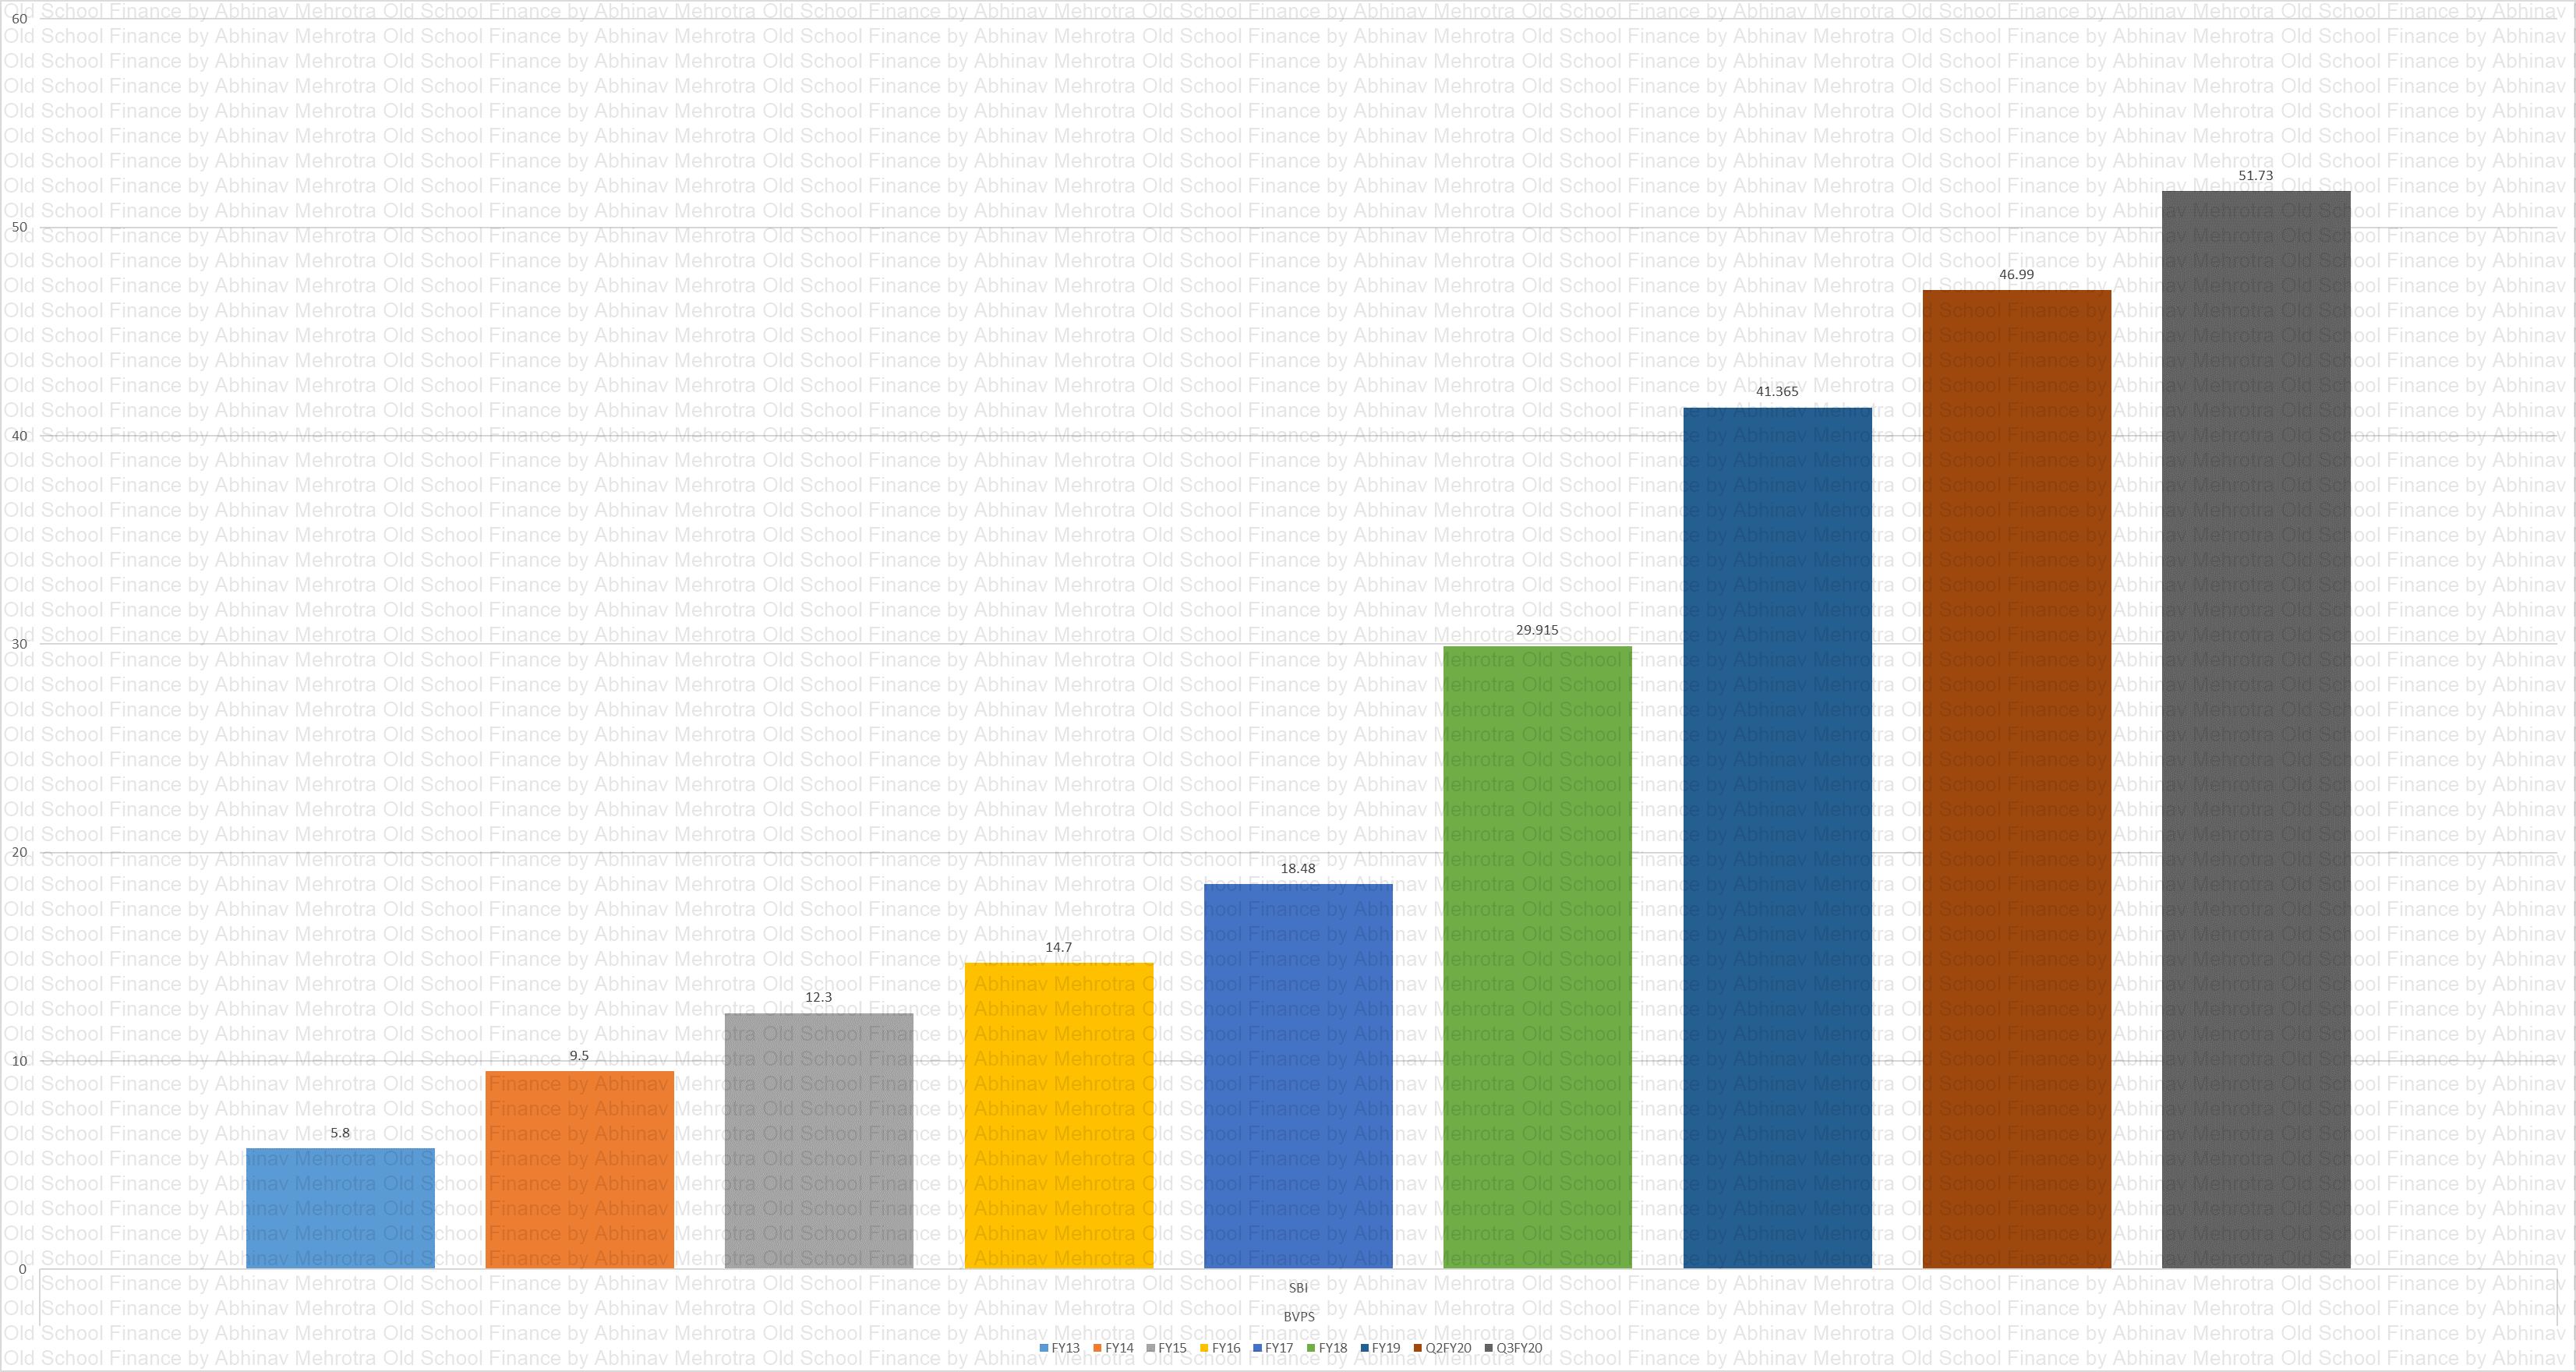
BVPS
Chart 11 – Book value per share for SBI Cards. Need to monitor whether the growth continues at this trajectory.
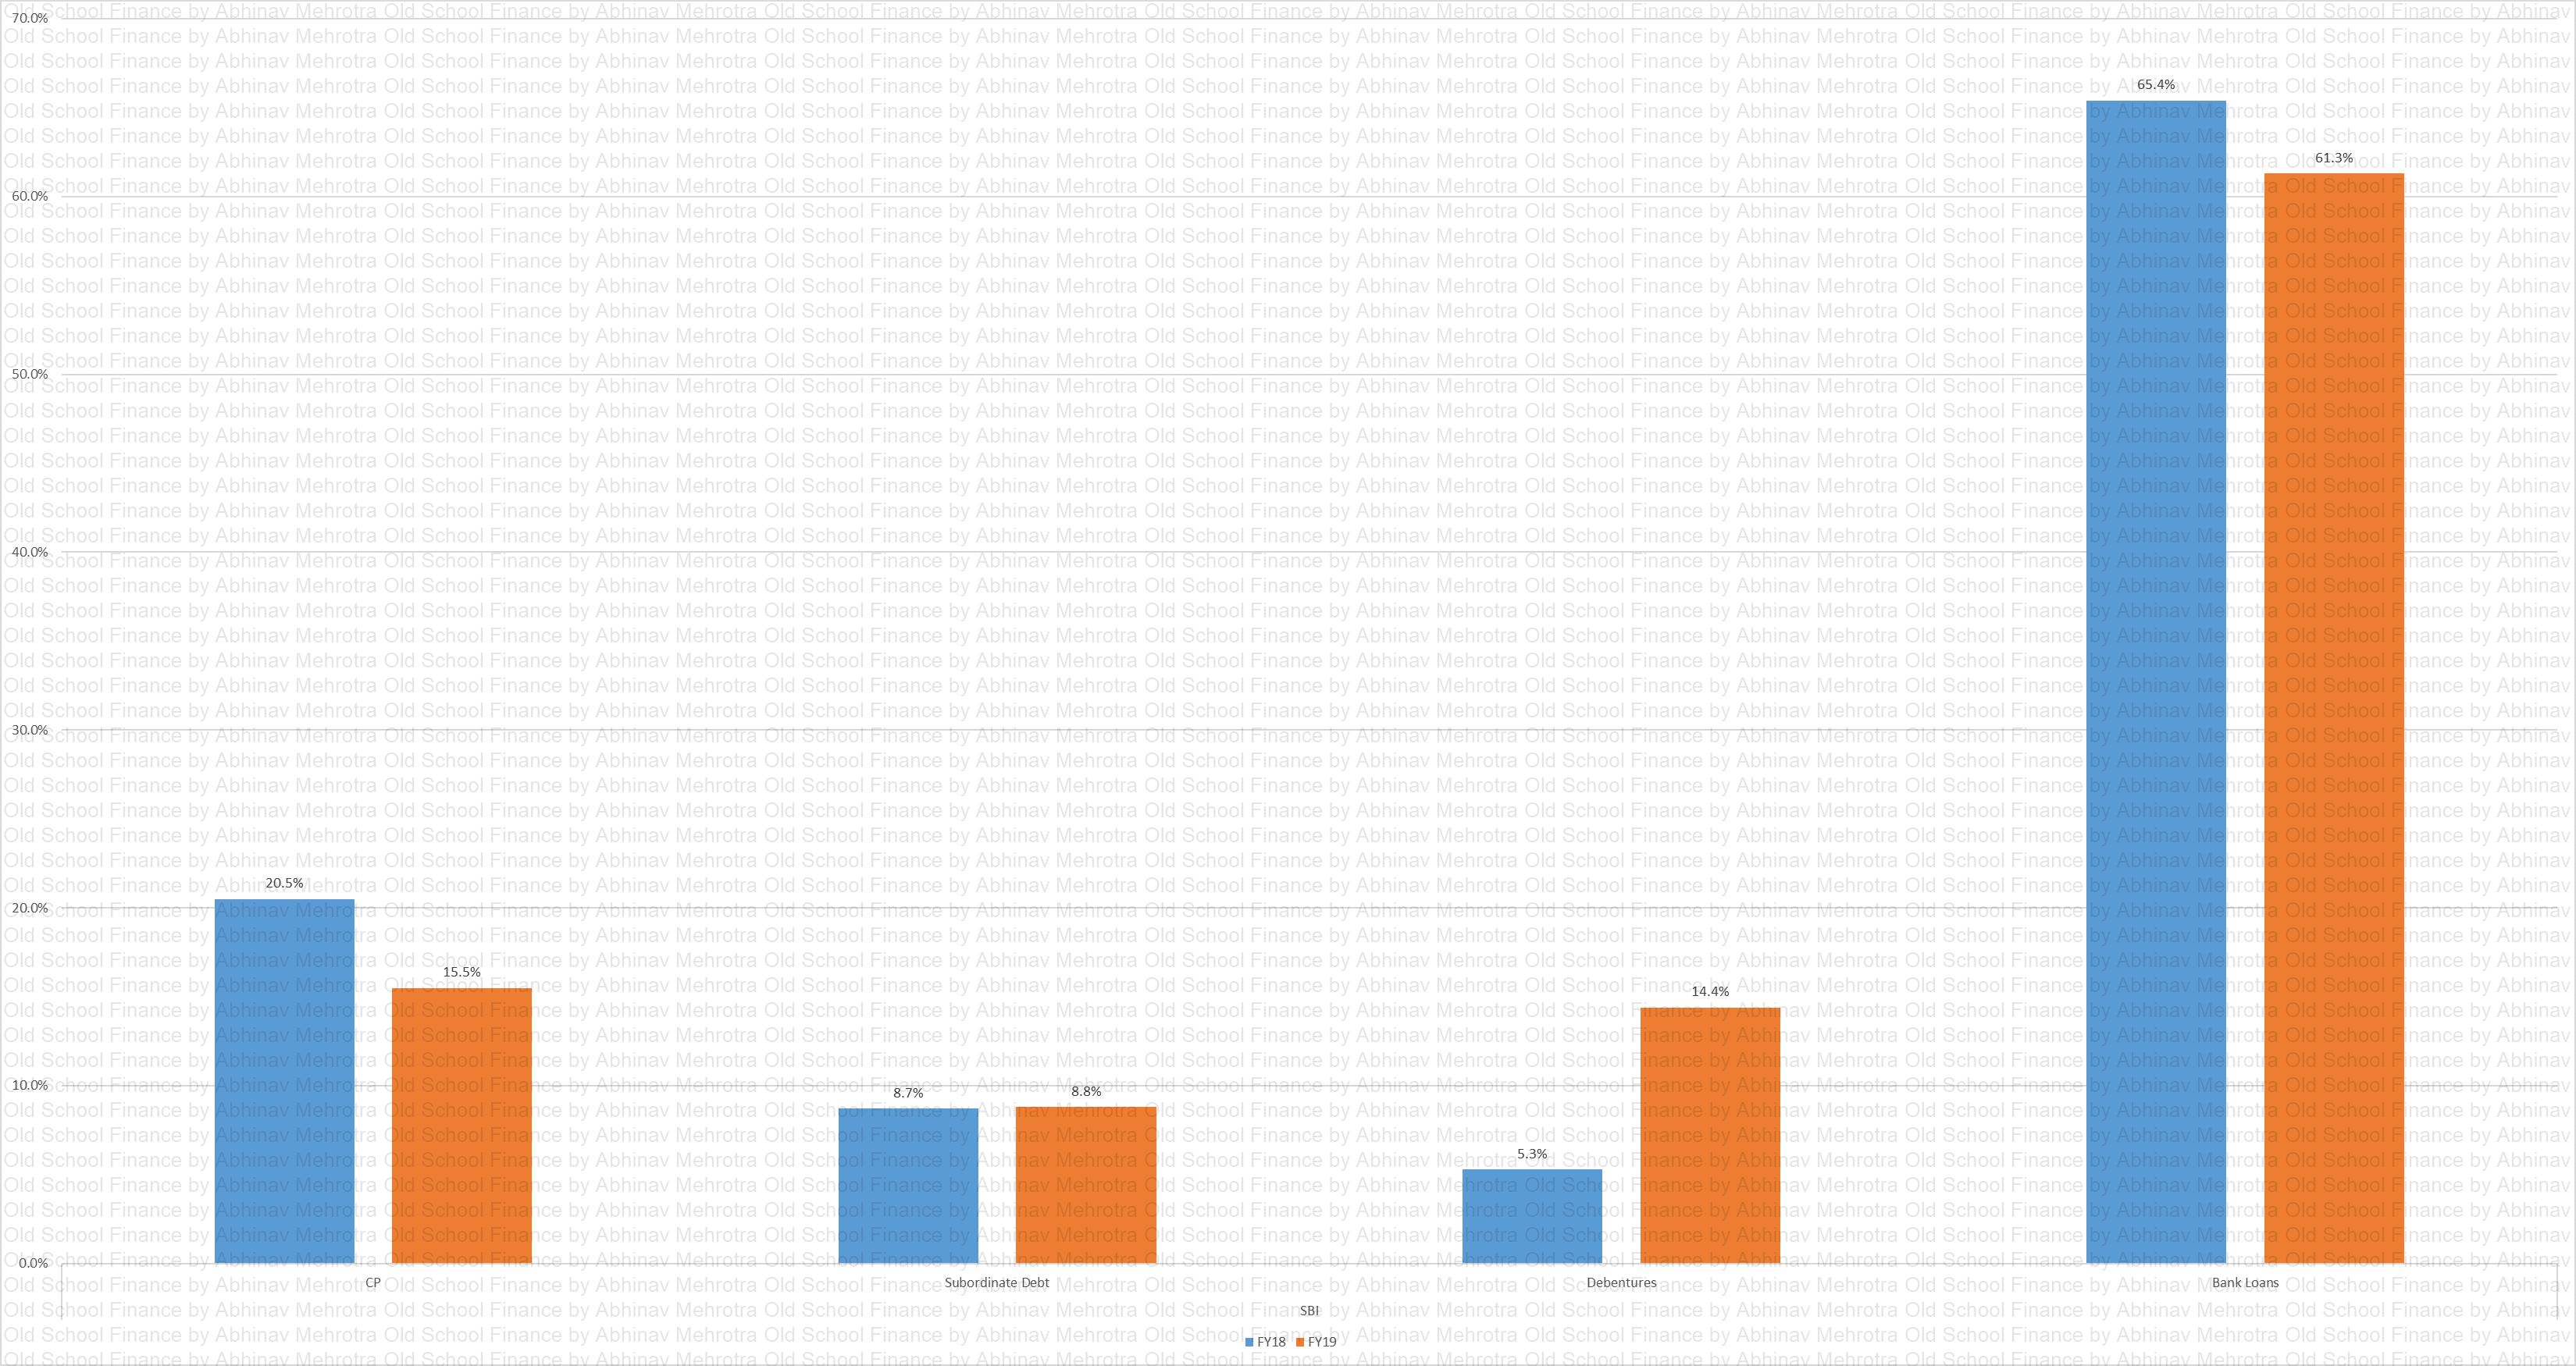
Capital Sources
Chart 12 – Depicts sources of capital. Majority of which is coming from loans from banks.
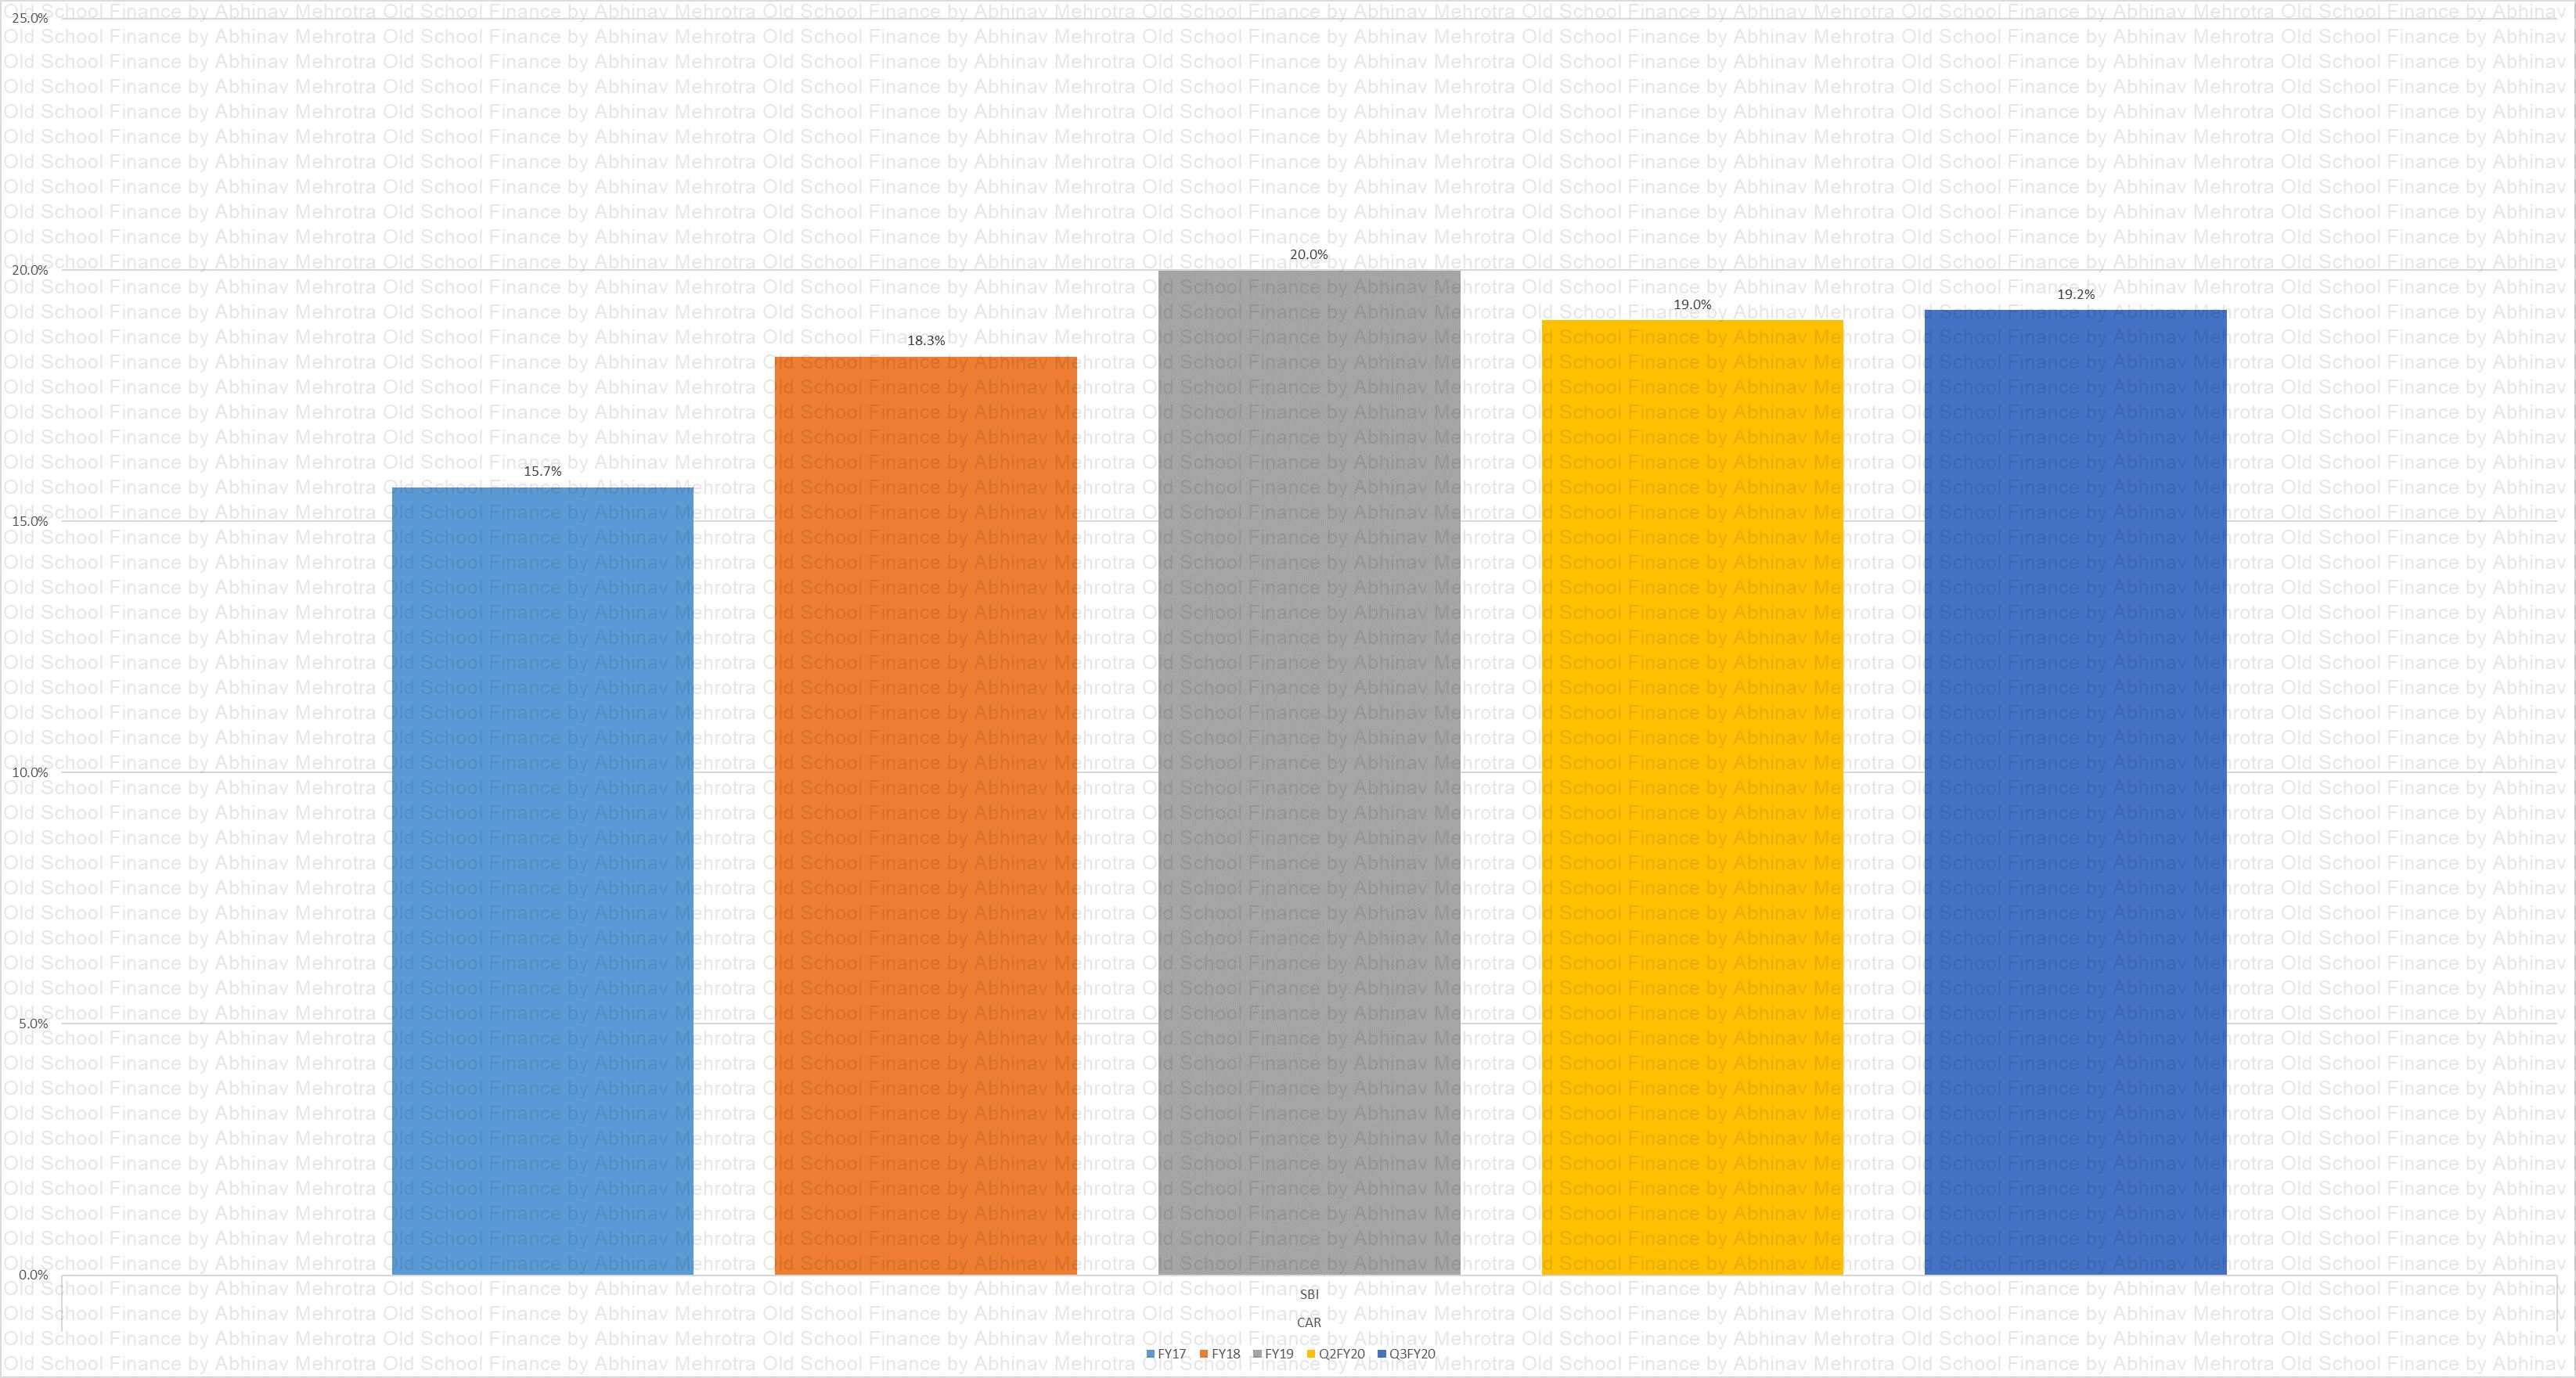
CAR
Chart 13 – Capital Adequacy ratio is well maintained.
CIF MS
Chart 14 – Represents the market share of top issuers on the basis of CC-CIF. HDFC is in the lead.
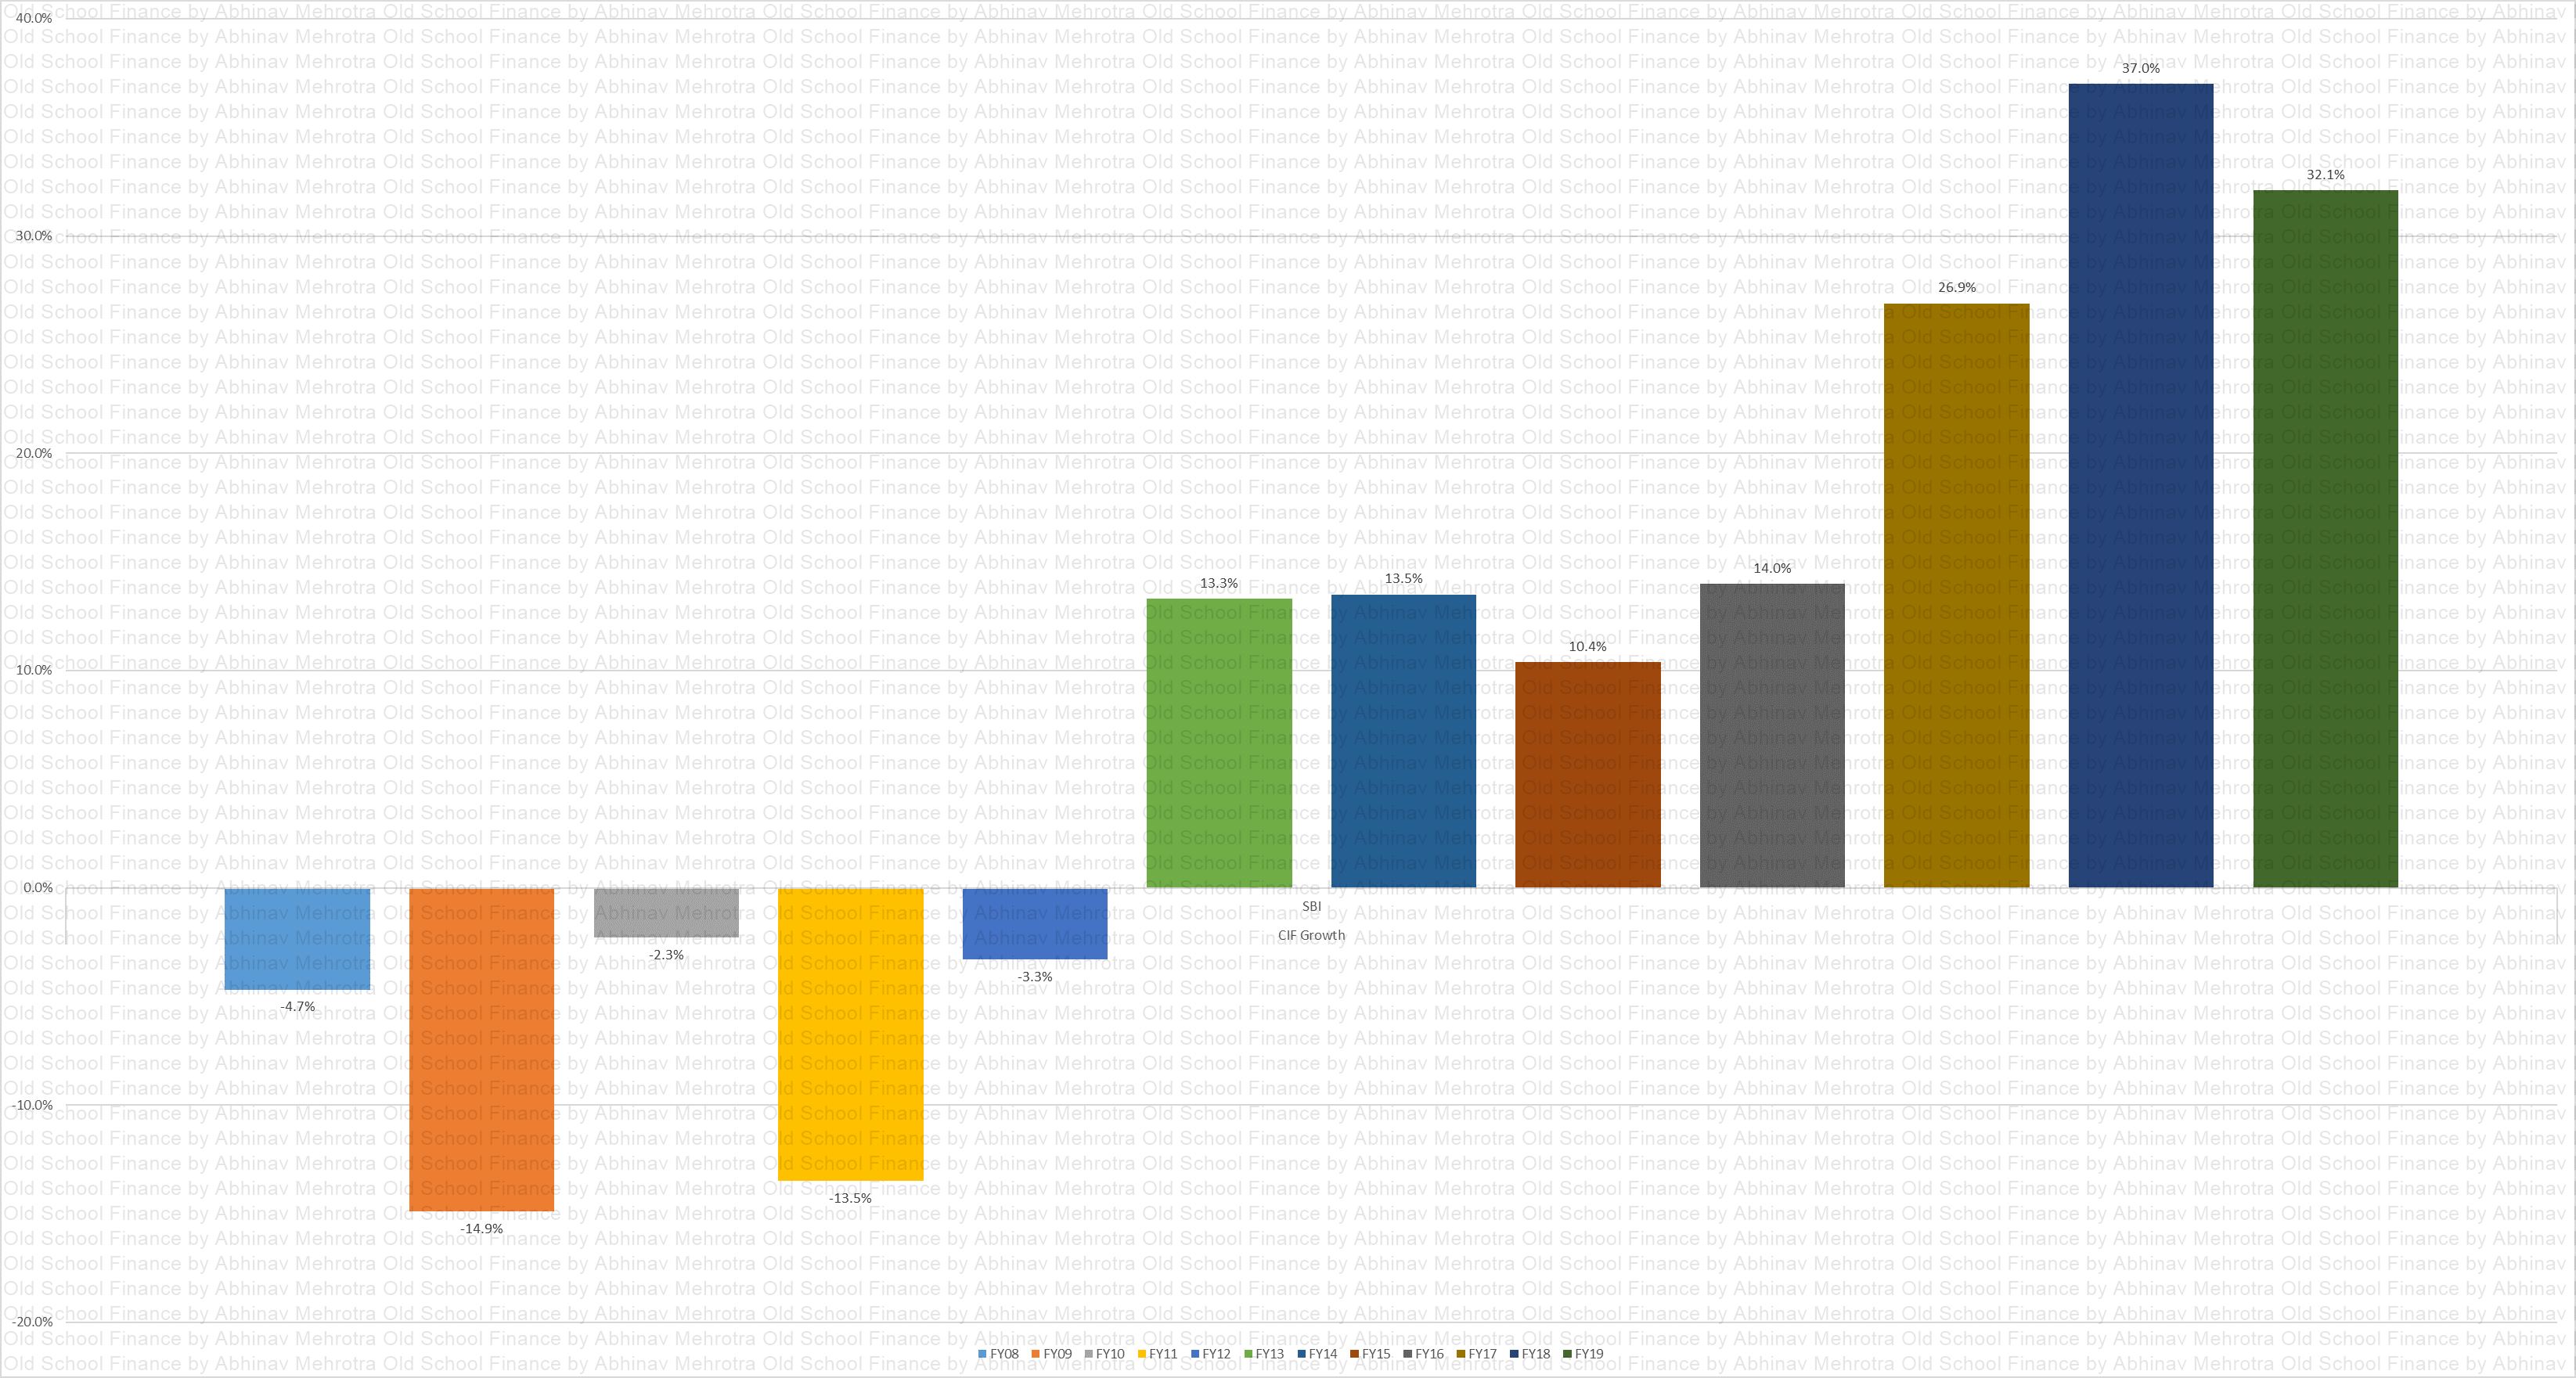
CIF Growth
Chart 15 – A longer history of CC-CIF for SBI. This should give an idea of what a complete business cycle can look like. I wish I had an even longer history of this chart to show what lead to the degrowth in the crisis years.
CC CIF
Chart 16 – Depicts the CC-CIF in absolute numbers. 3x growth for SBI in 5 years can be a cause for concern. However, even the leader HDFC has grown 2.5x in the same period.
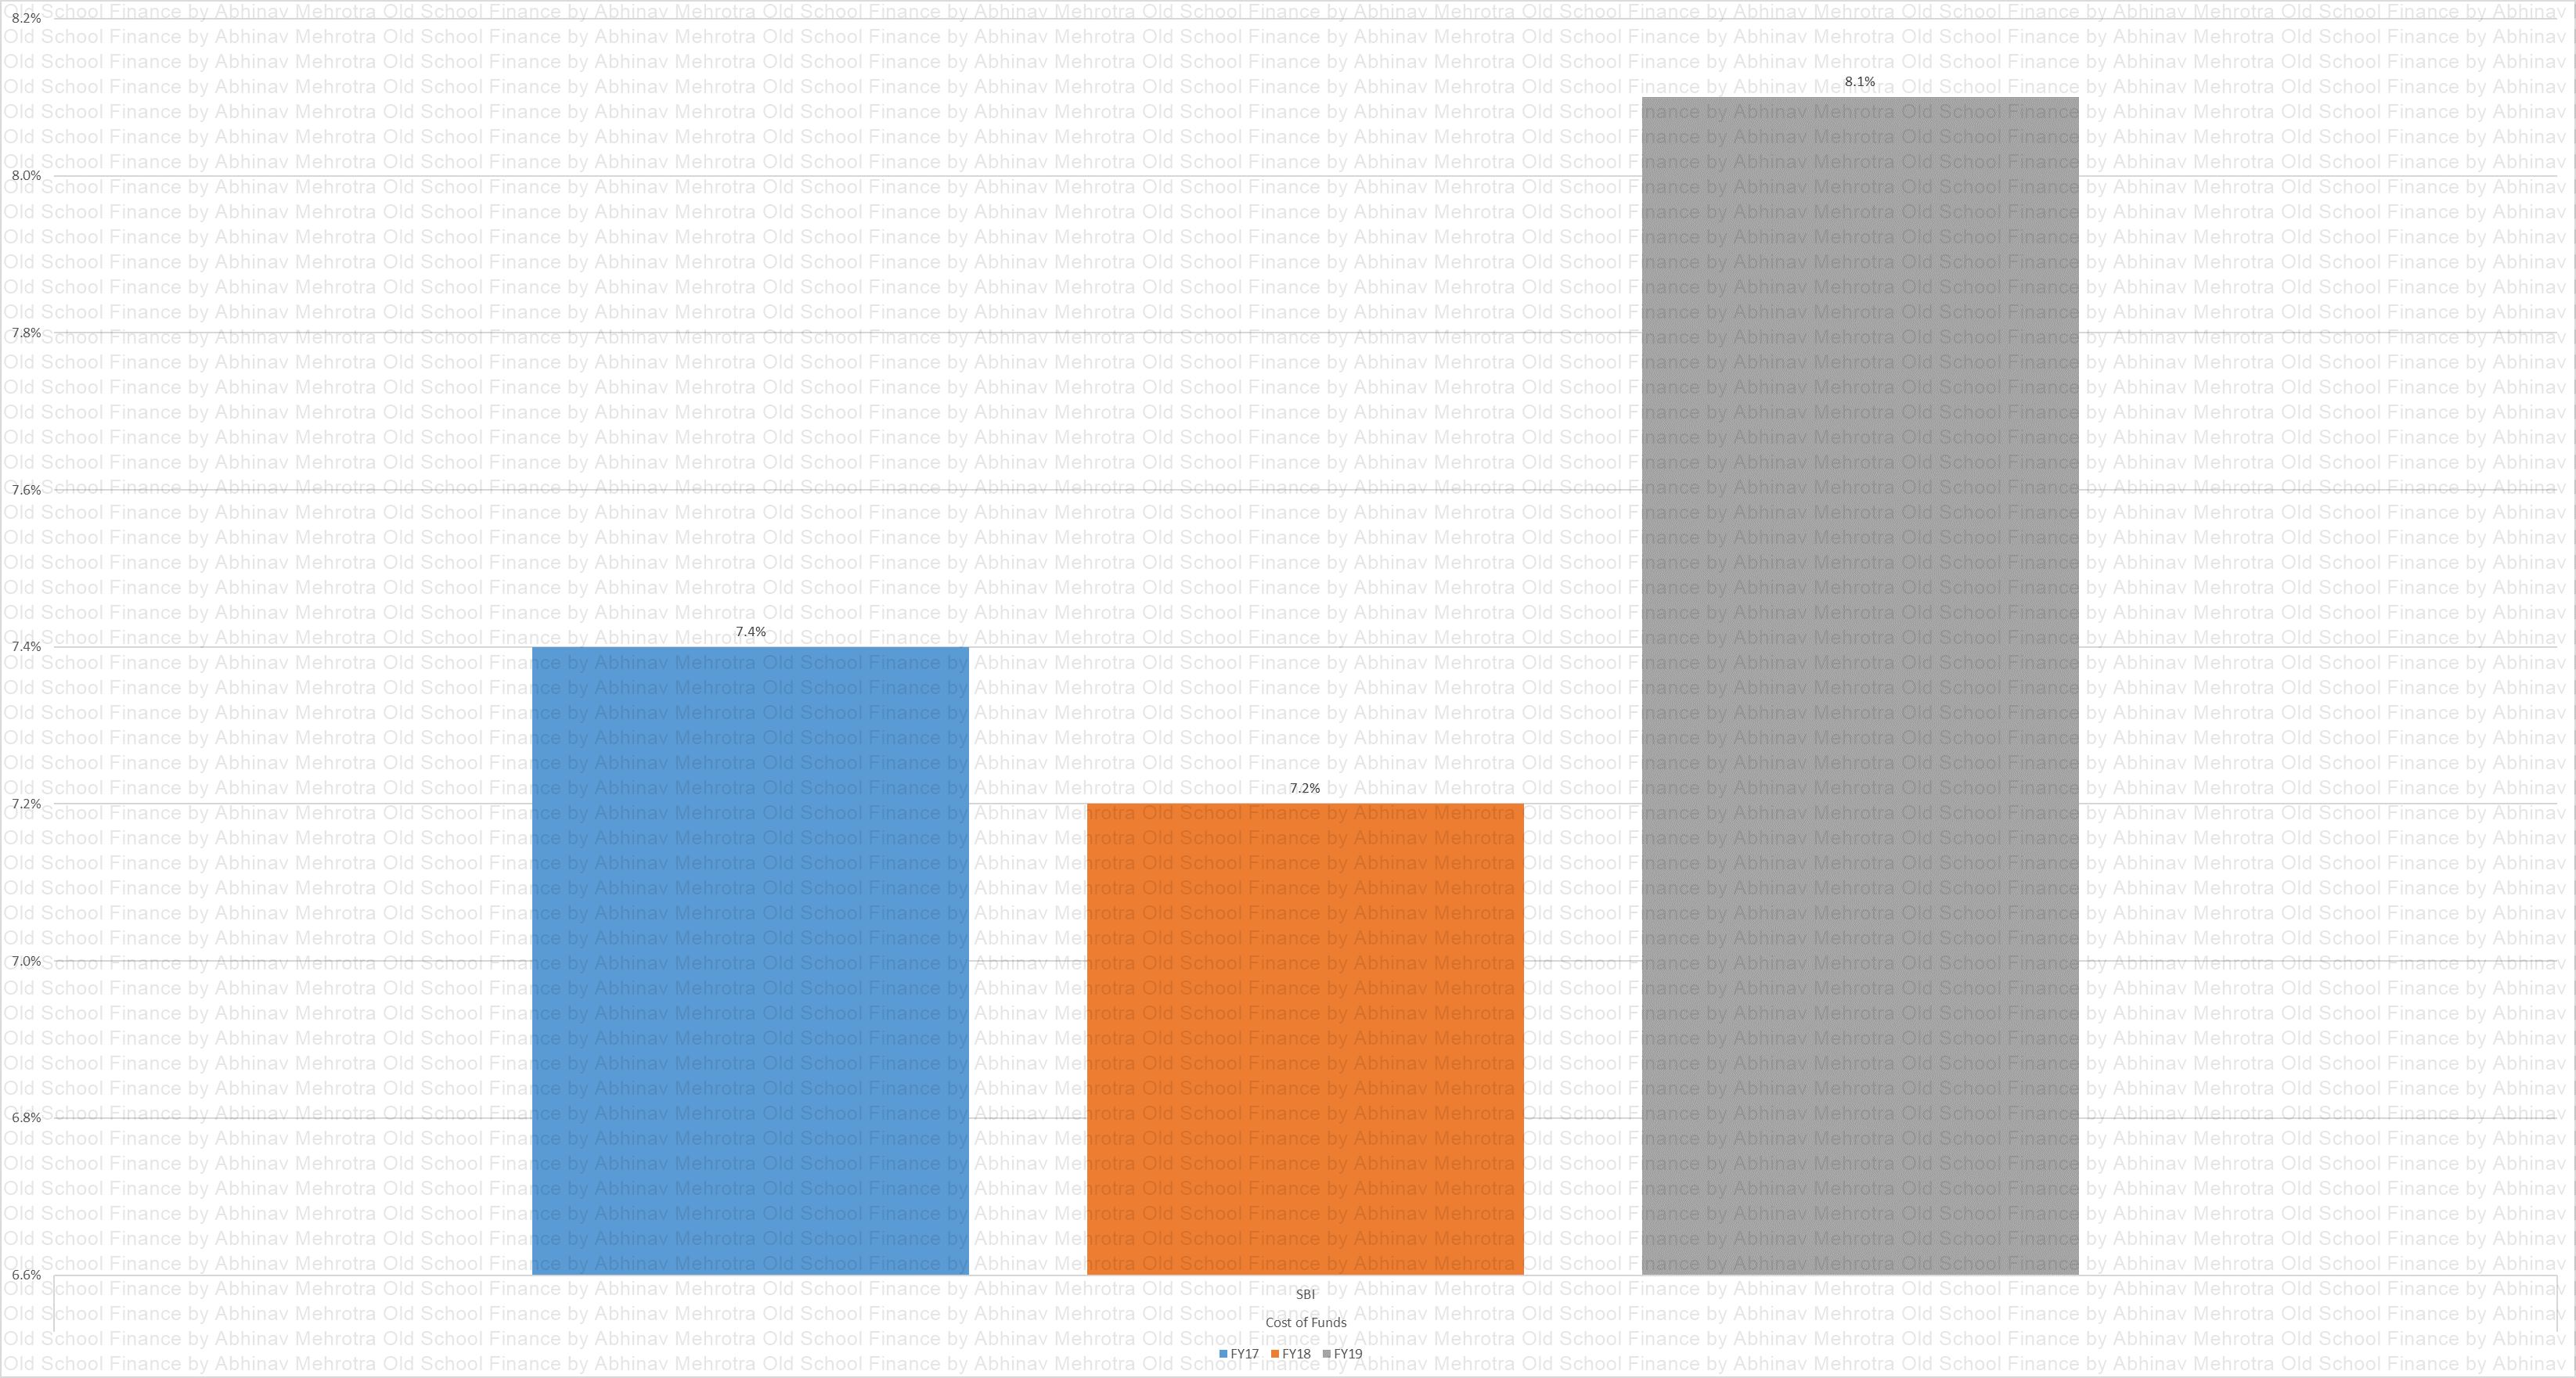
Cost of Funds
Chart 17 – Recent rise in the cost of funds needs to be monitored. Could be a one-off due to ILFS crisis.
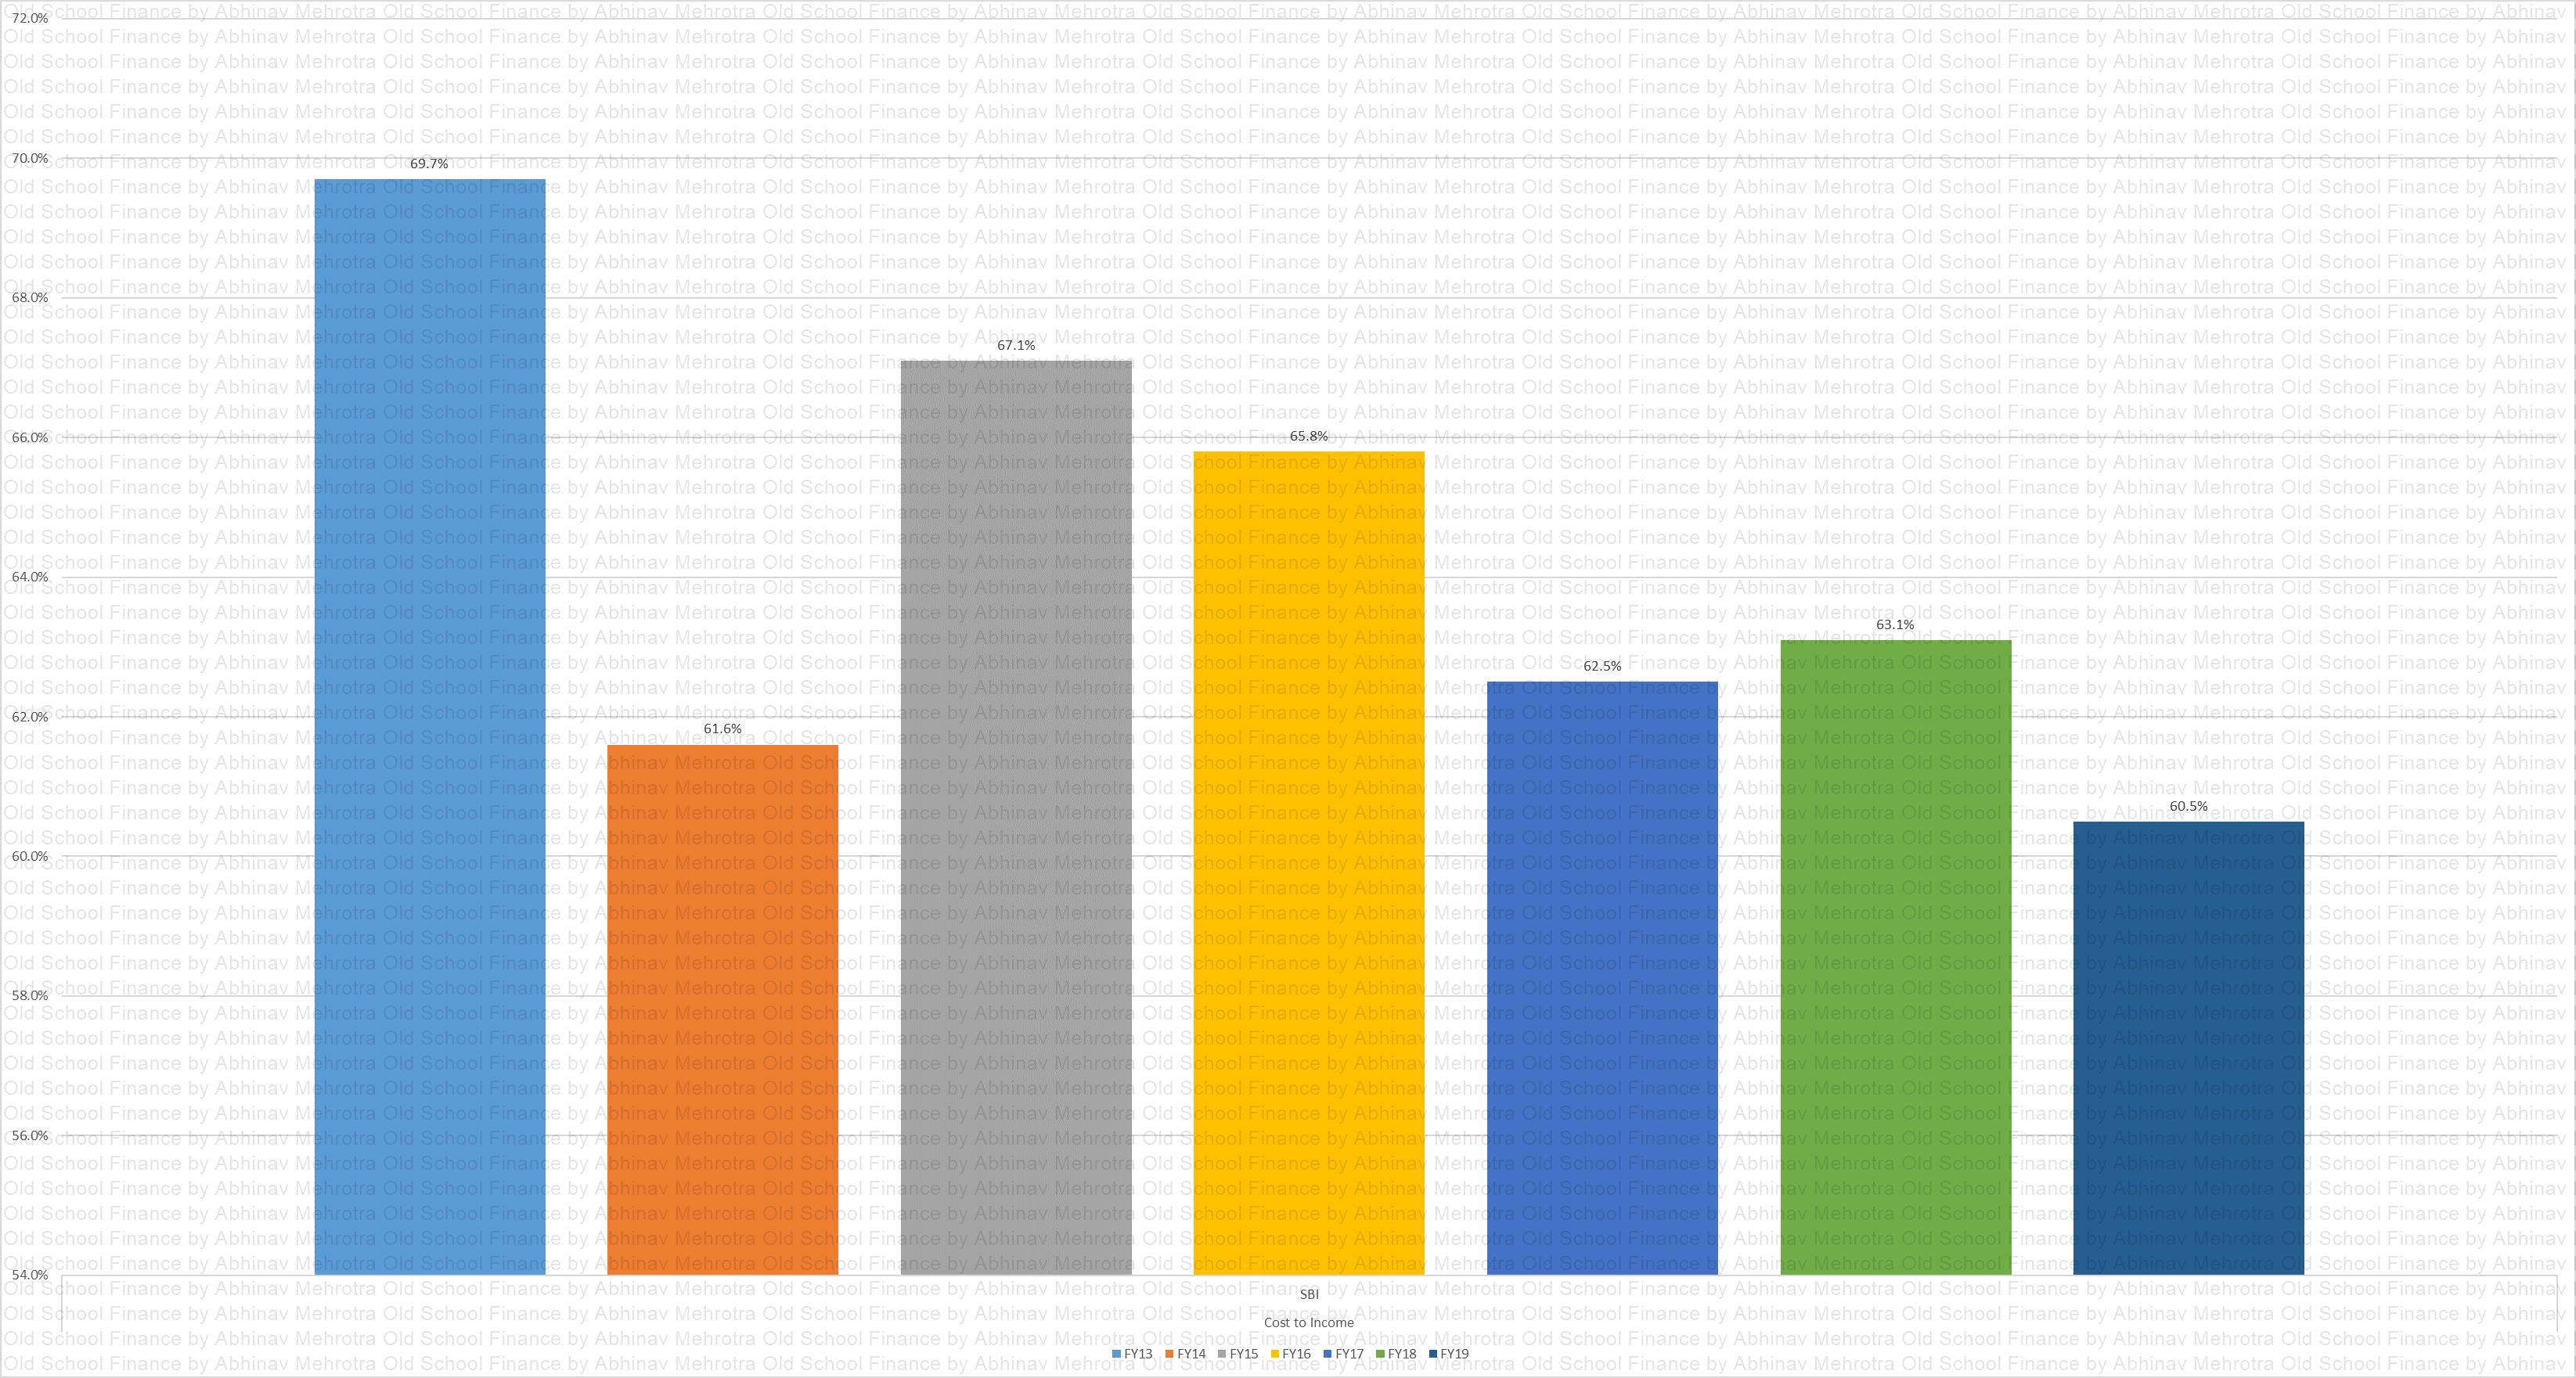
CI
Chart 18 – Cost to income ratio is stabilising around 60%. Wish we had standalone data from competitors to form a baseline. Any further reduction is welcome.
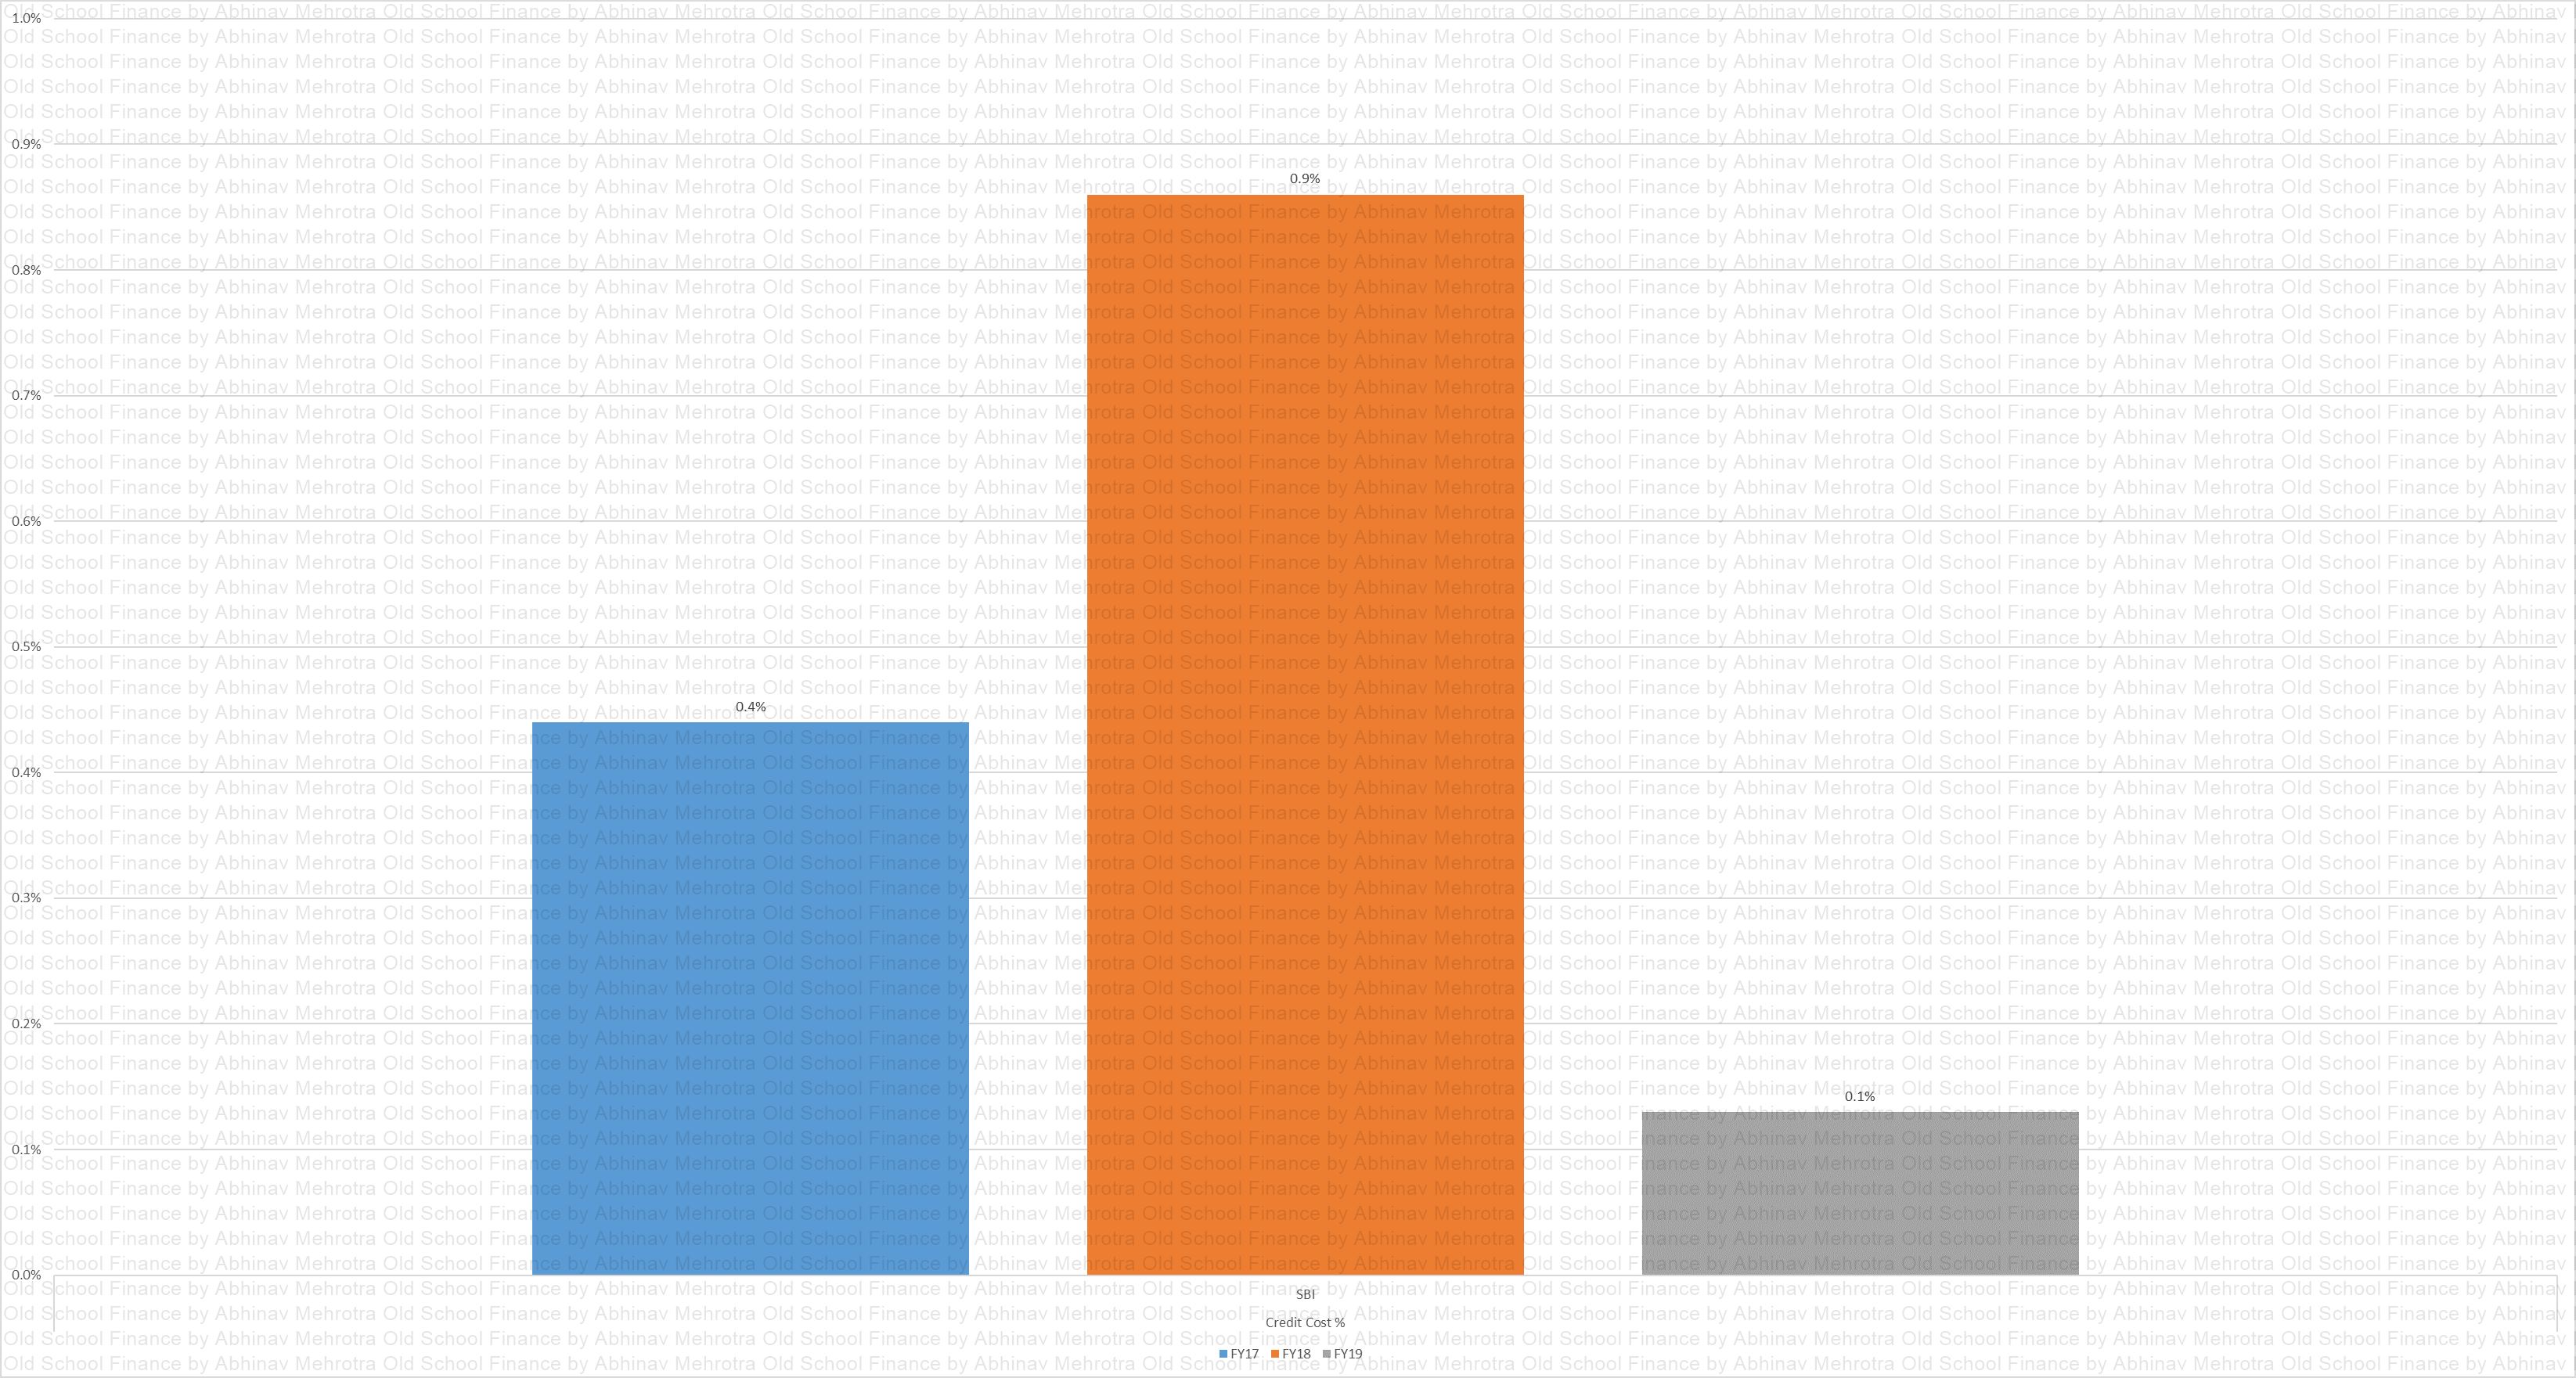
Credit Cost %
Chart 19 – Credit Cost % from a research report, they, however, provide no explanation of the calculation of this metric. The provisioning metric that I discuss later on is I believe the true credit cost for this business.
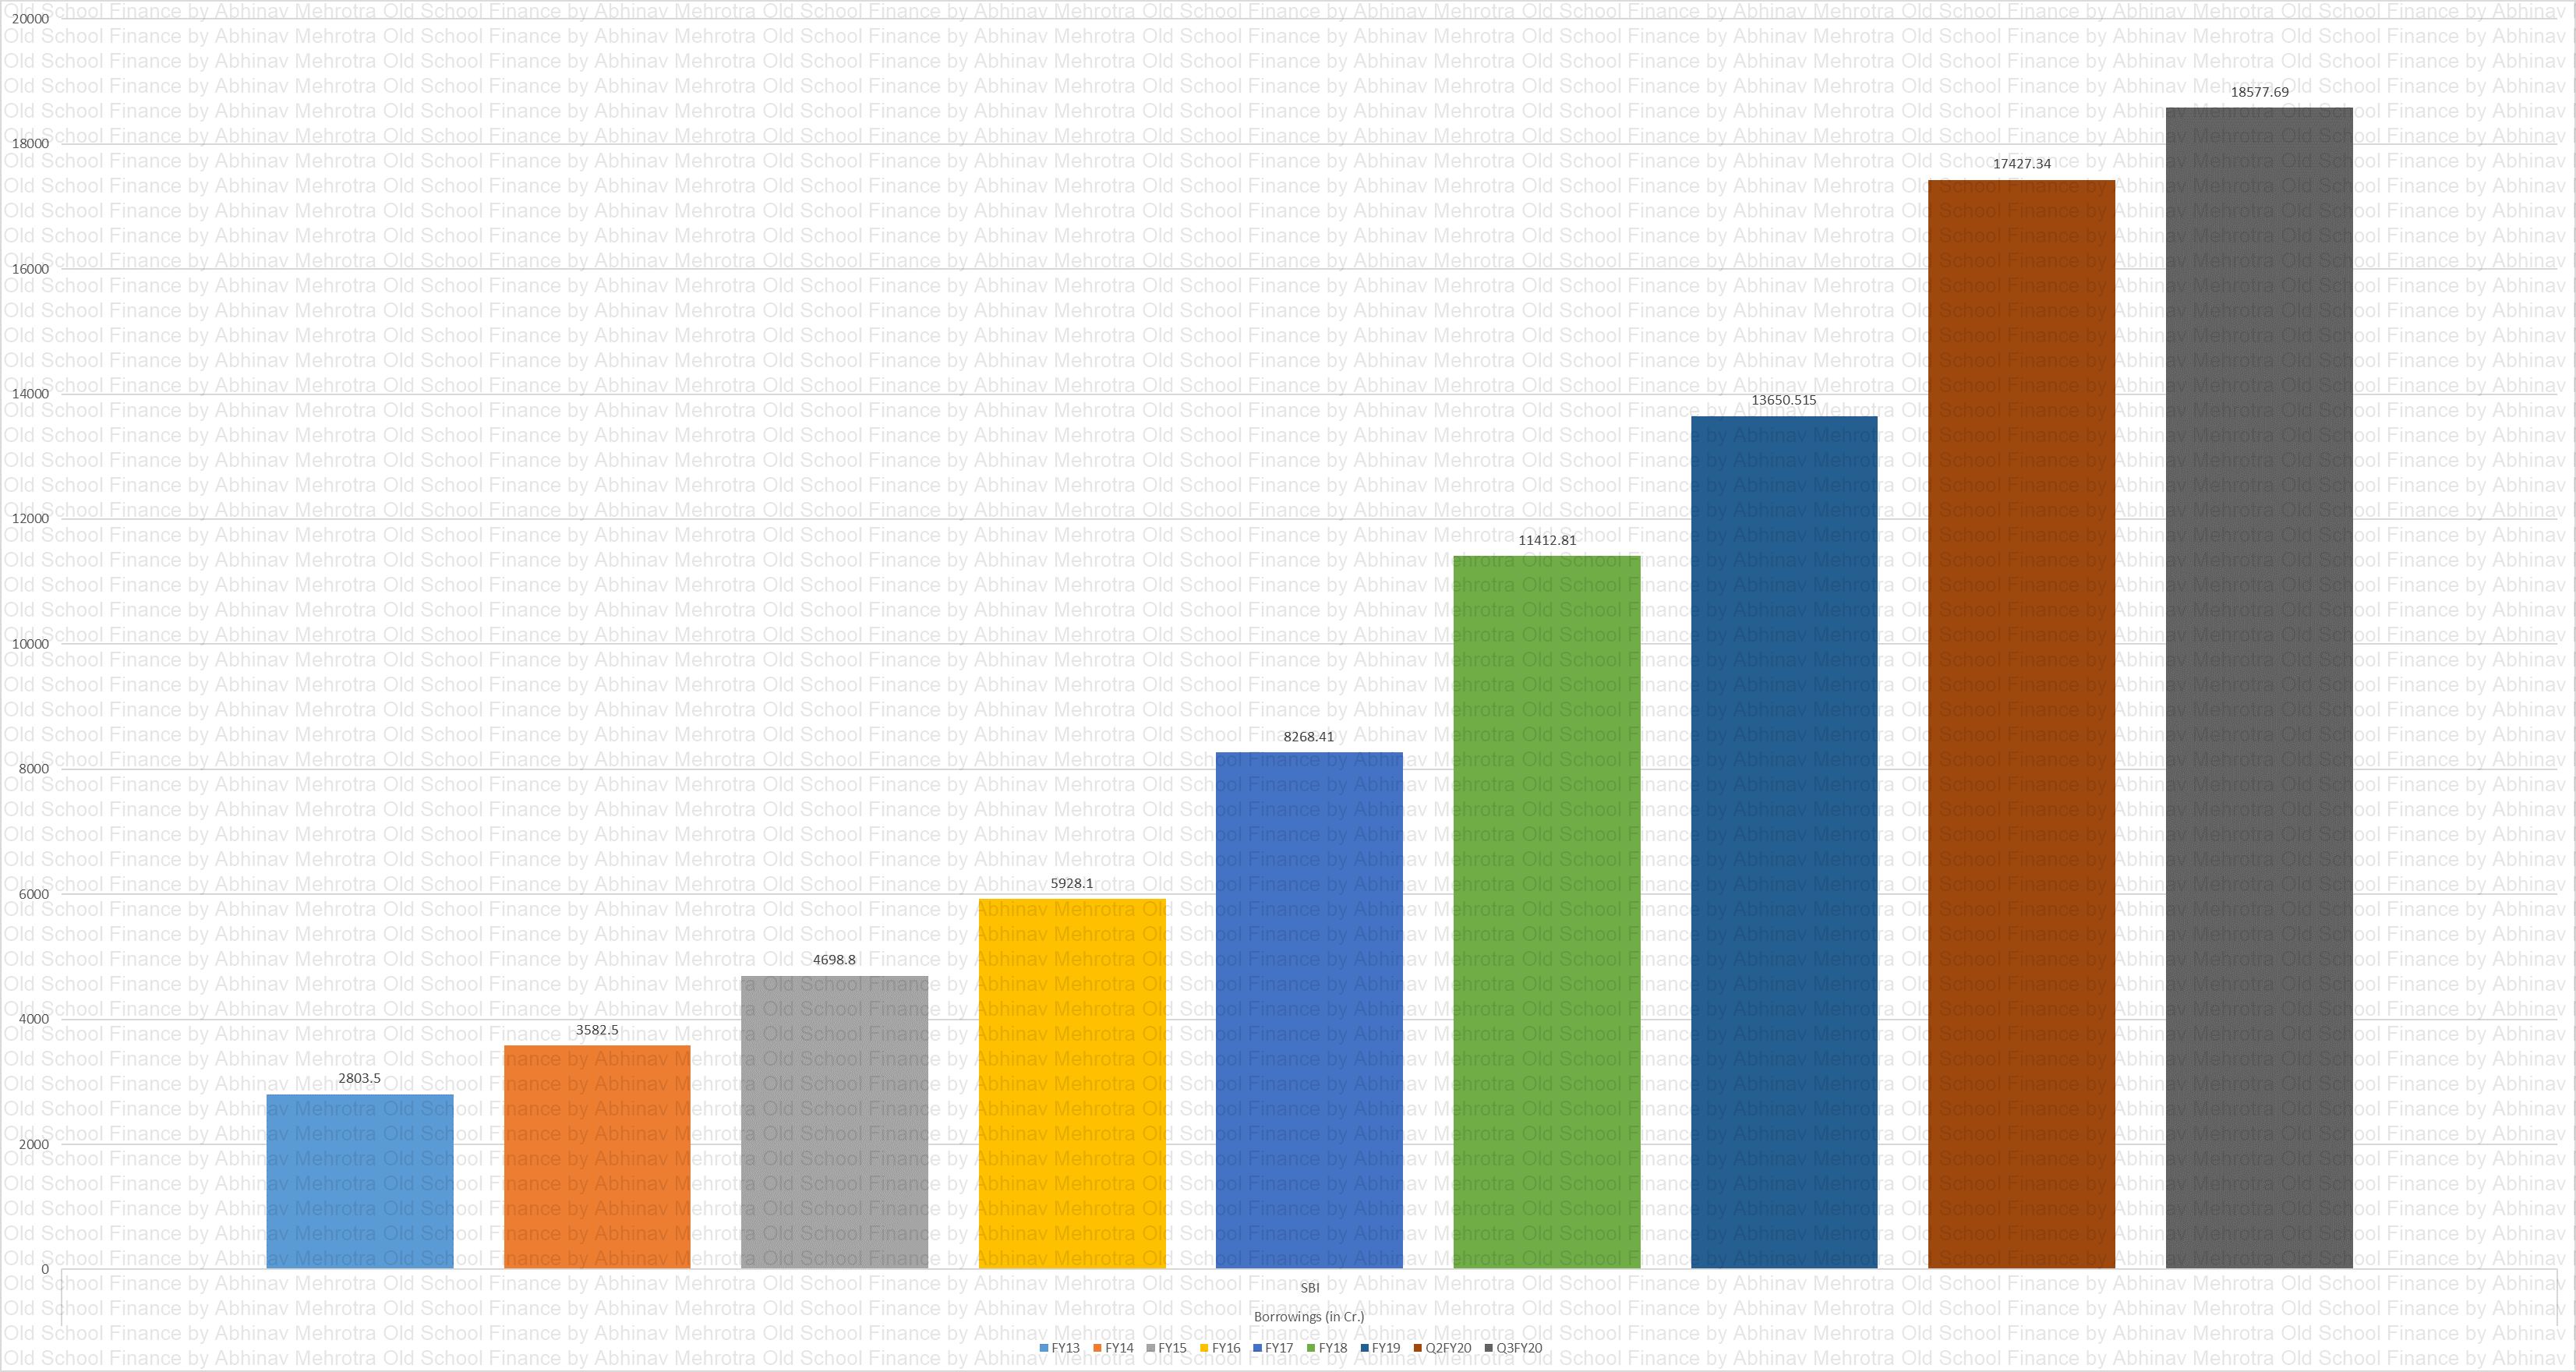
Debt
Chart 20 – Borrowings have grown with the loan book expansion.
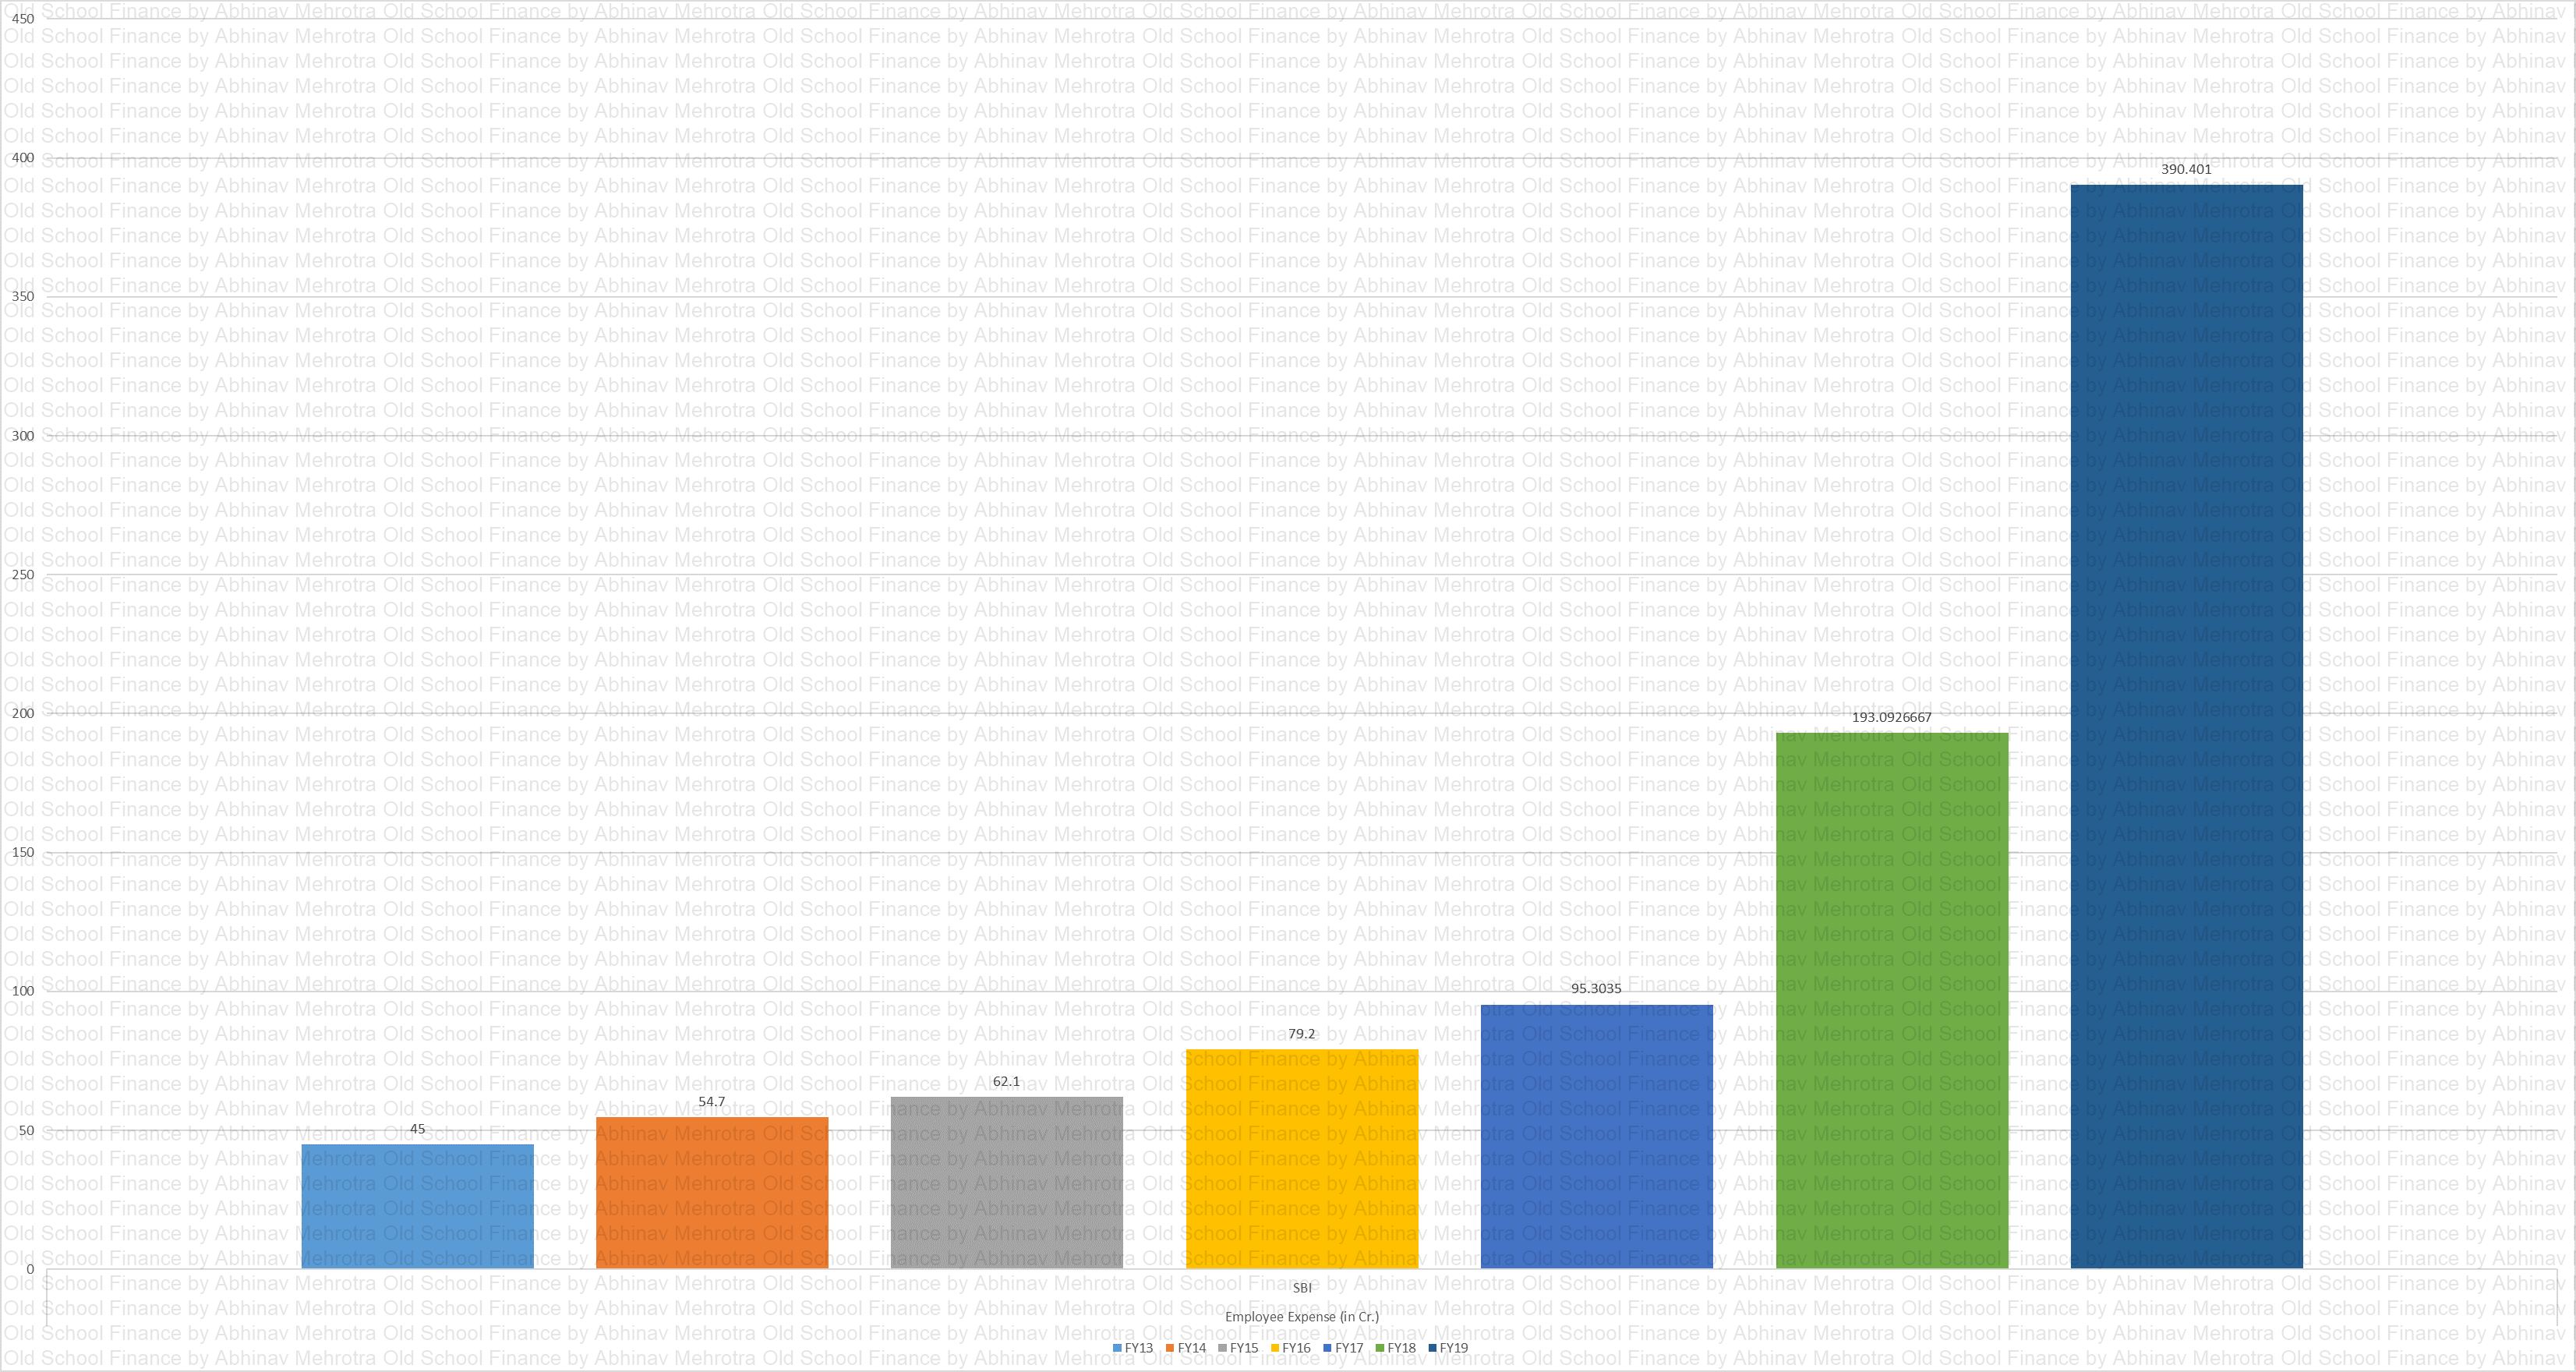
Employee Exp.
Chart 21 – Employee expenses have ballooned recently.
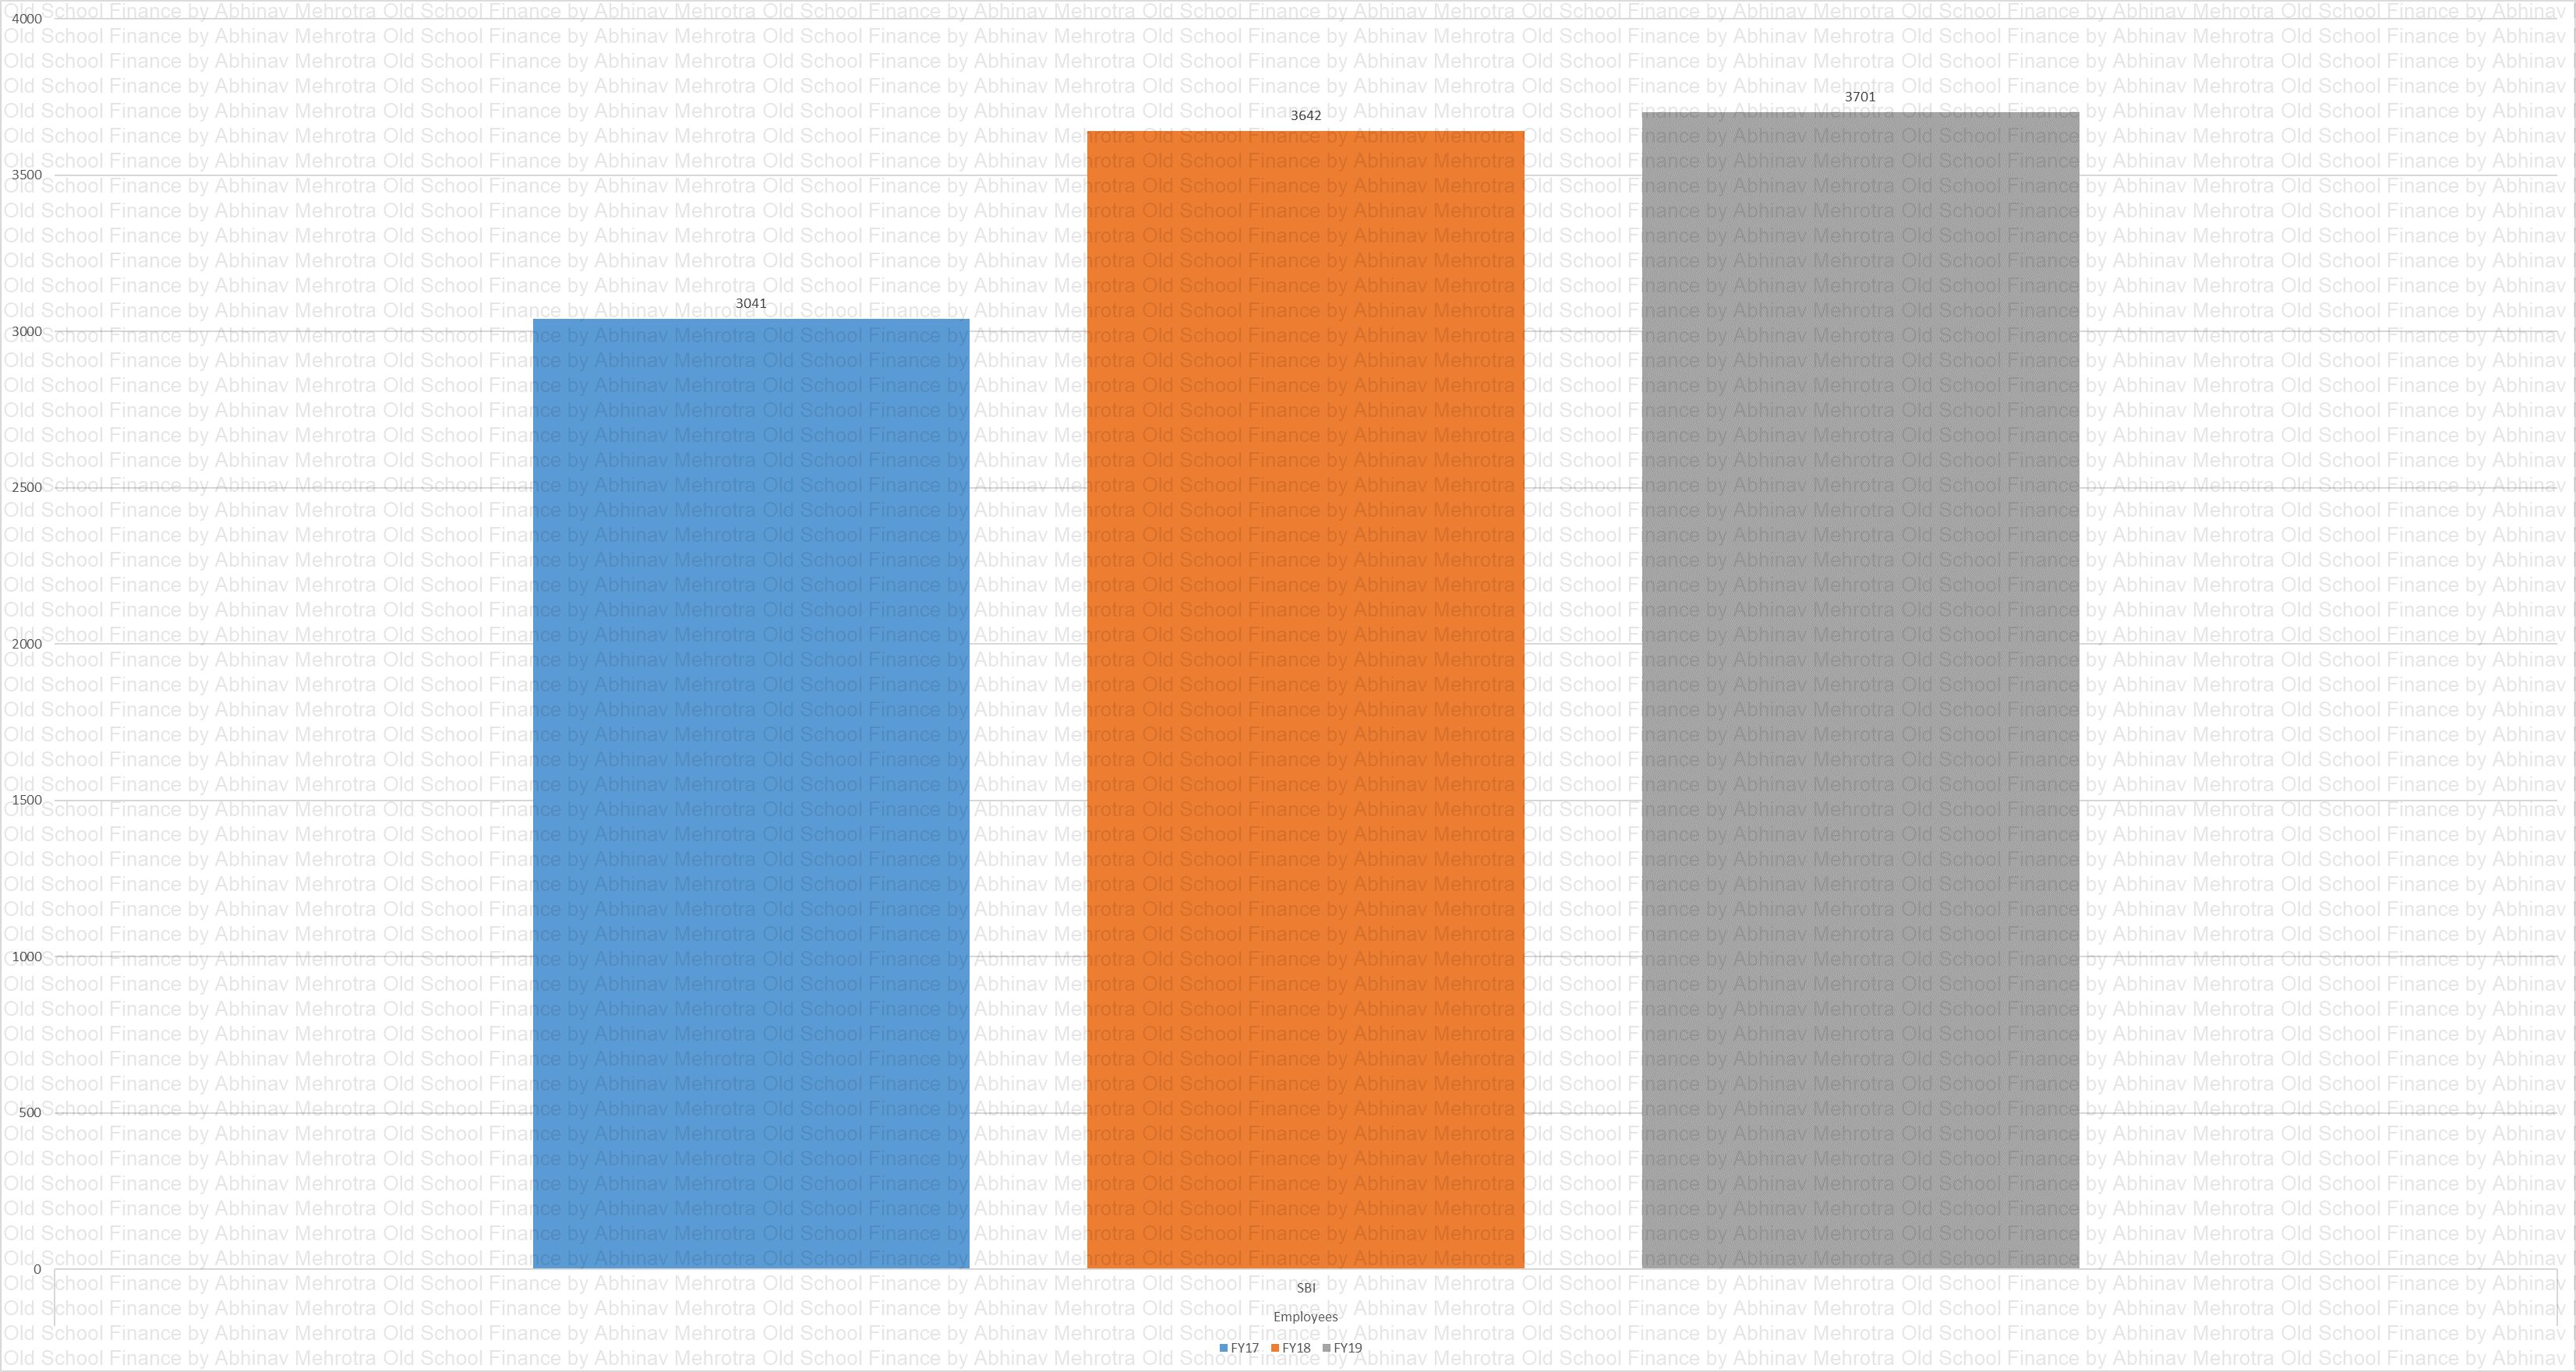
Employees
Chart 22 – Number of employees. Pair this with chart 21 above and something seems off. 4x growth in employee expenses with only 21% growth in the employee base. Either these new employees are very well paid or their compensation matrix across the whole organization was reworked before the IPO or they have increased temporary staffing for sales who are not enrolled with the company.
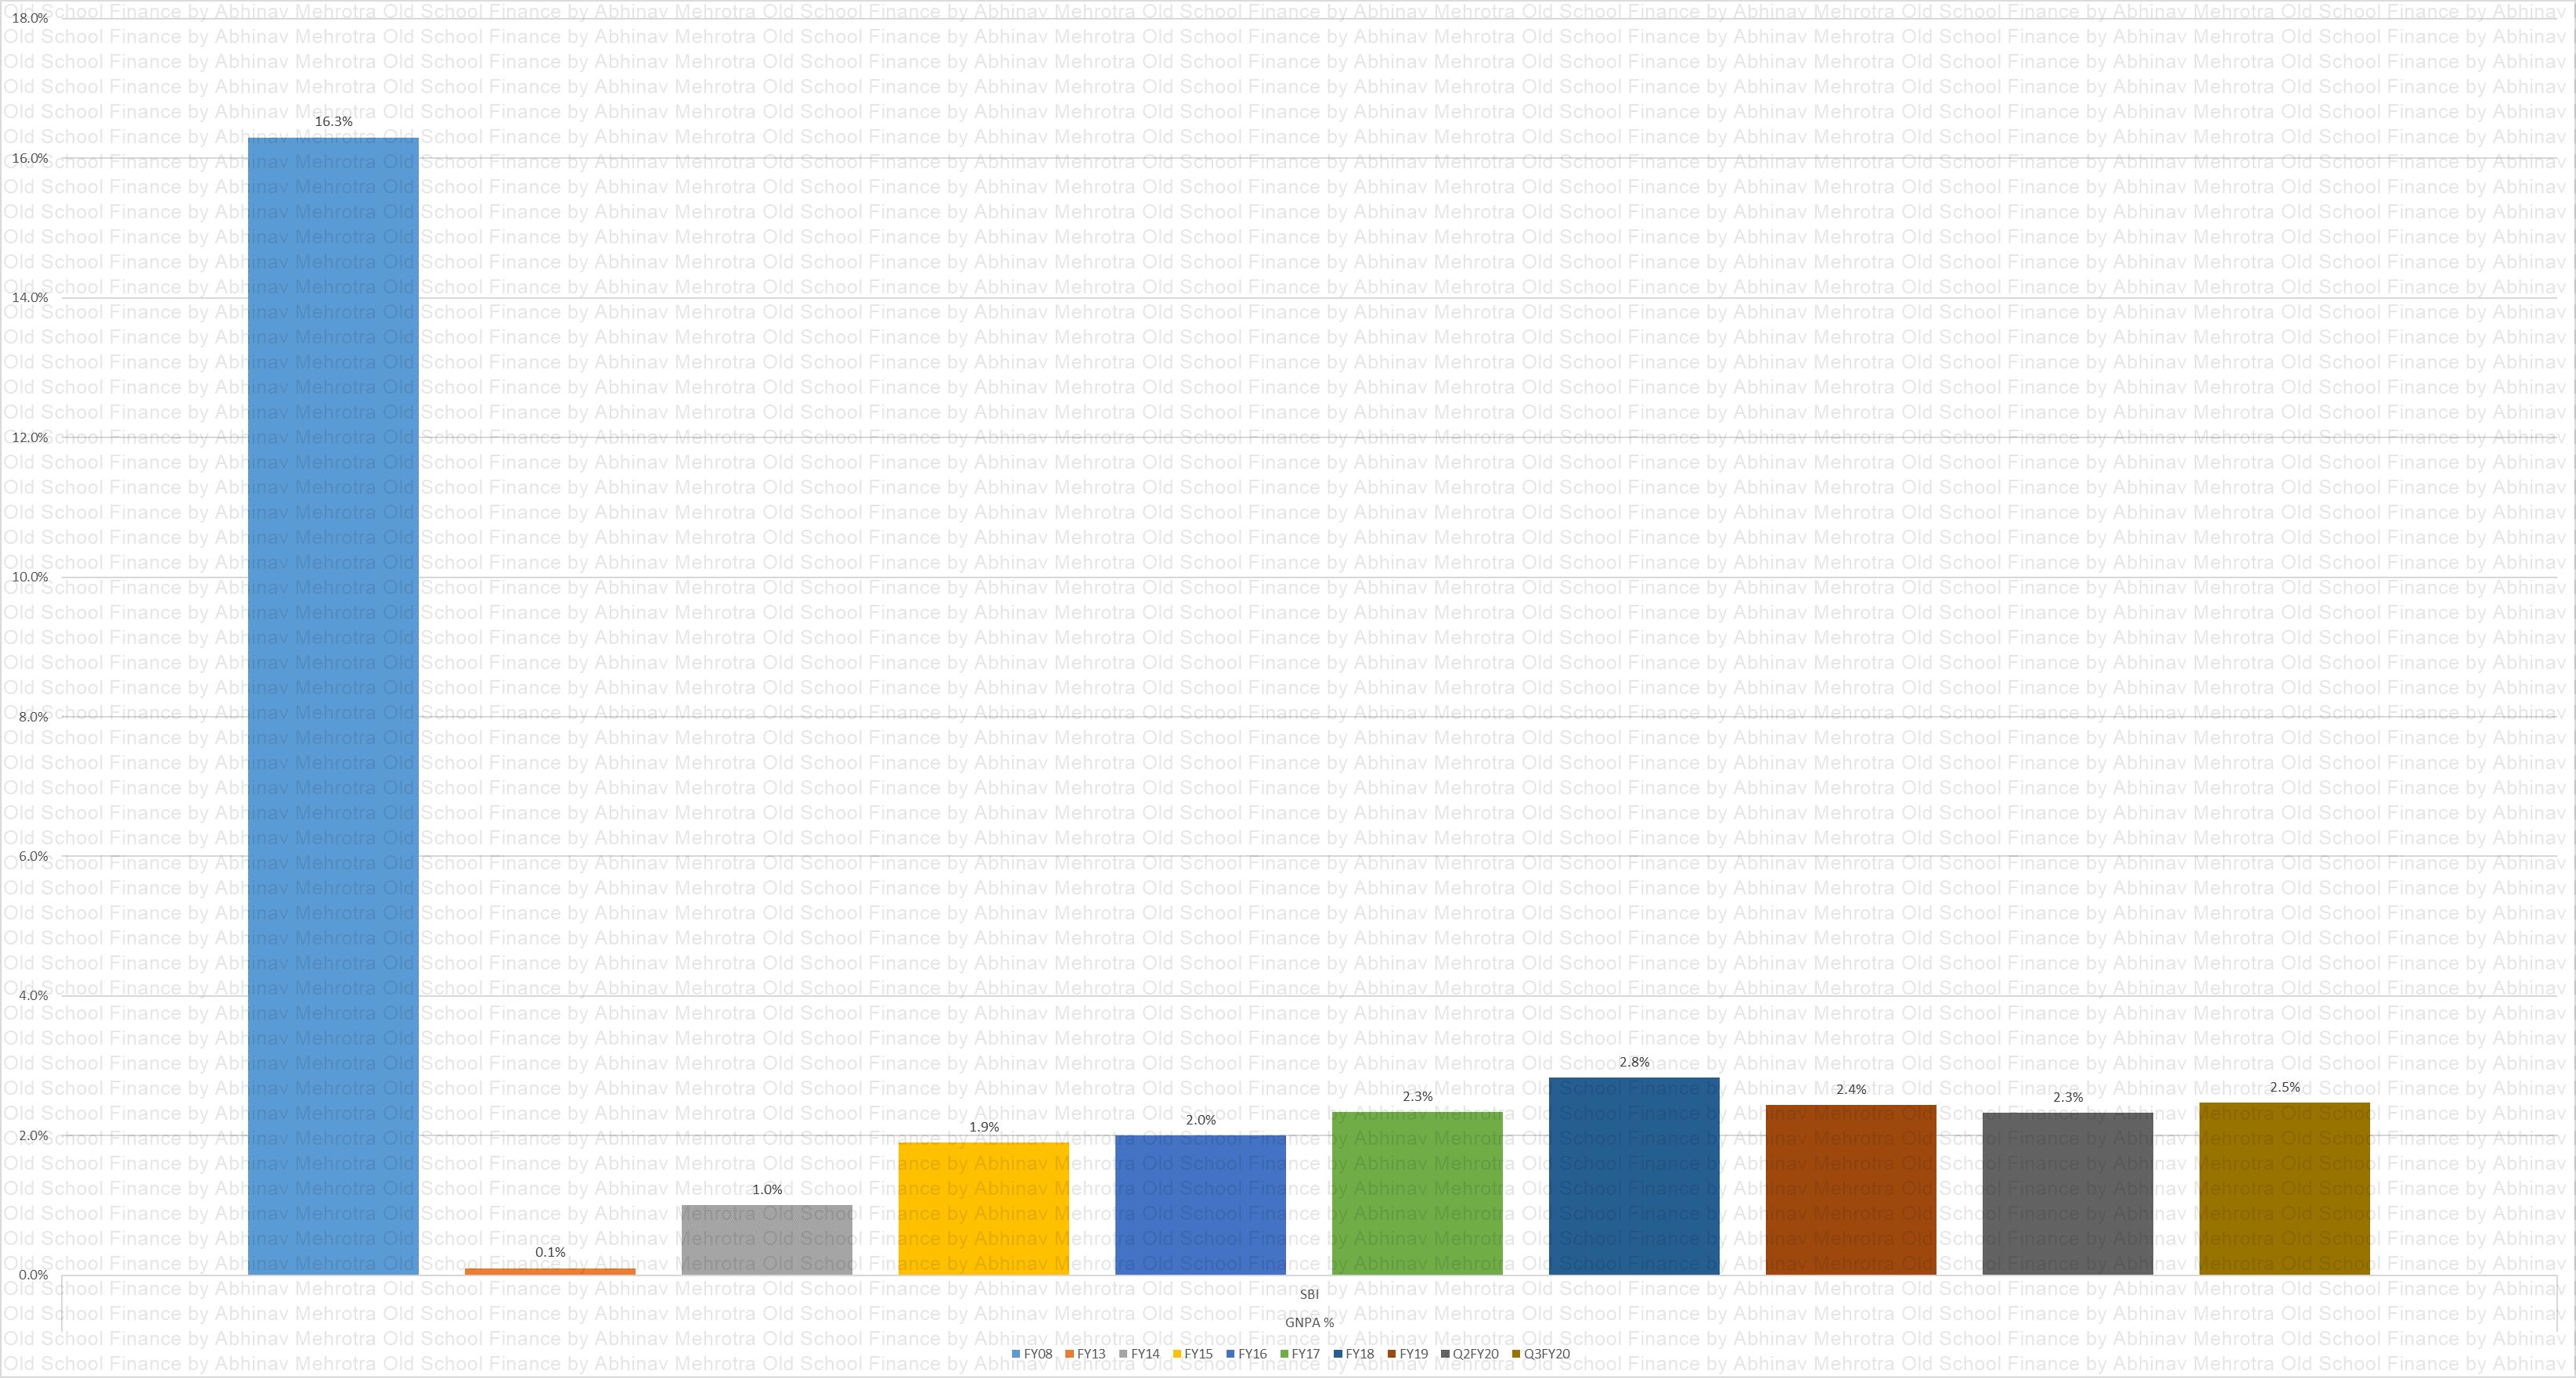
GNPA %
Chart 23 – GNPA % figures. Look at the FY08 tower of GNPA. Lending business runs well with management’s prime focus on underwriting. Without it, the entire shareholder’s equity will be wiped out. Whether this will happen again is difficult to determine unless we go in-depth into the history of the events that lead to this. What management incentives lead to such a disaster in the past is the question here.
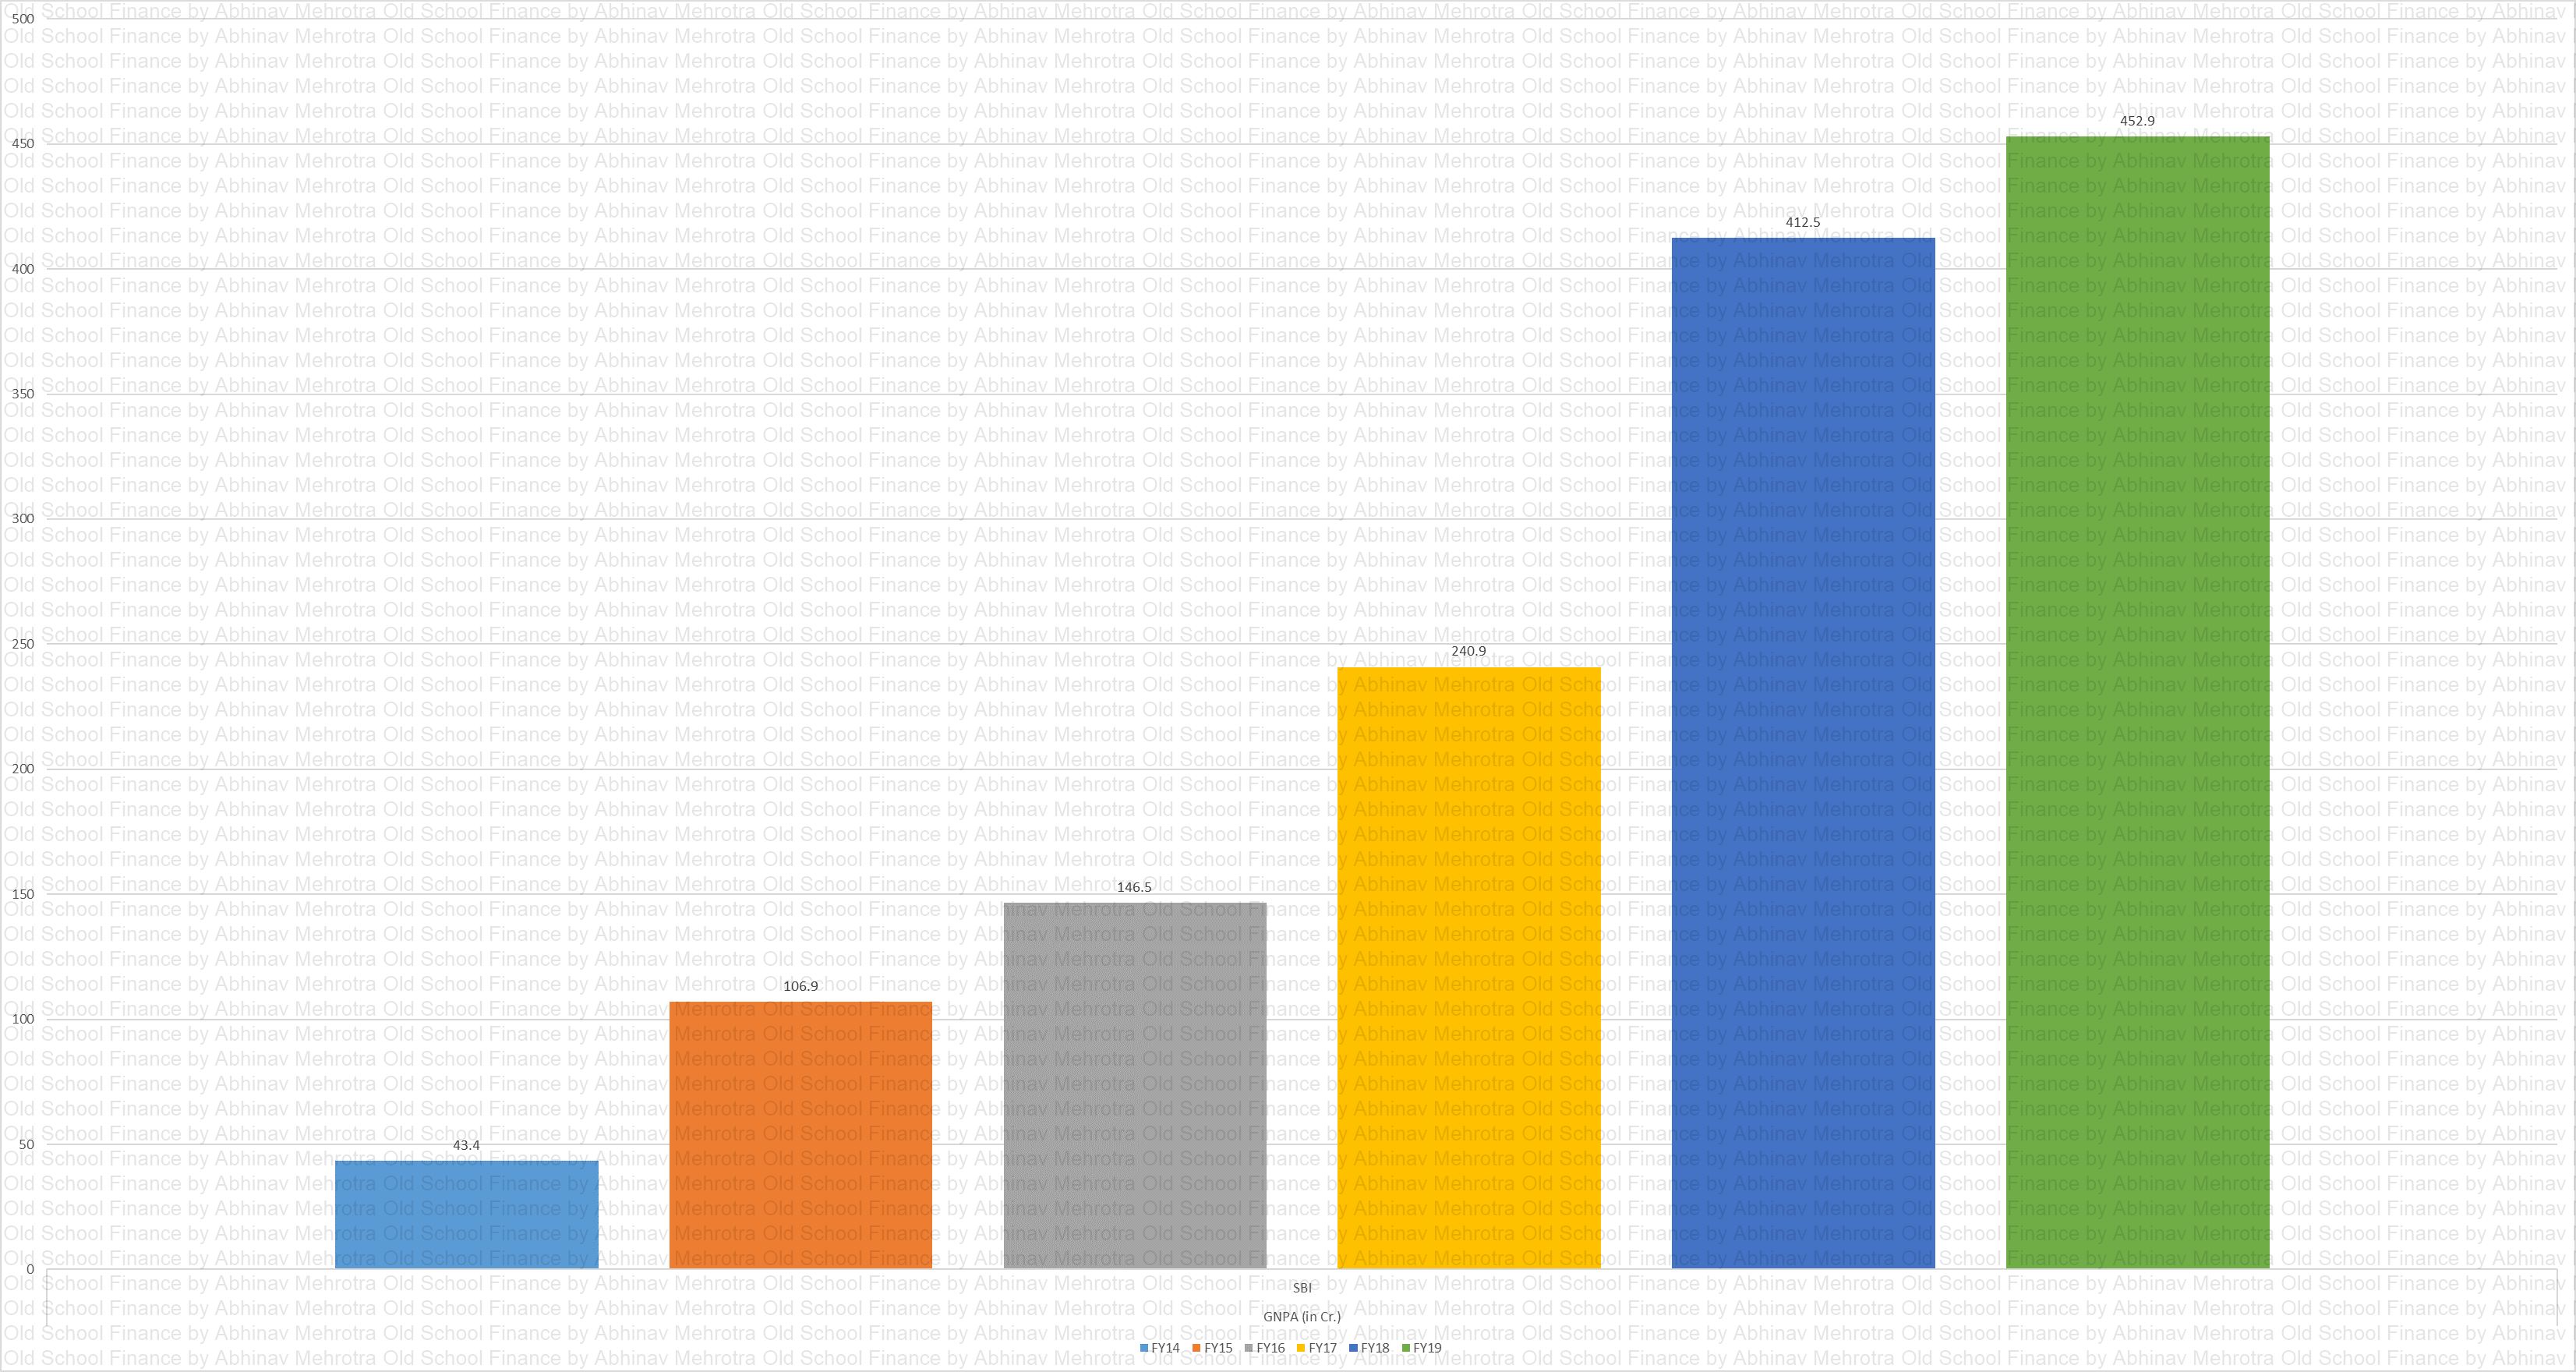
GNPA
Chart 24 – GNPA in absolute terms.
Income per Card
Chart 25 – Annual income per CIF. A mix of interest and fee-based income.
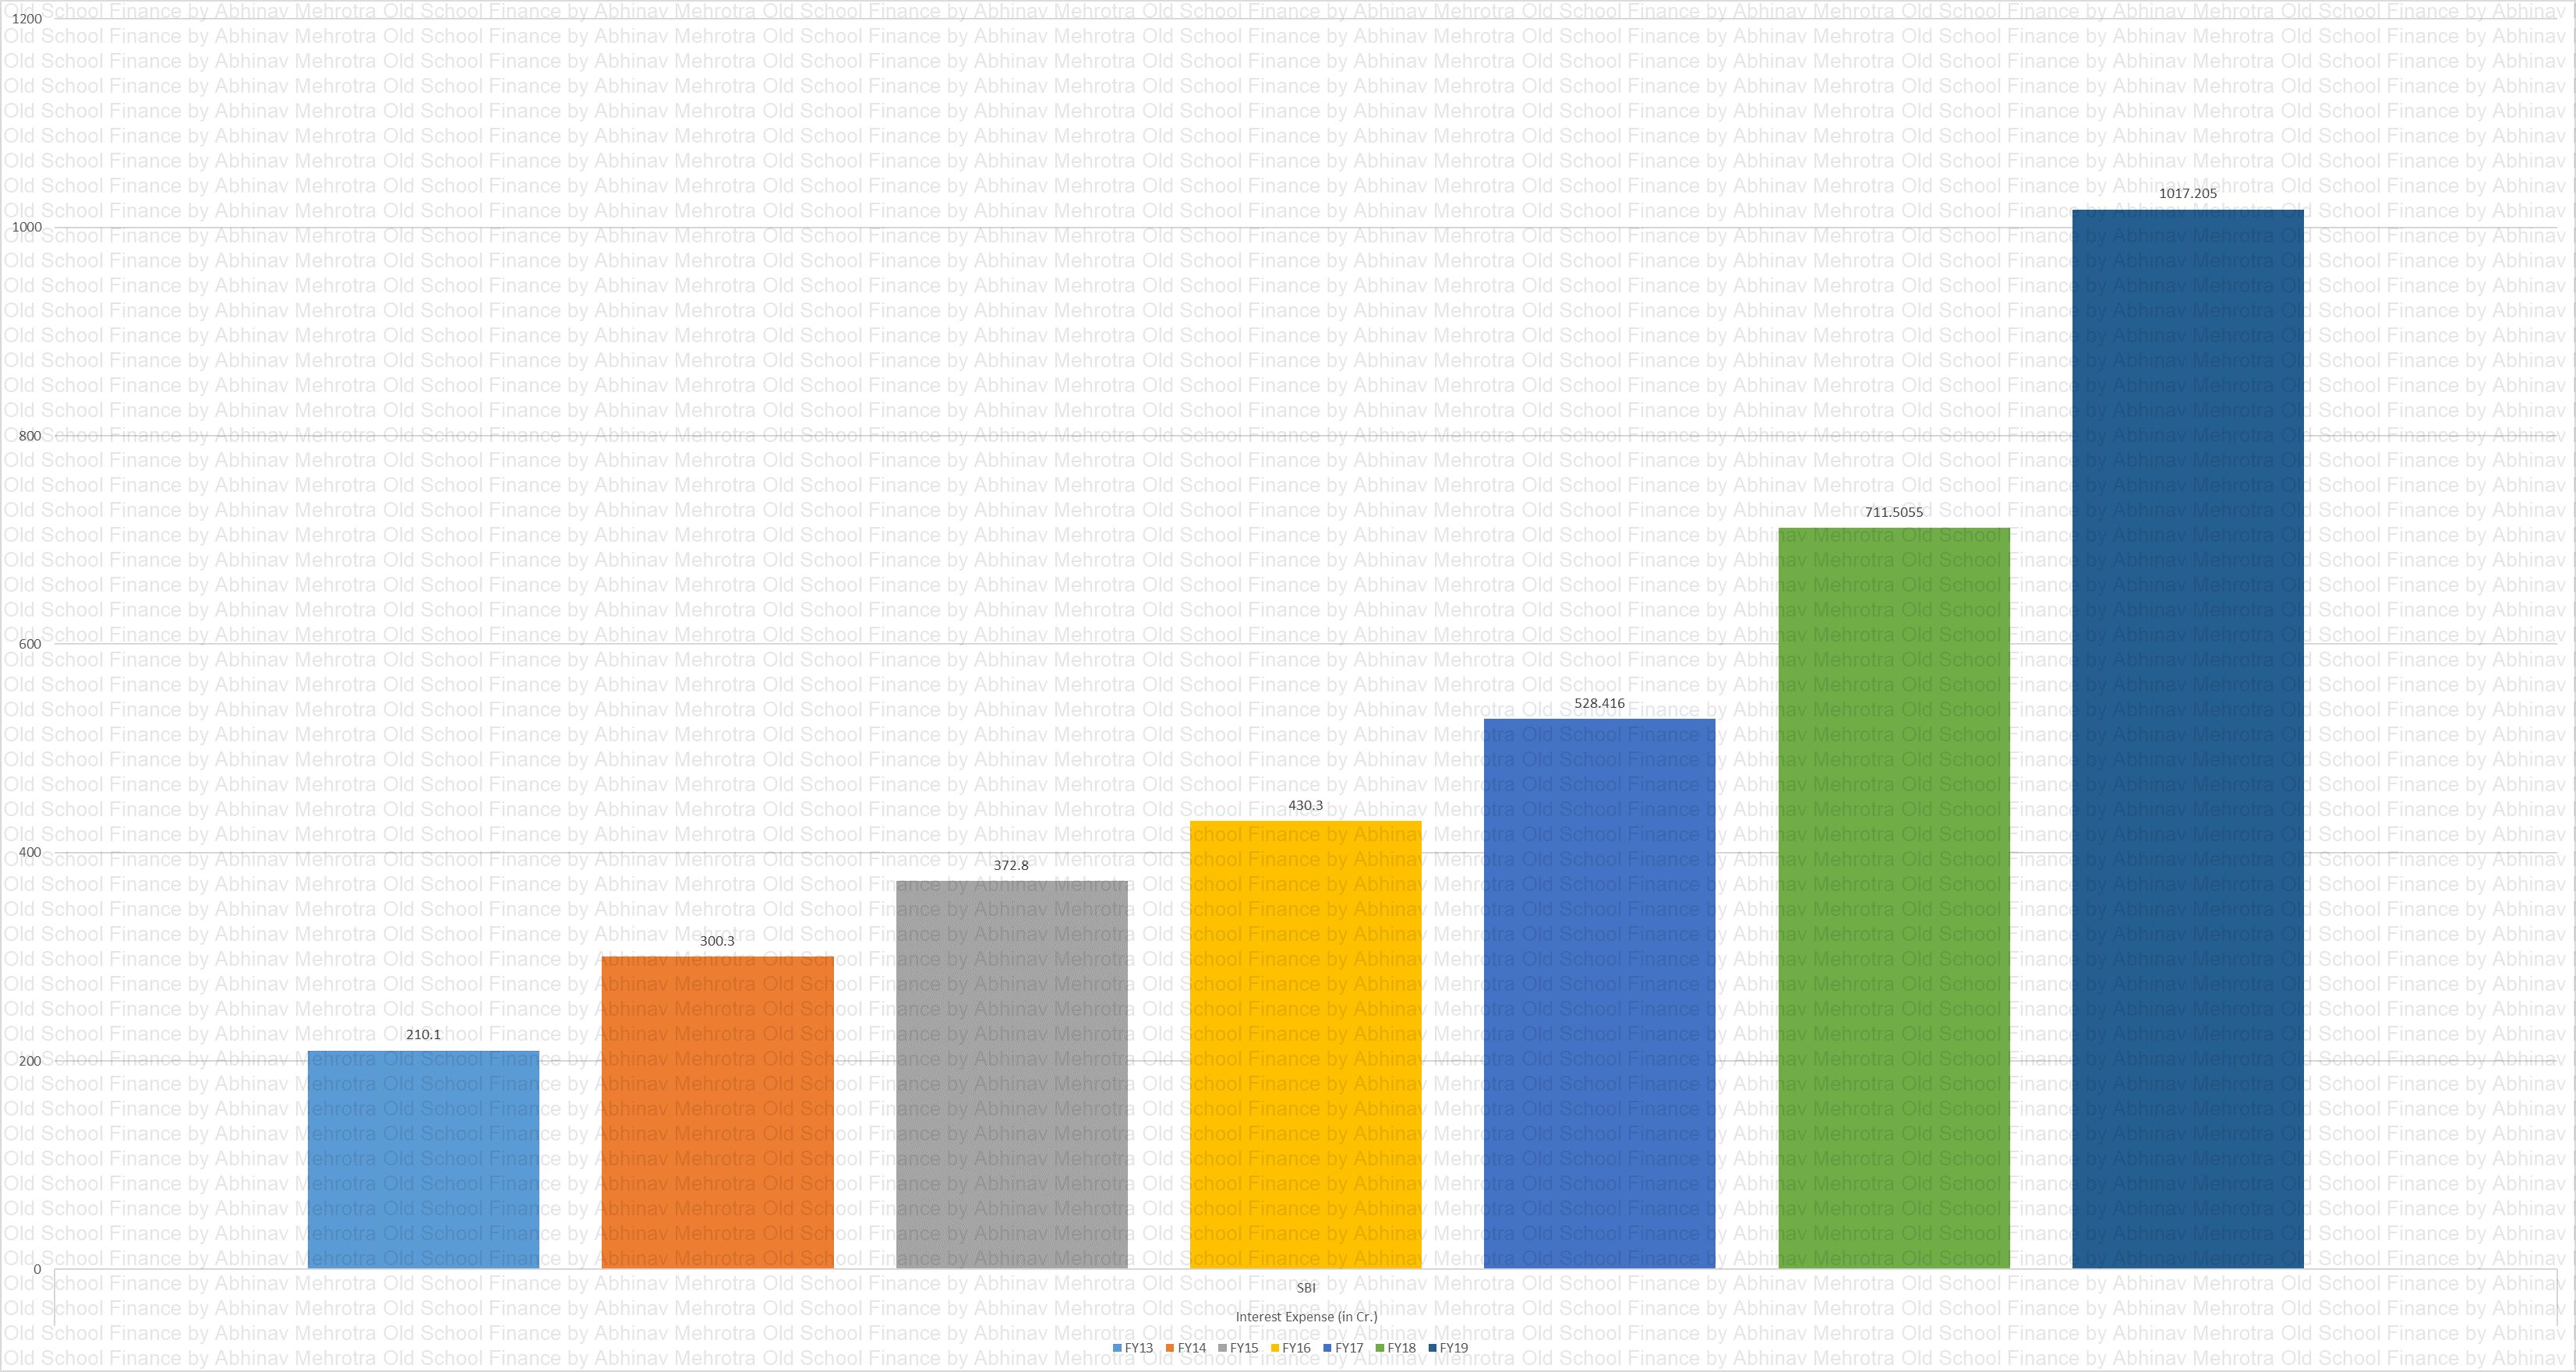
Int. Exp.
Chart 26 – Interest expense for SBI.
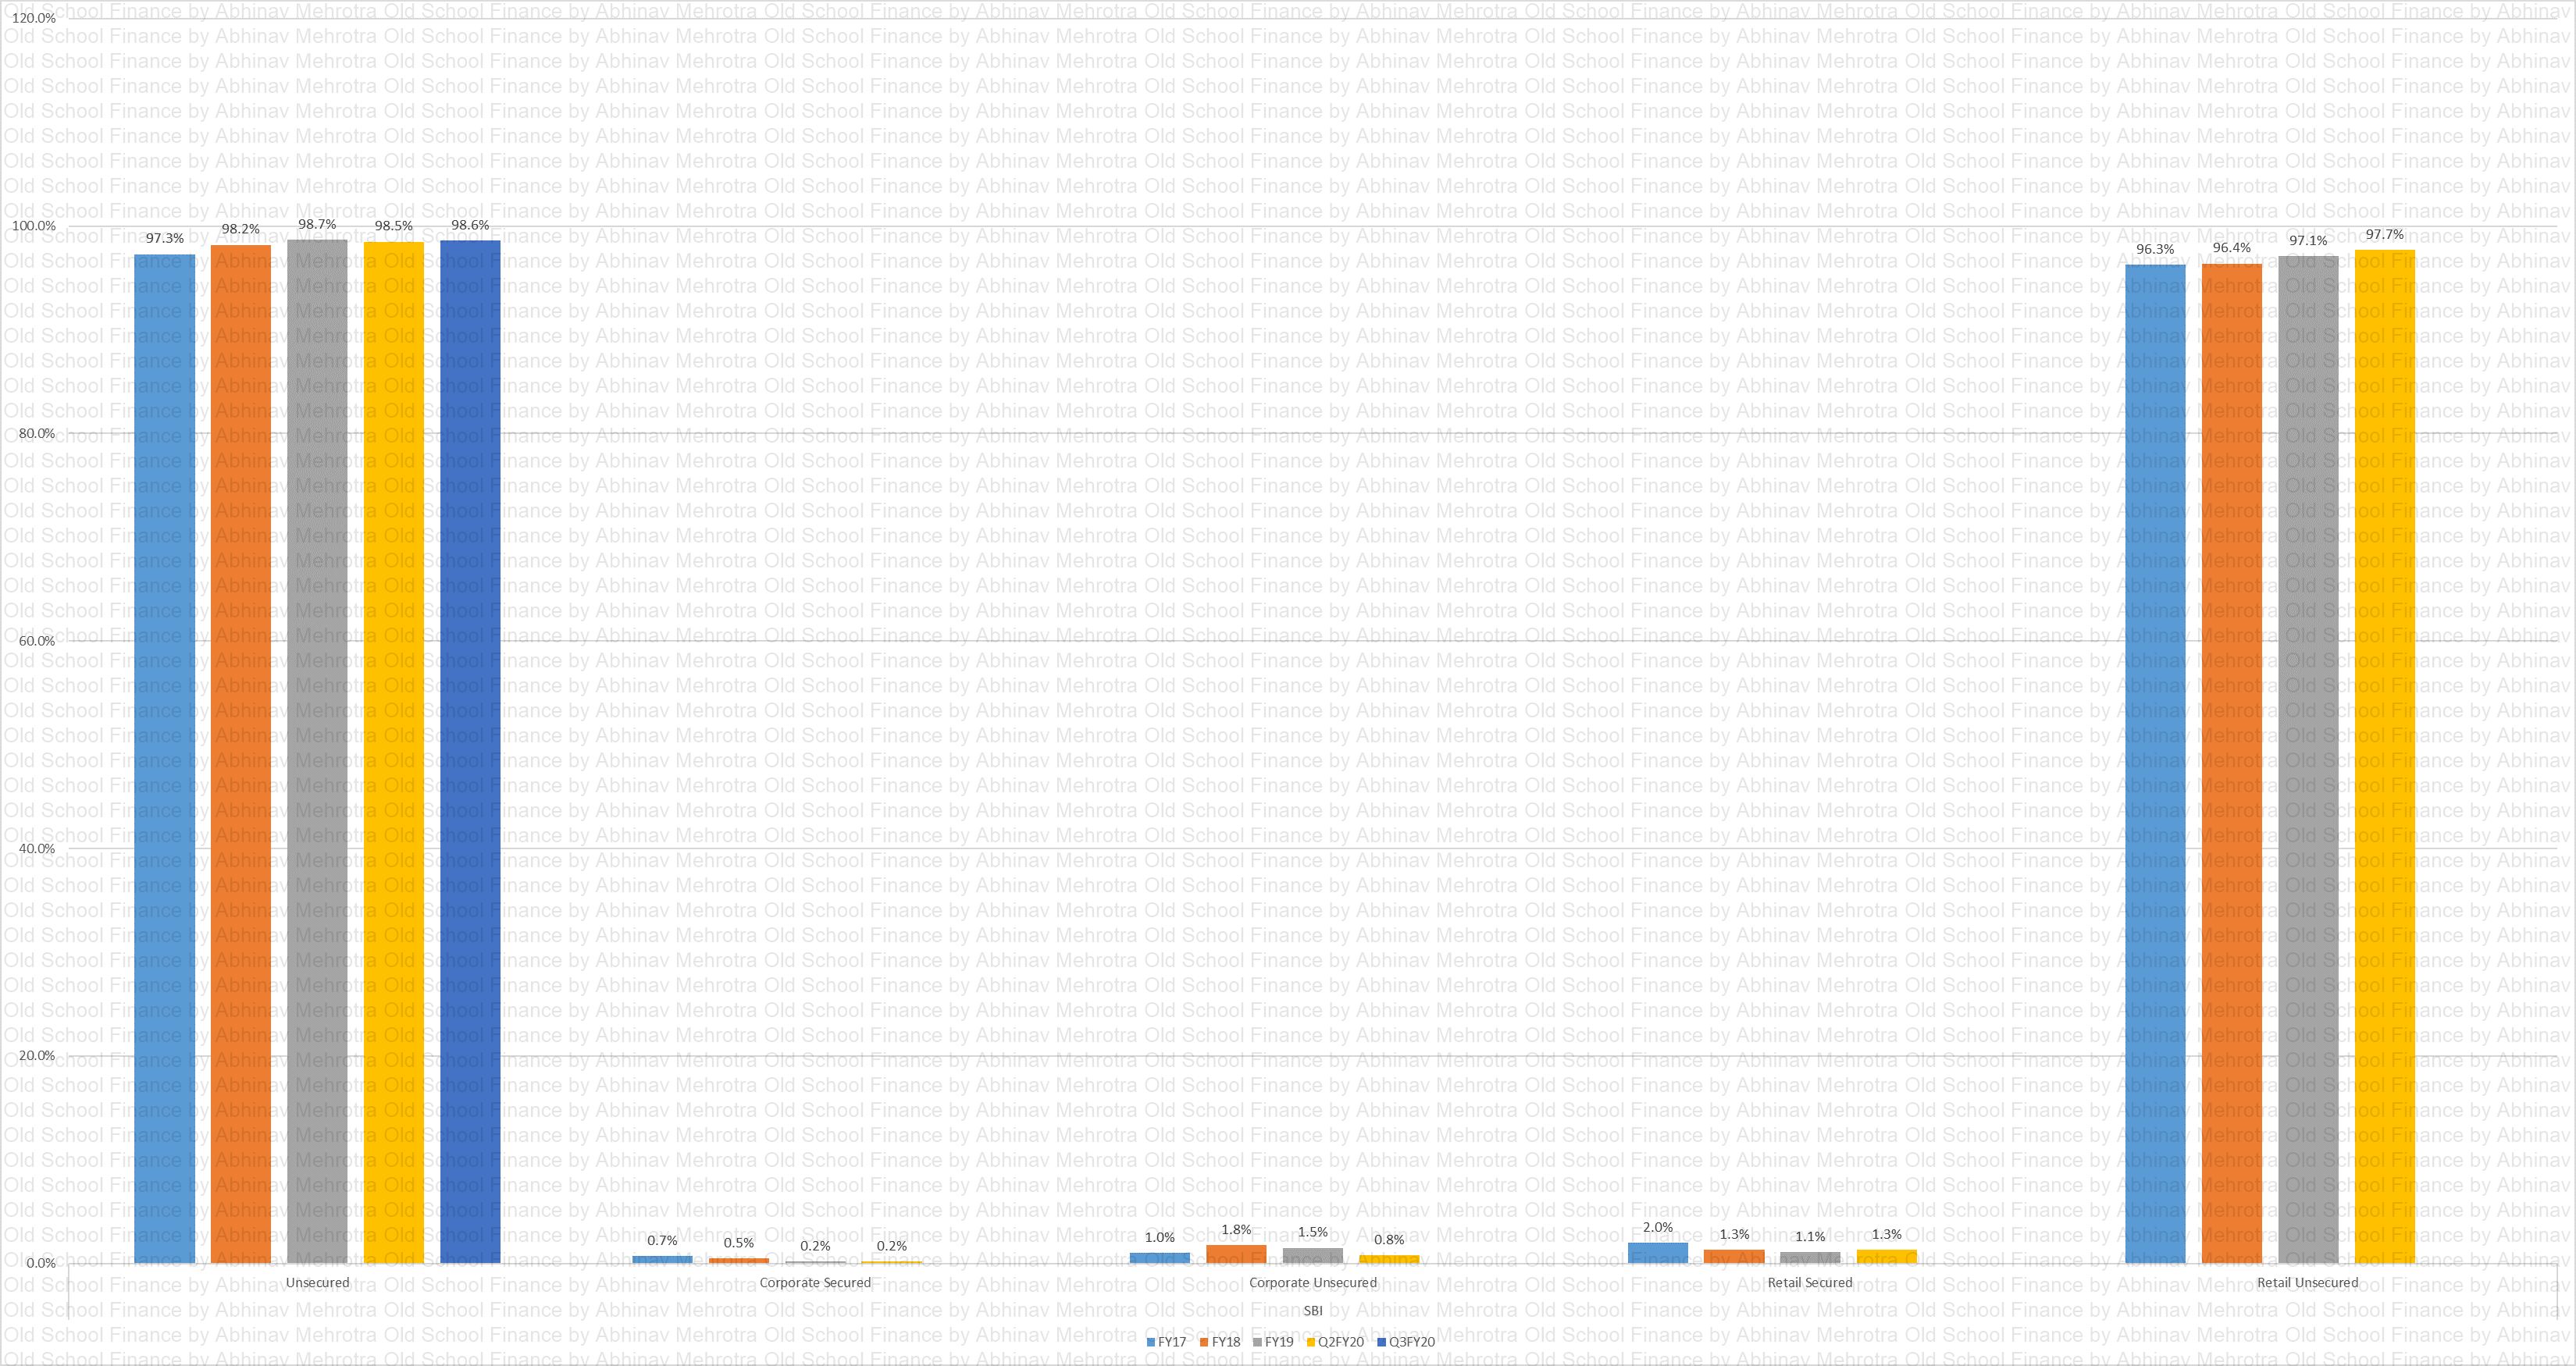
Loan Book Segmentation
Chart 27 – Loan book segmentation. Obviously, the majority of the loan book is unsecured. Would be good to see the contribution of corporates increase as they are big spenders.
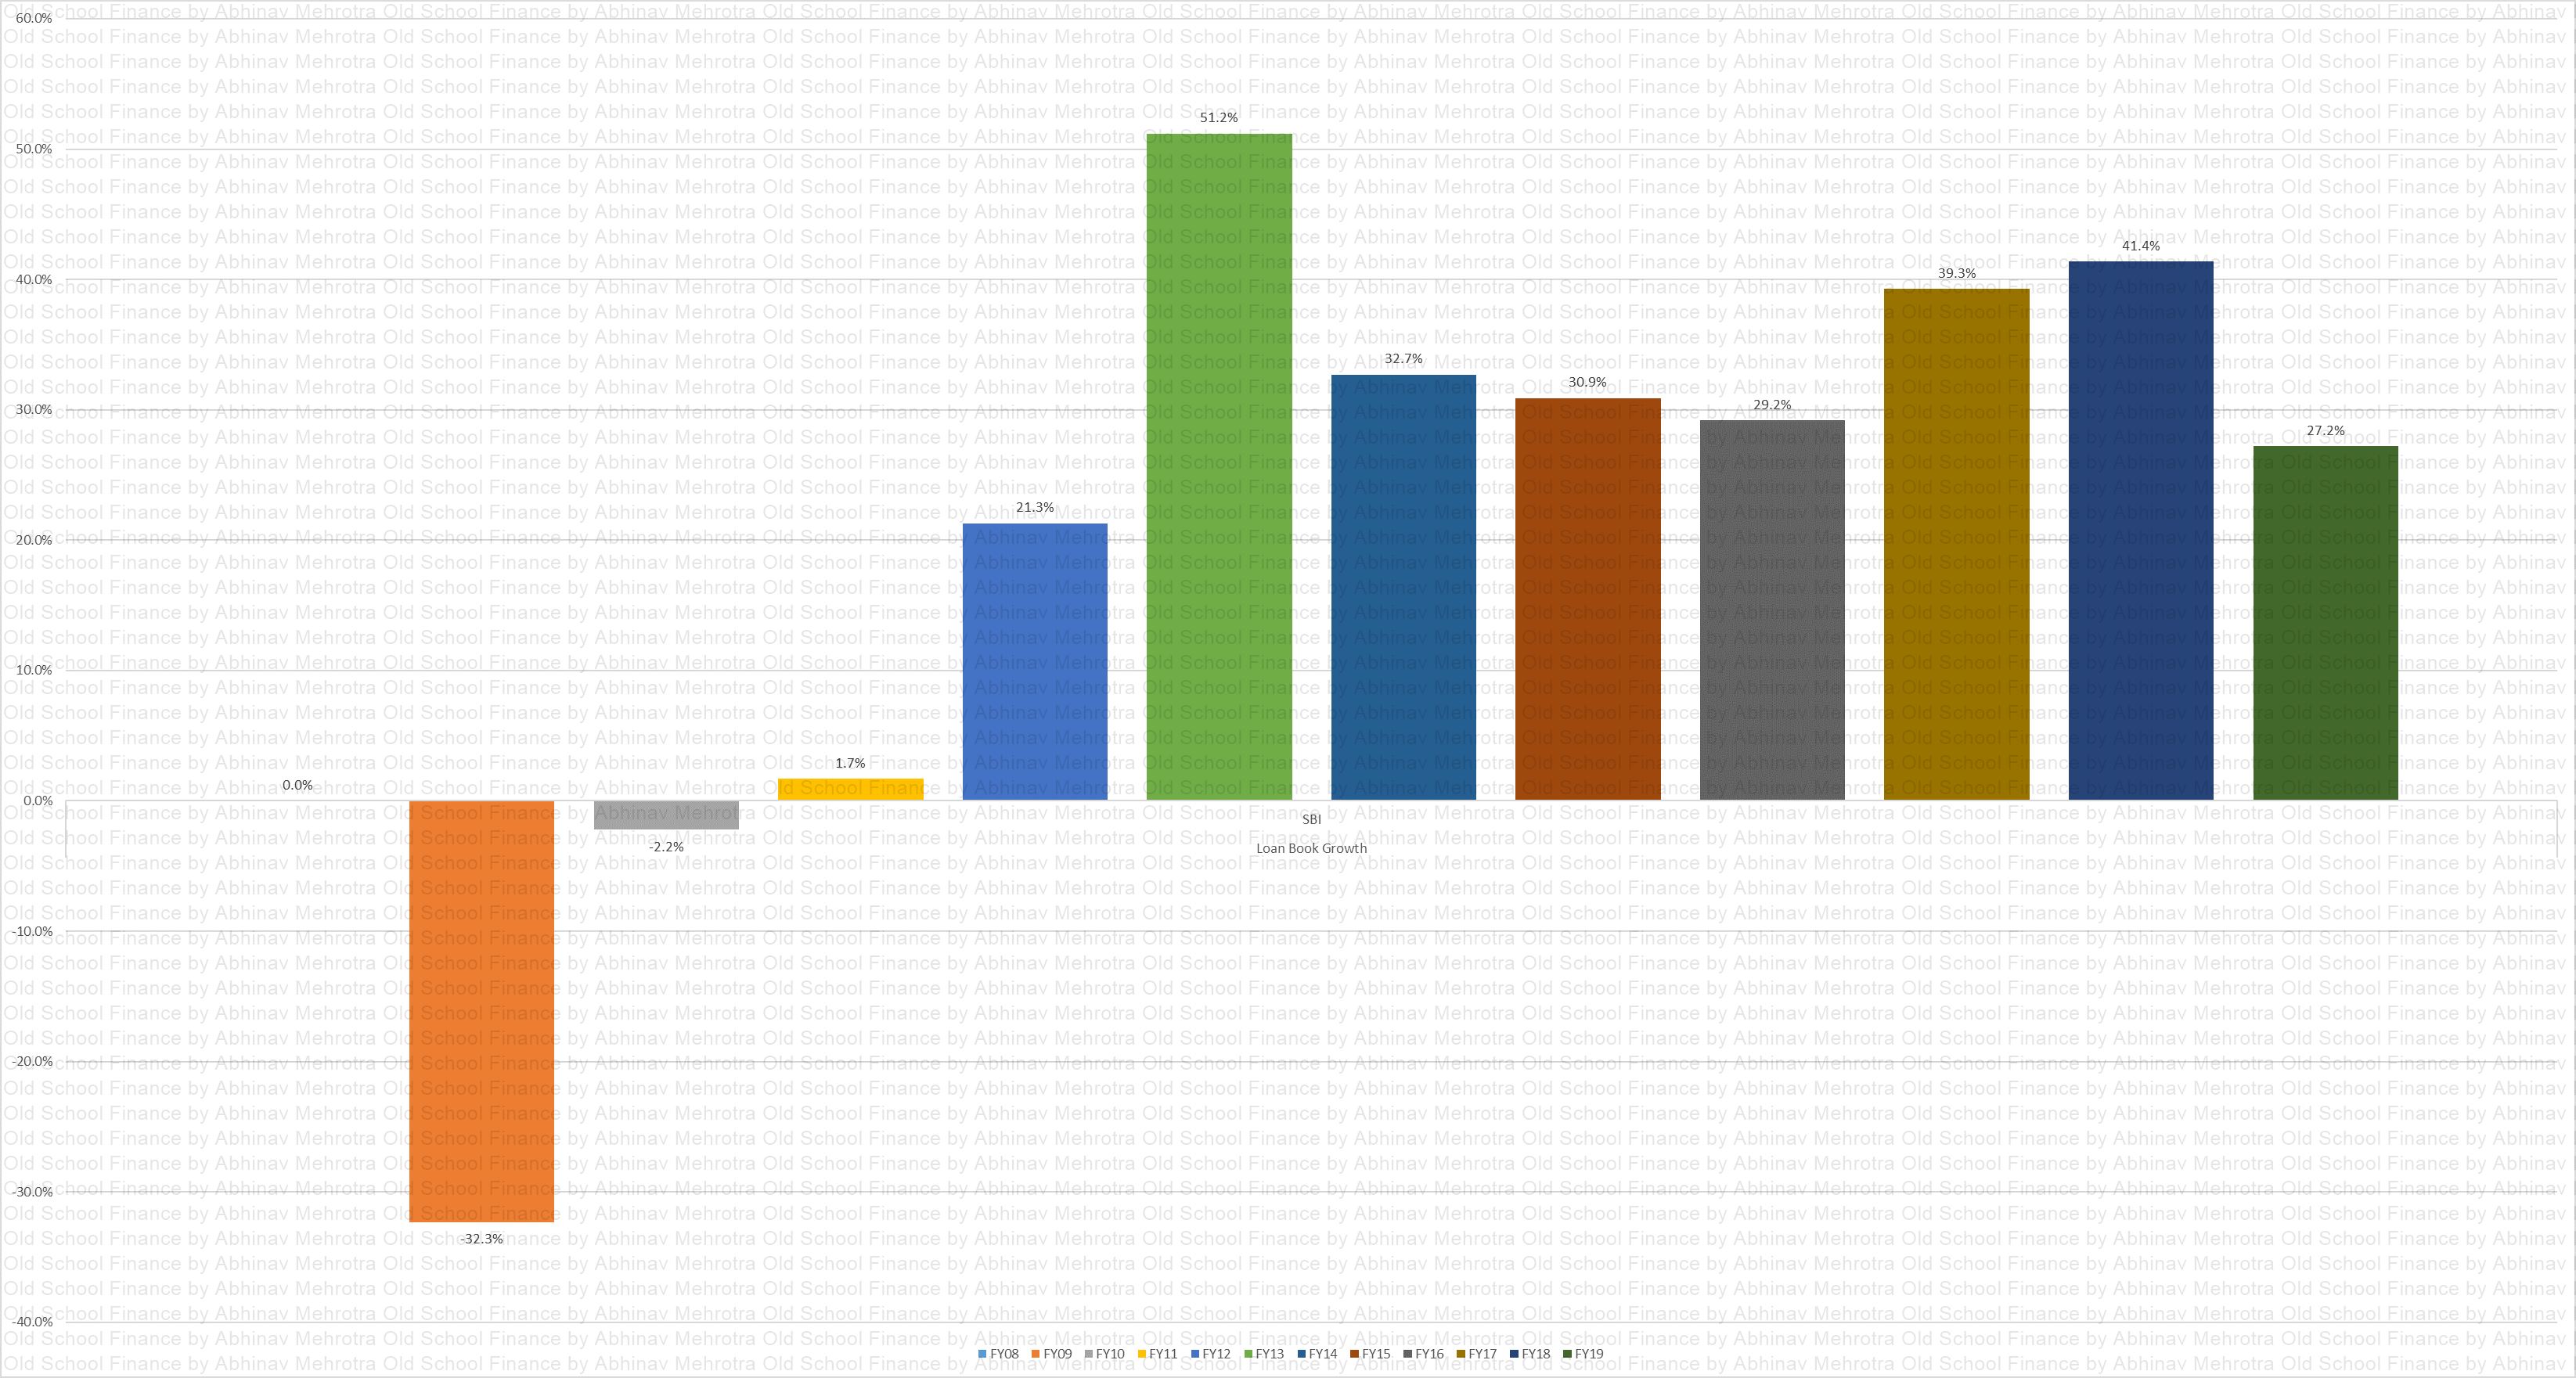
Loan Book Growth
Chart 28 – Loan book growth has been high for quite some time now. Ghosts of previous business cycle growth eventually show up if underwriting is not maintained.
Loan Book
Chart 29 – Loan book in absolute terms.
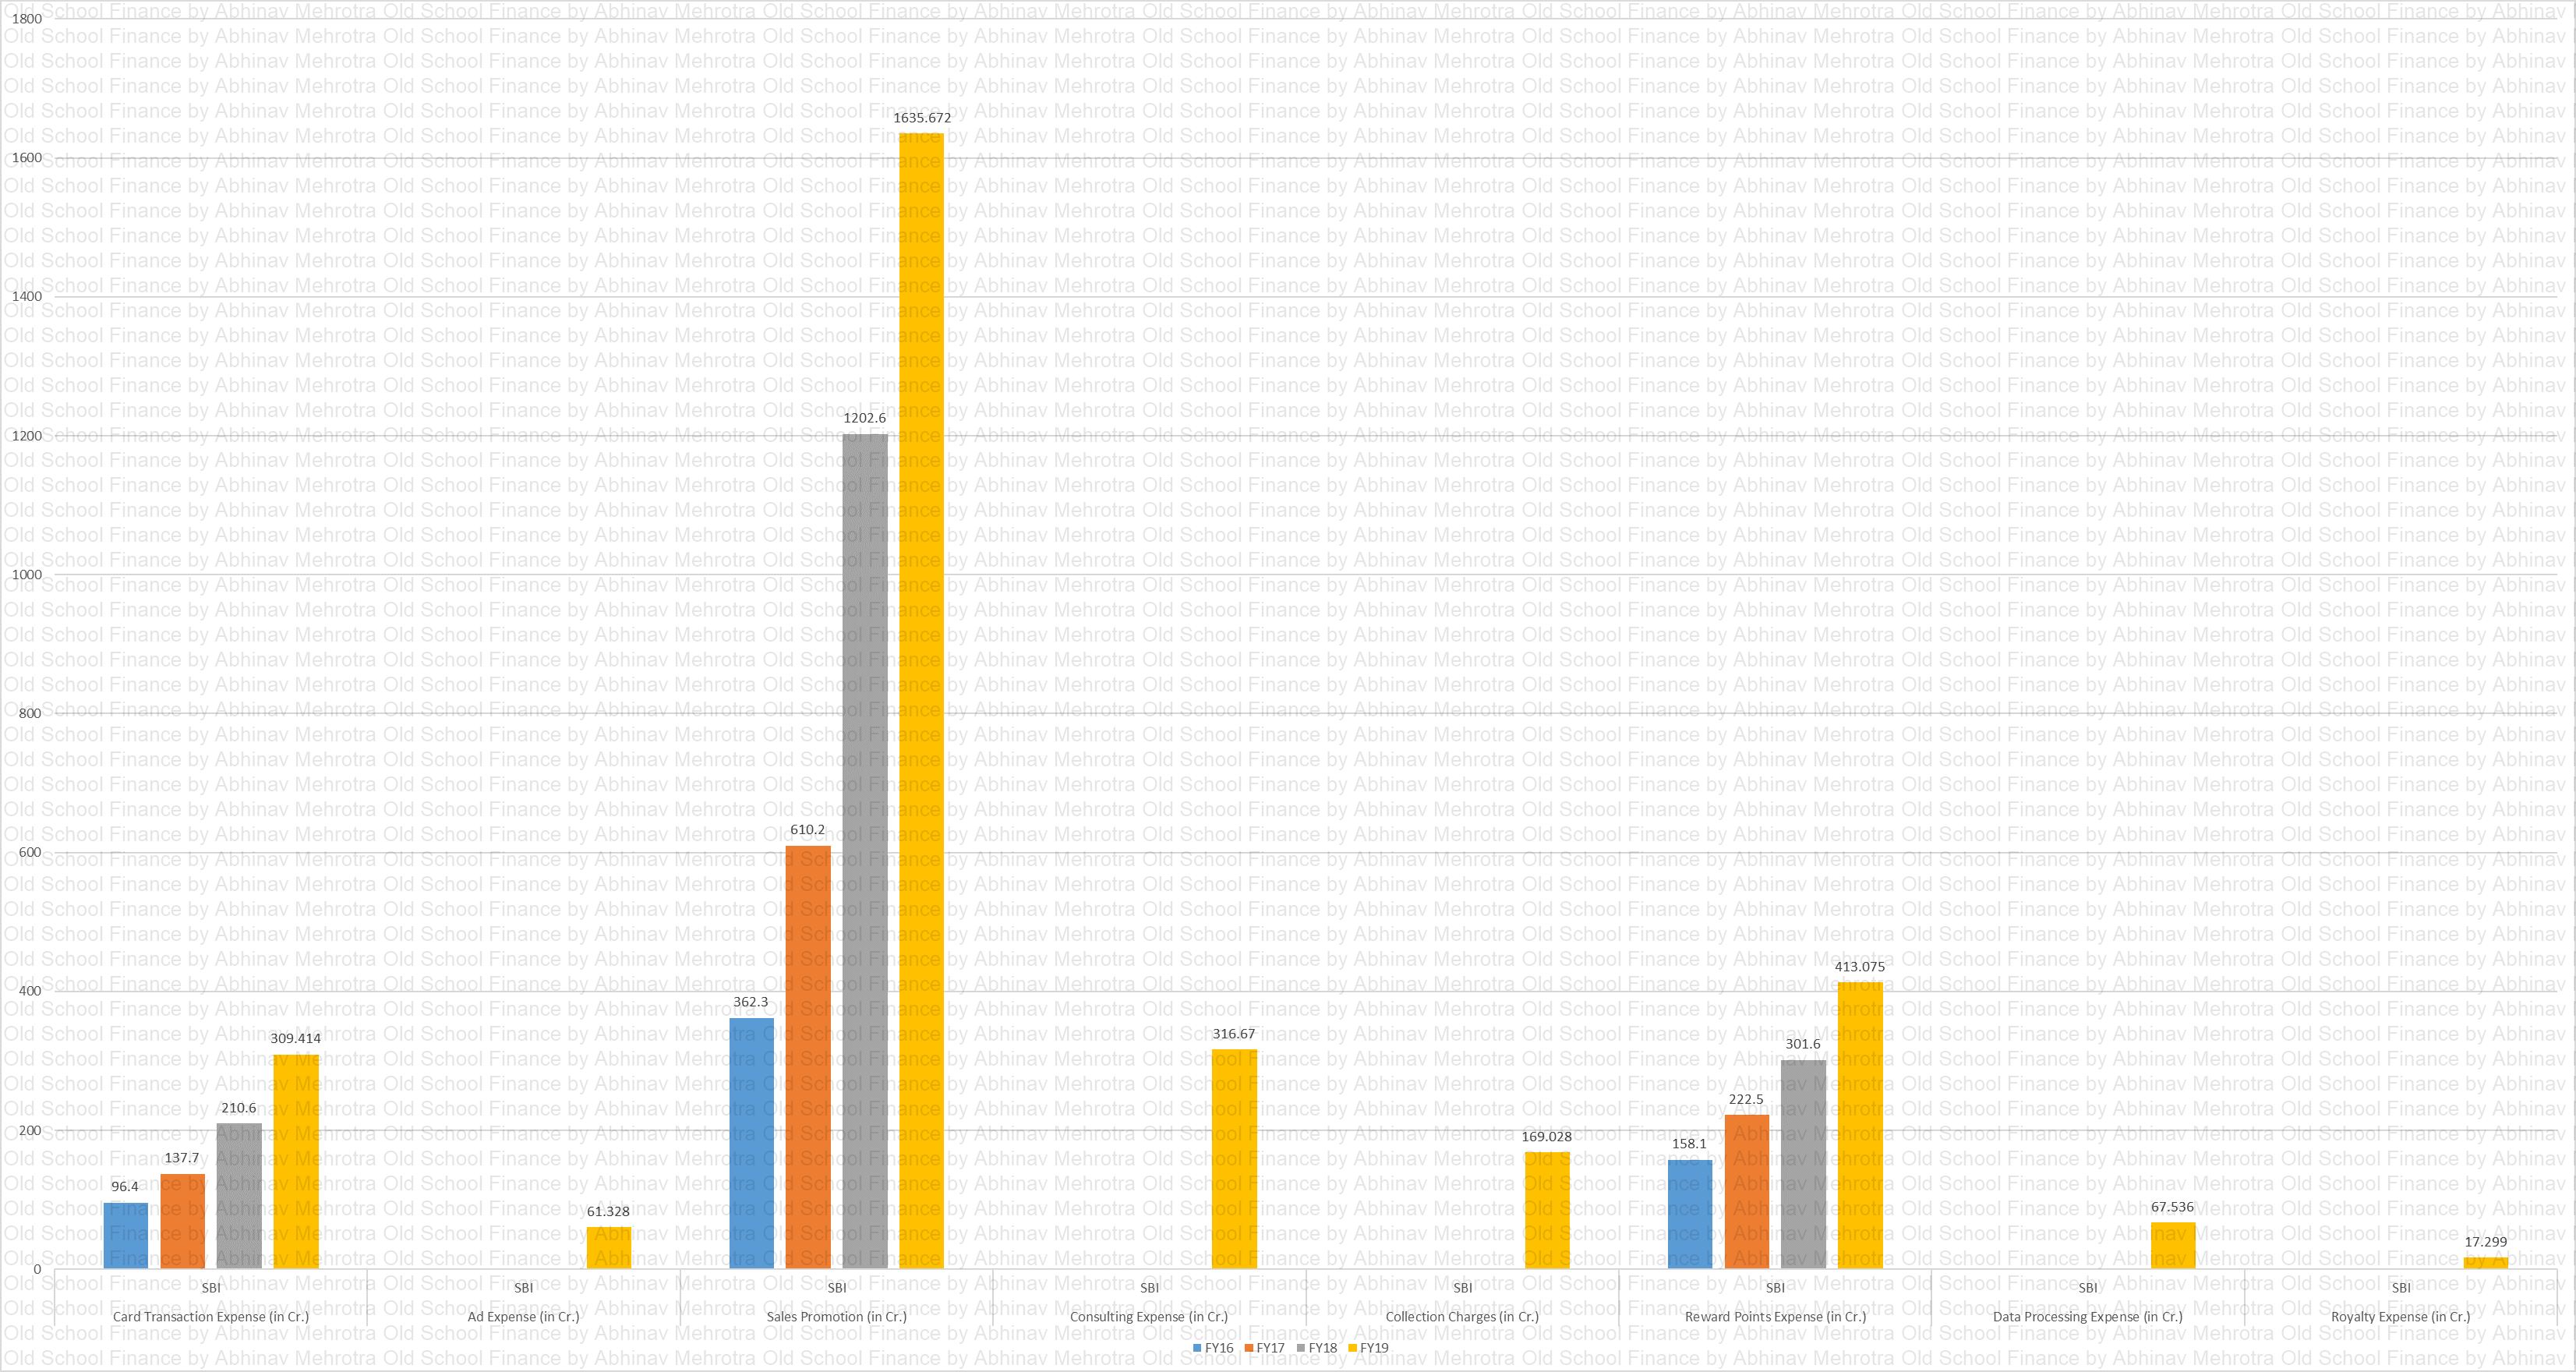
Misc. Exp.
Chart 30 – Misc. expenses over the years. Sales and promotion expense has increased 5x in 4 years. Will this be a constant expense to acquire more customers or will it end with the IPO listing? If it continues this will lead to some serious CAC (Customer Acquisition Cost). The company acquired some 20 lac cards in FY19, and thus they spent Rs. 8178 per card in just promotions, offers in a bid to acquire the customer. Other costs are yet to be expensed and their income per card in FY19 was Rs. 10,030. Will have to dig further into their CAC to determine from which year is the customer relationship profitable for the company.
% Misc. Exp.
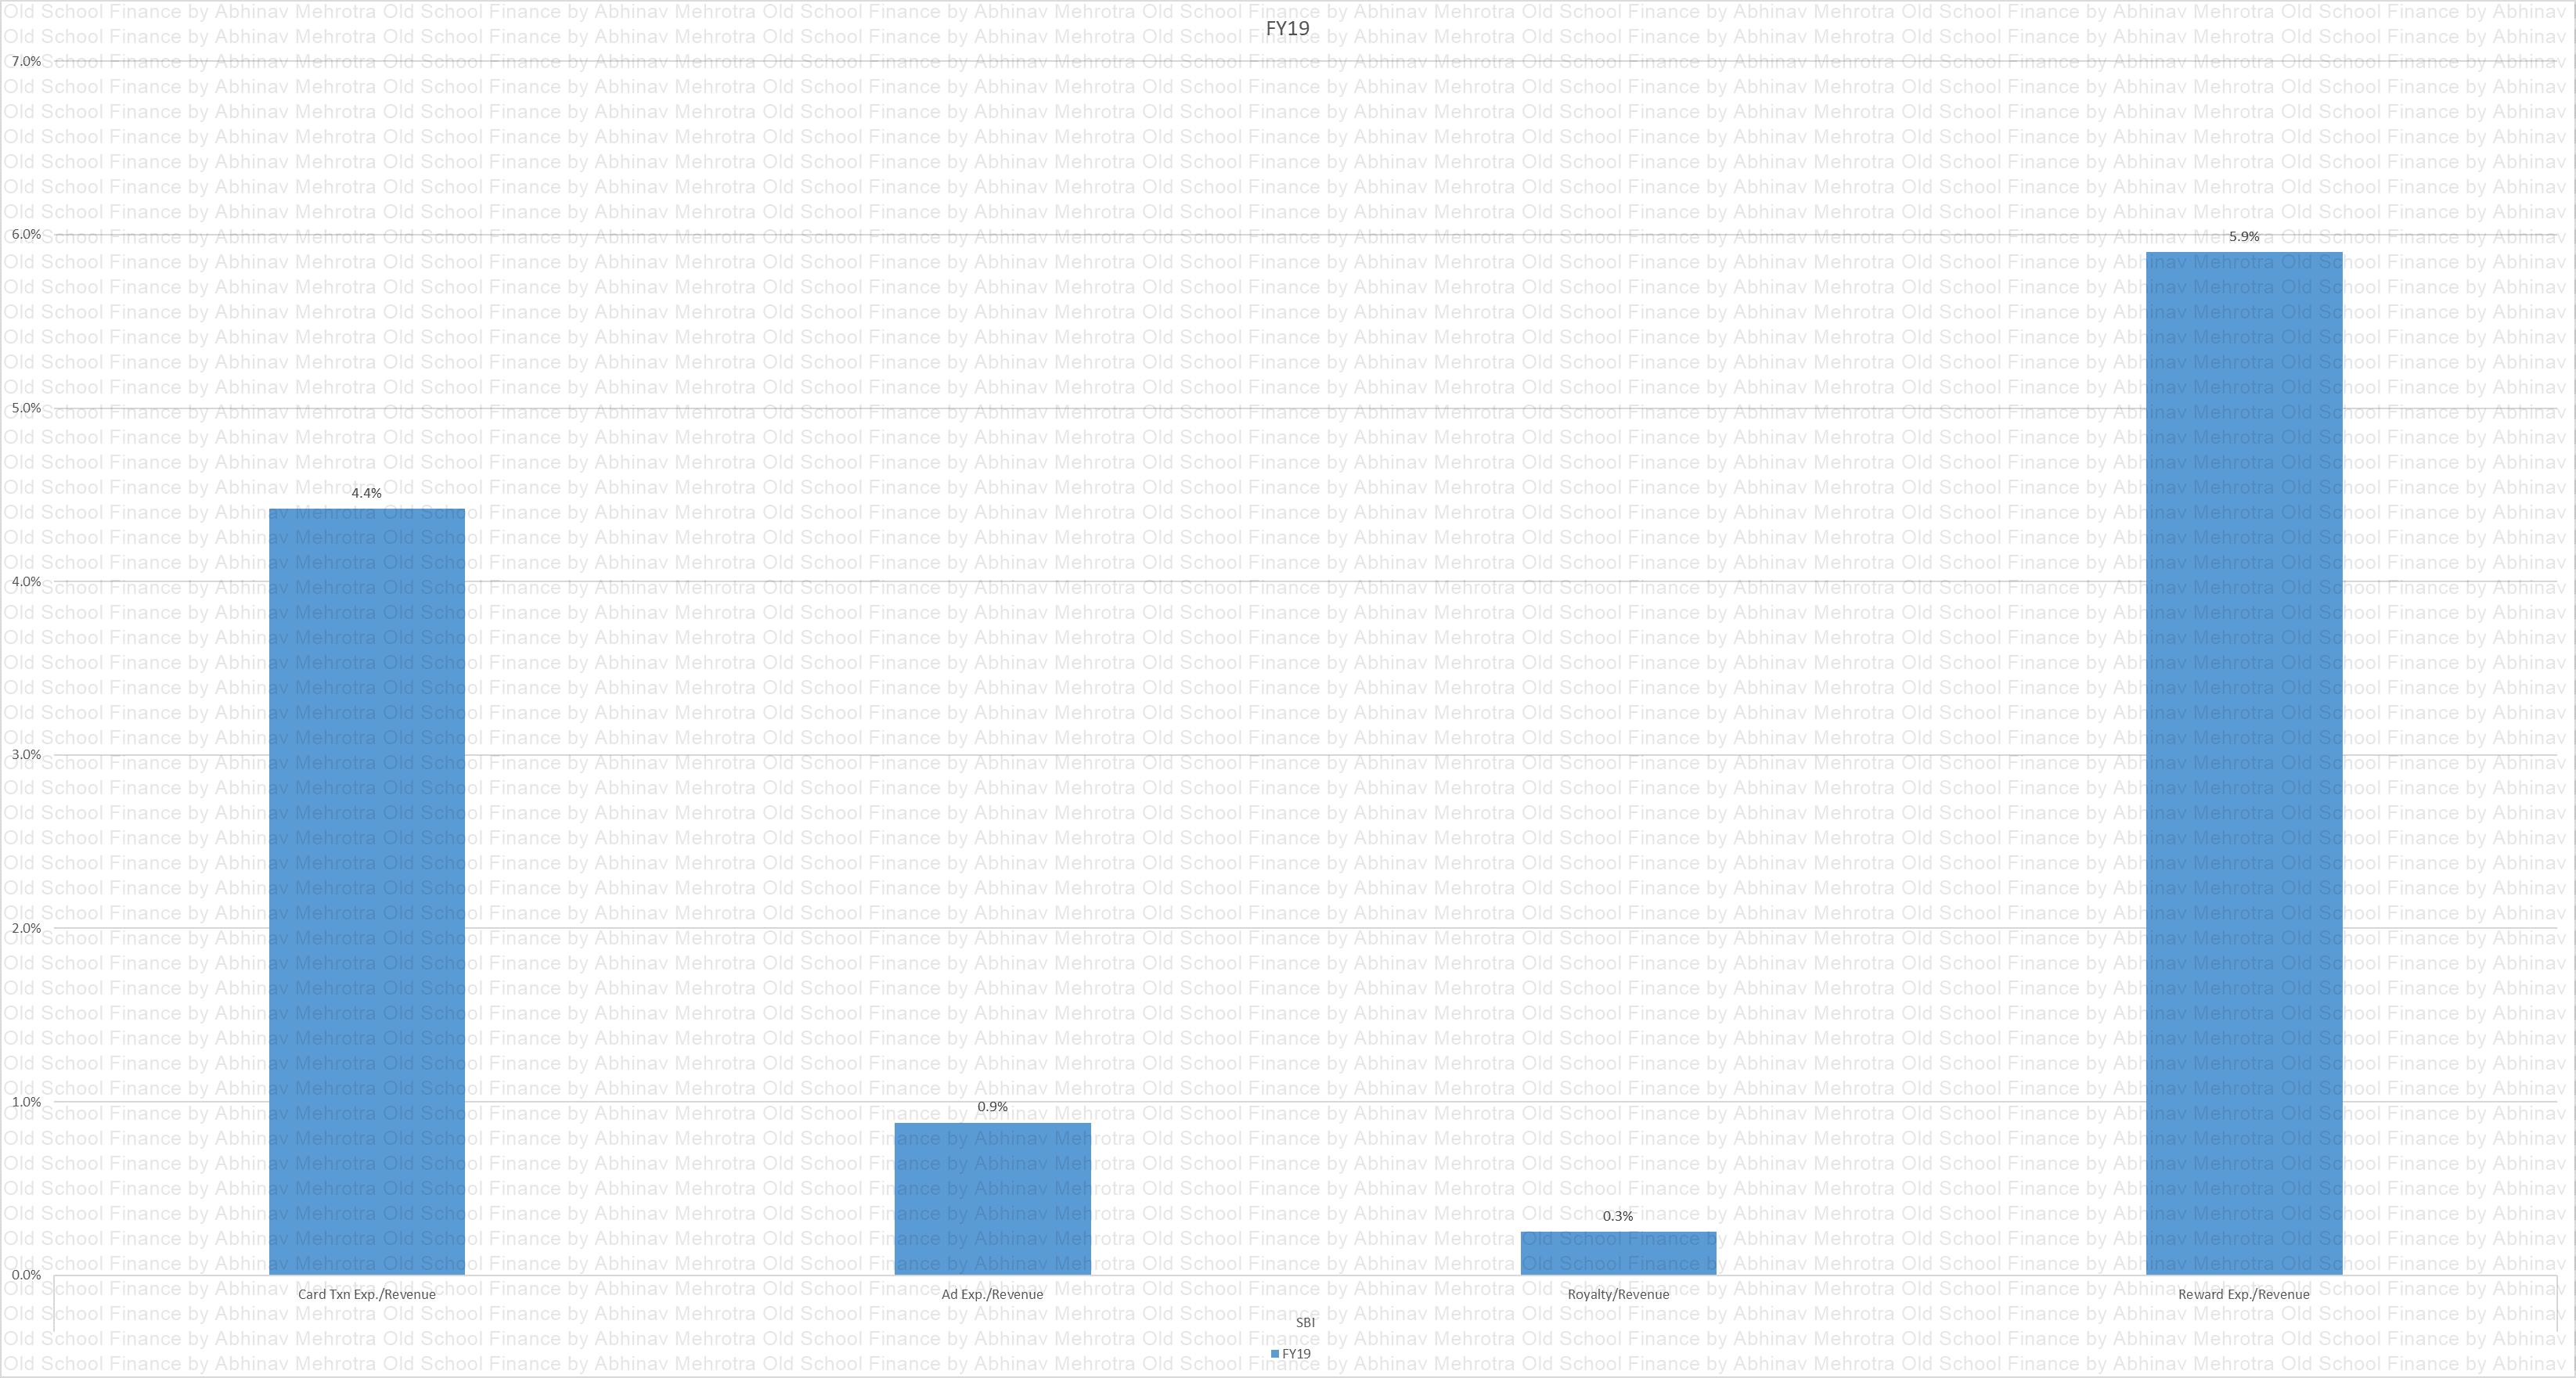
Chart 31 – Misc. expenses as a percentage of revenue. See that royalty figure, we will discuss that at the end.
Net Worth
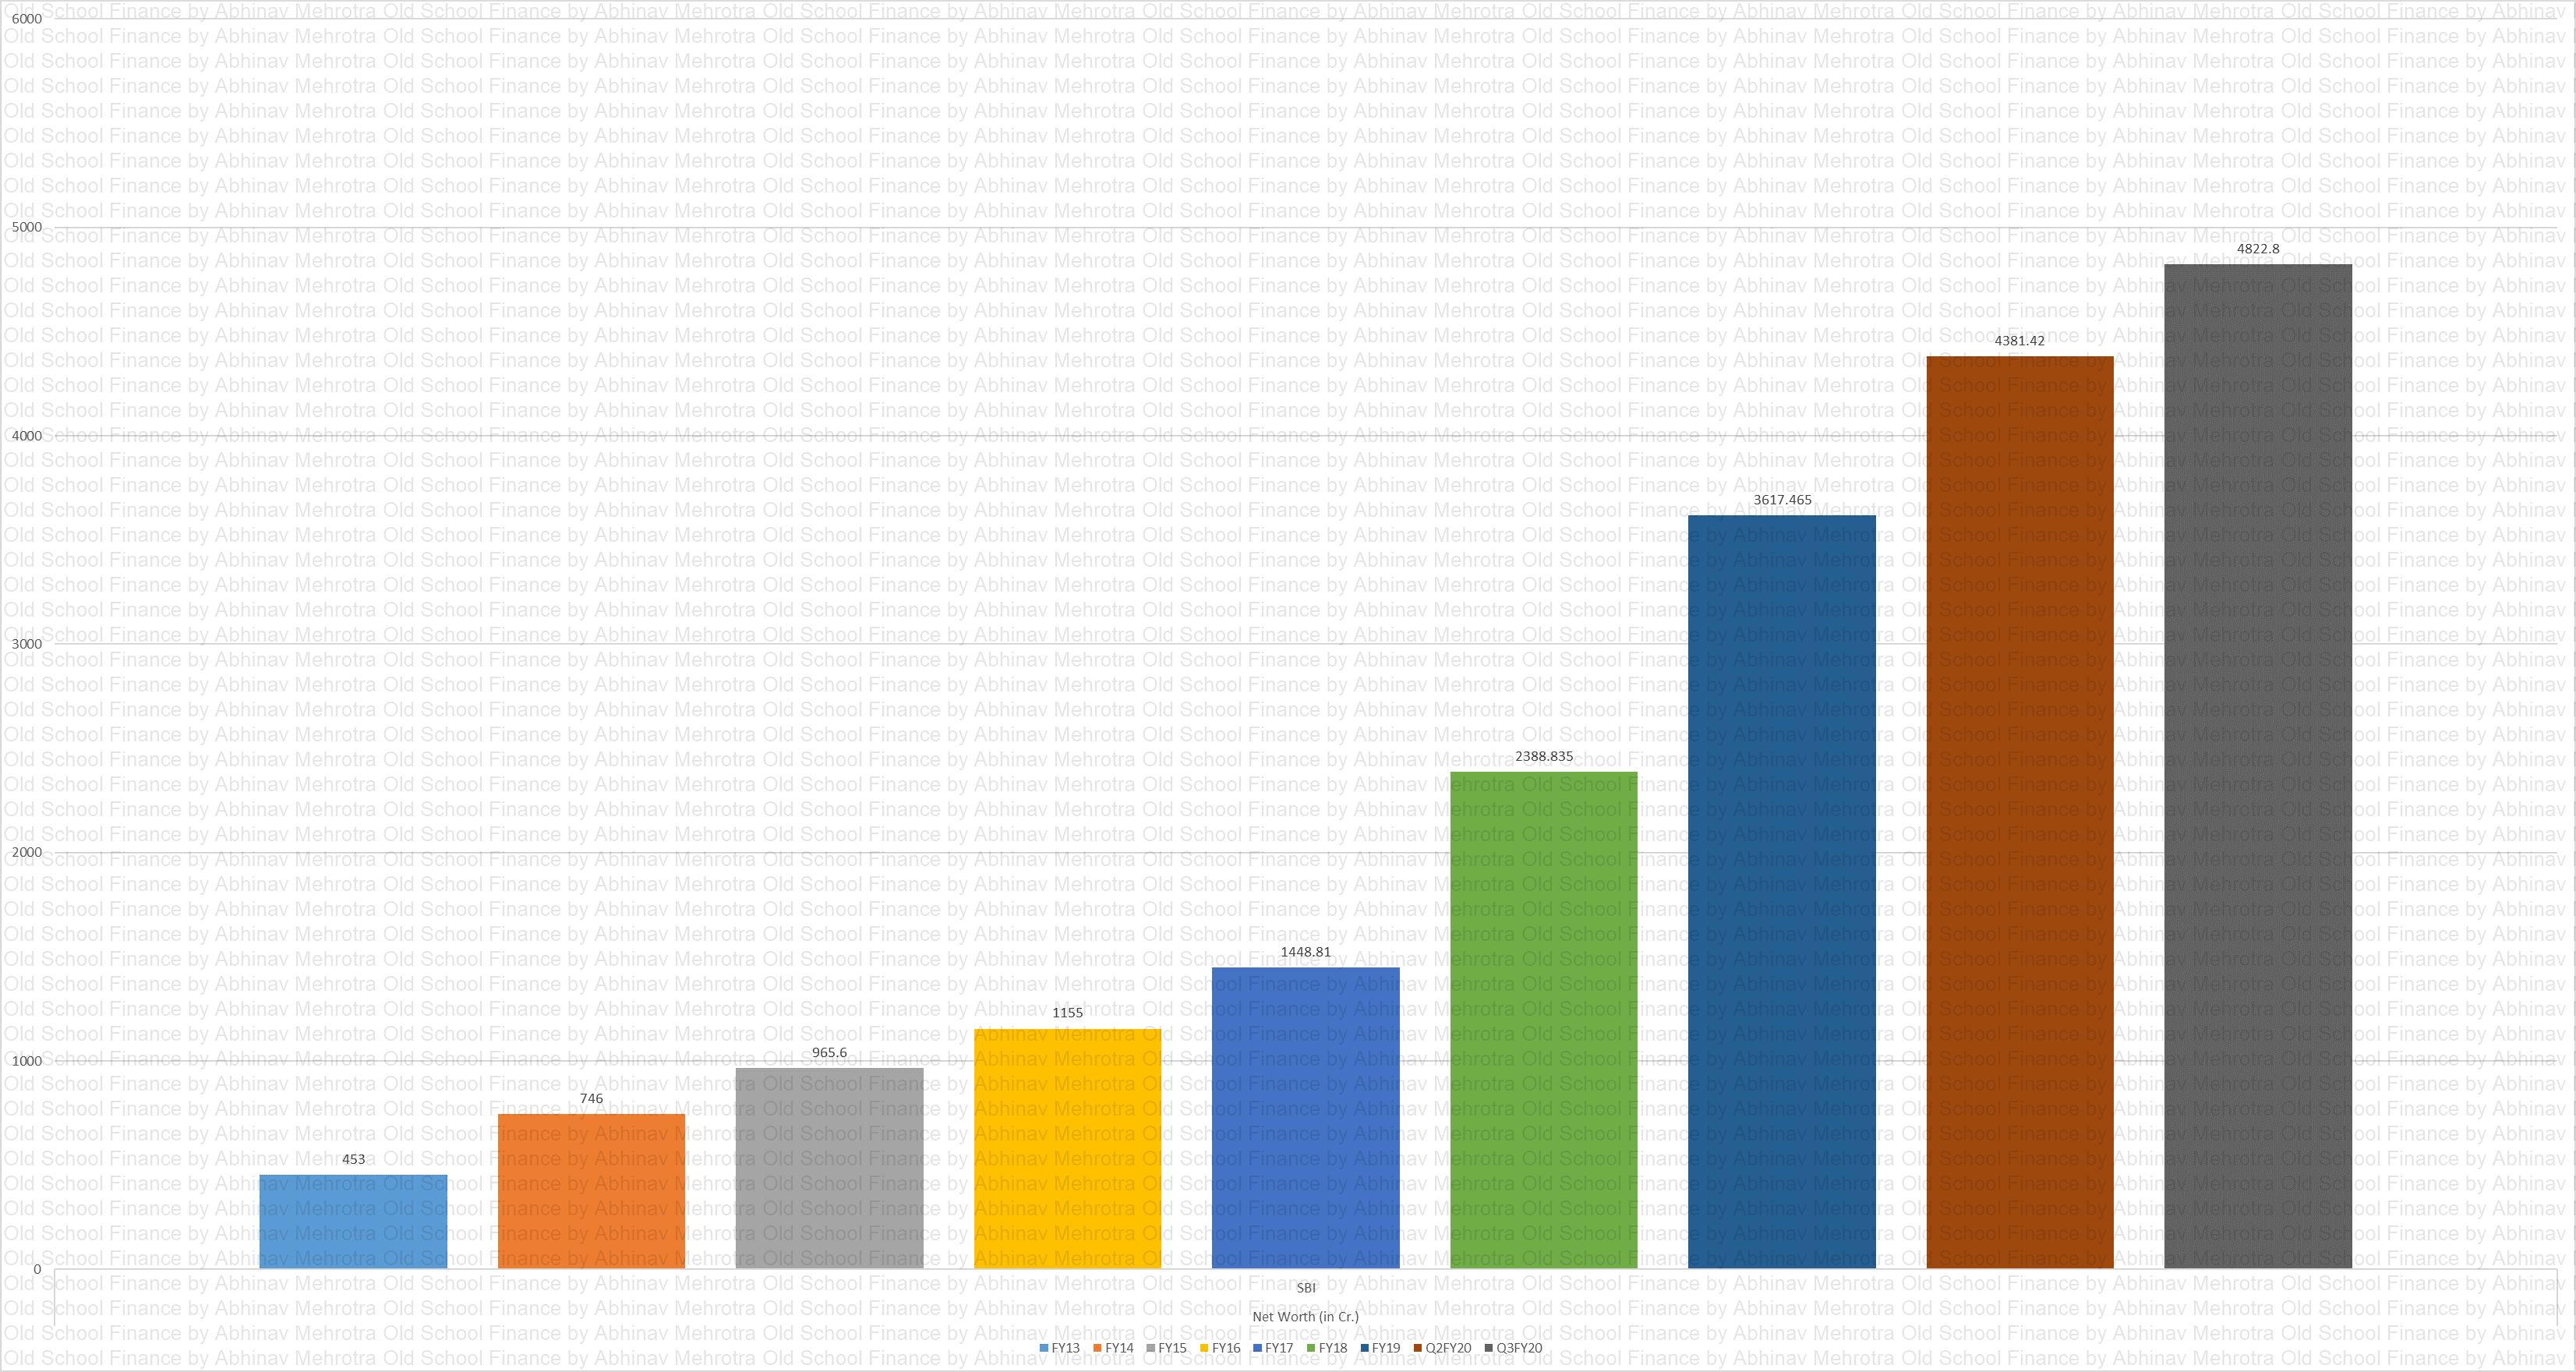
Chart 32 – Net worth over the years. Impressive growth, but I must also point out that in FY13 & 14 the retained earnings of the company were negative probably due to the losses in the loan book from the previous business cycle. Net worth was positive in those years due to equity capital infusion.
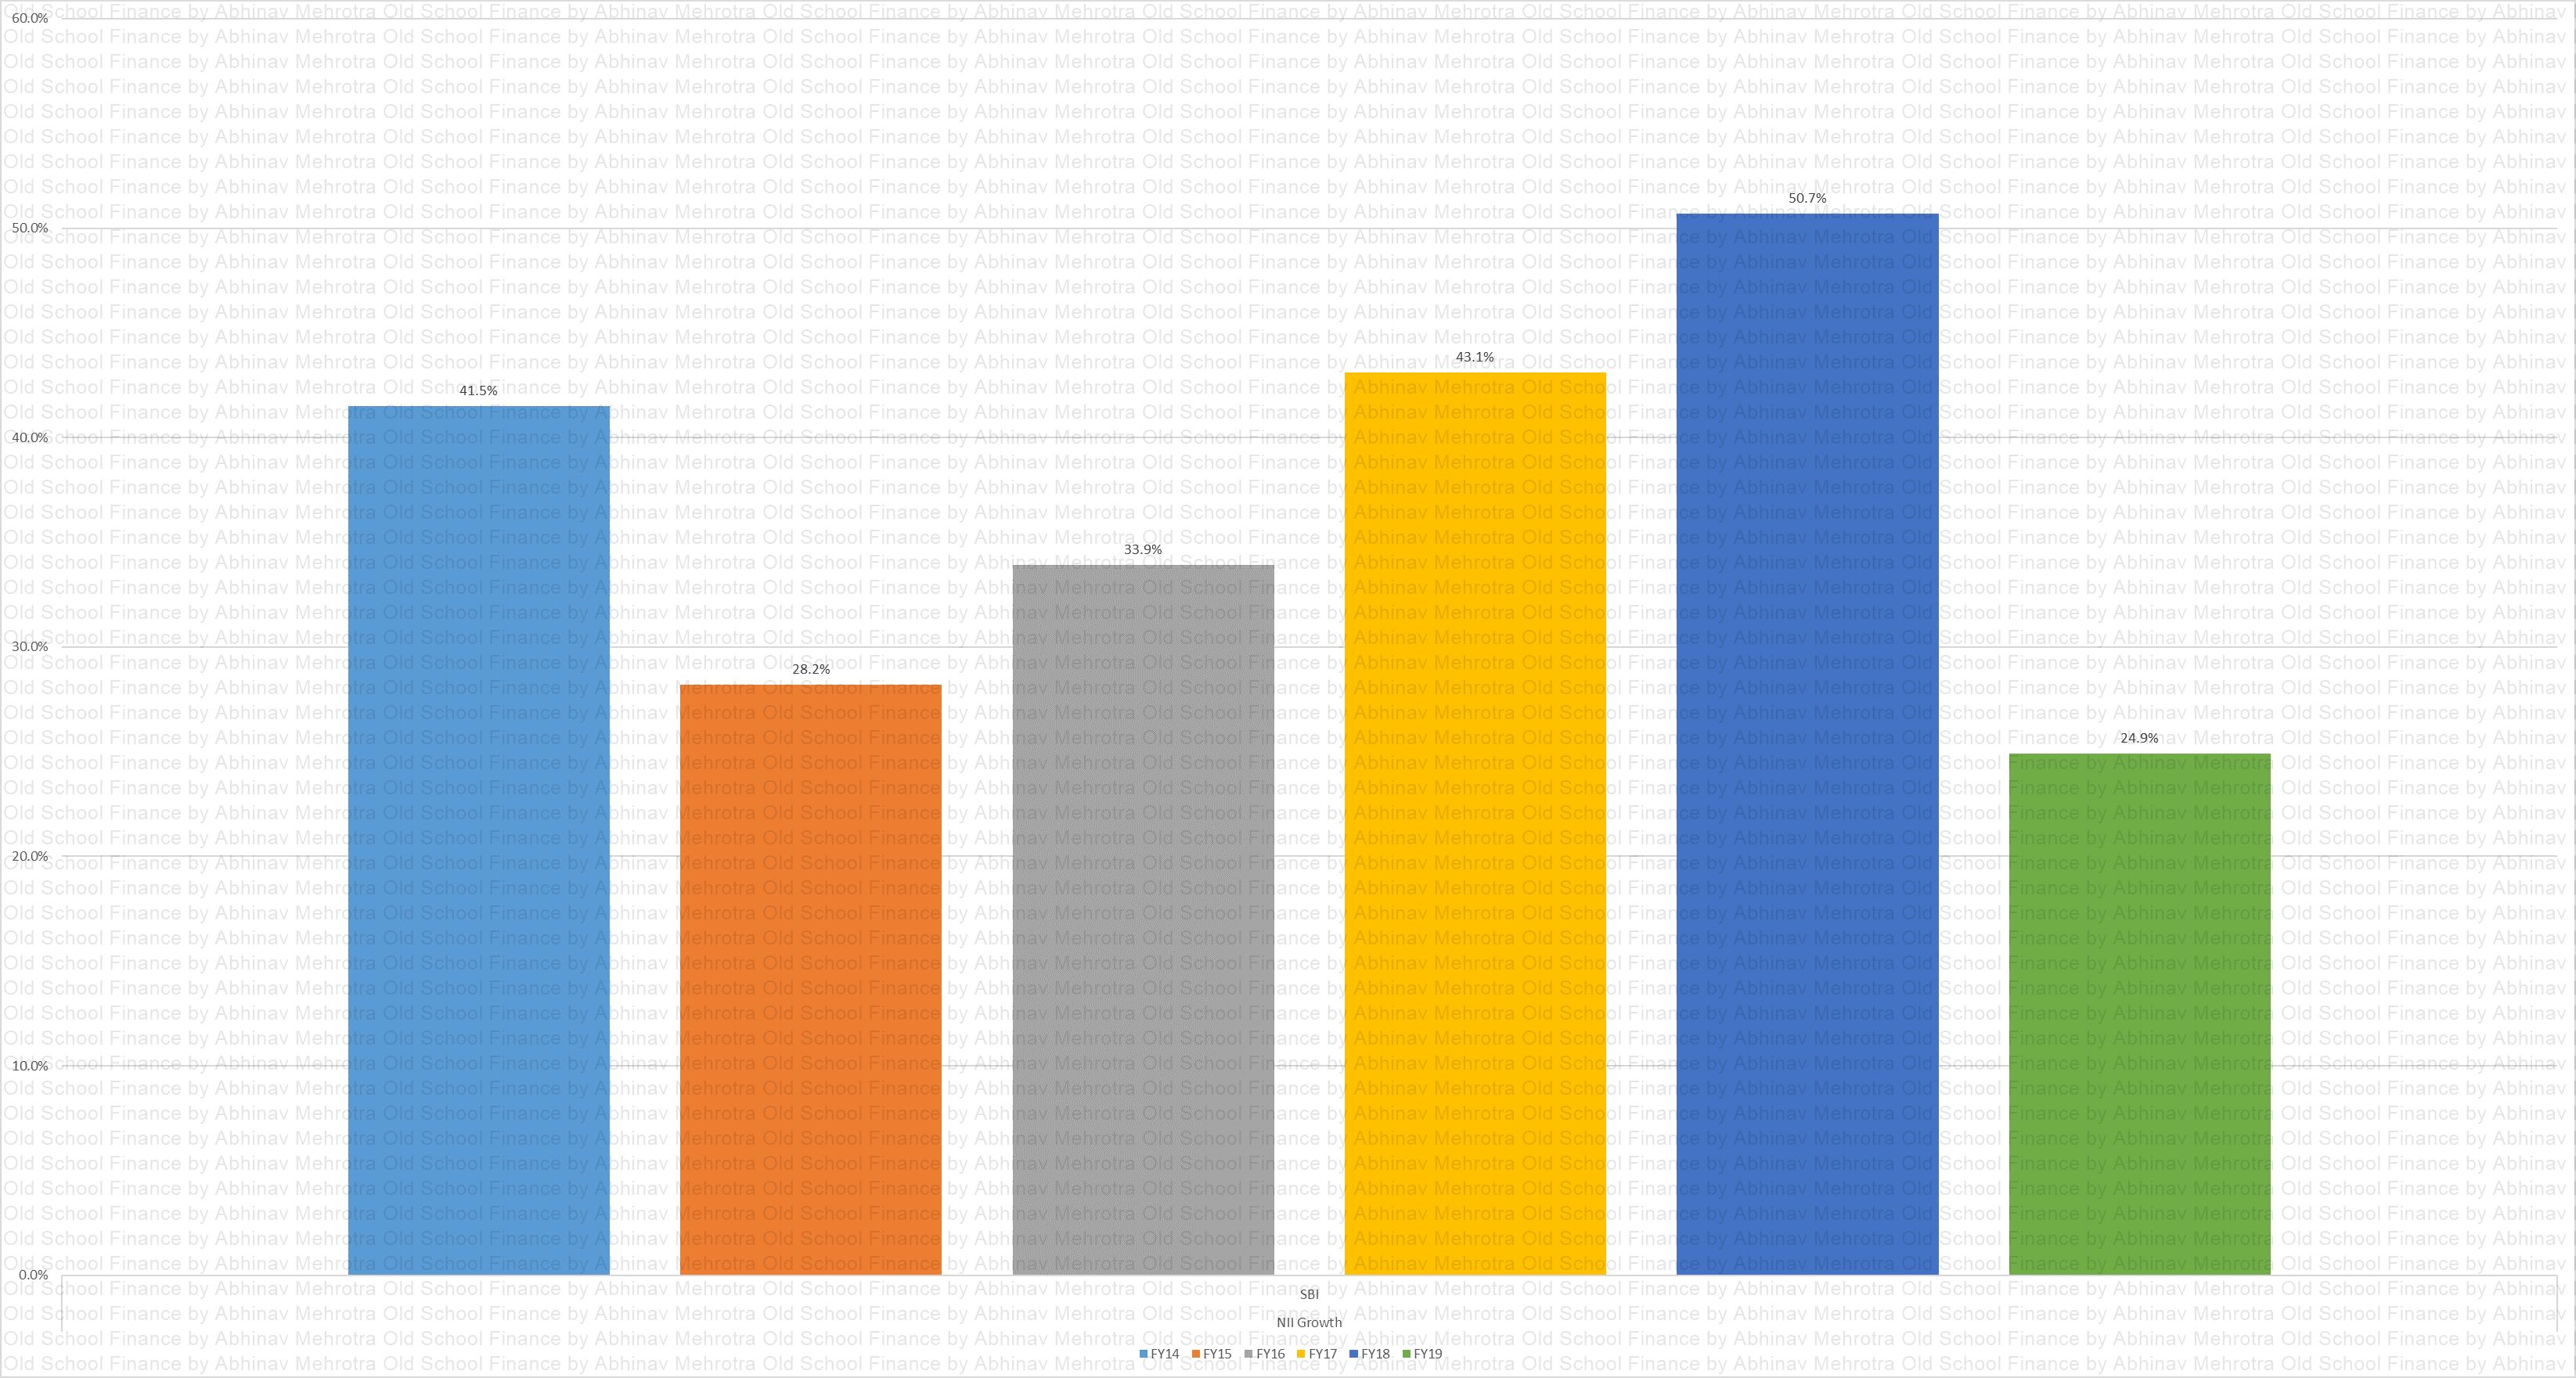
NII Growth
Chart 33 – Net Interest Income growth.
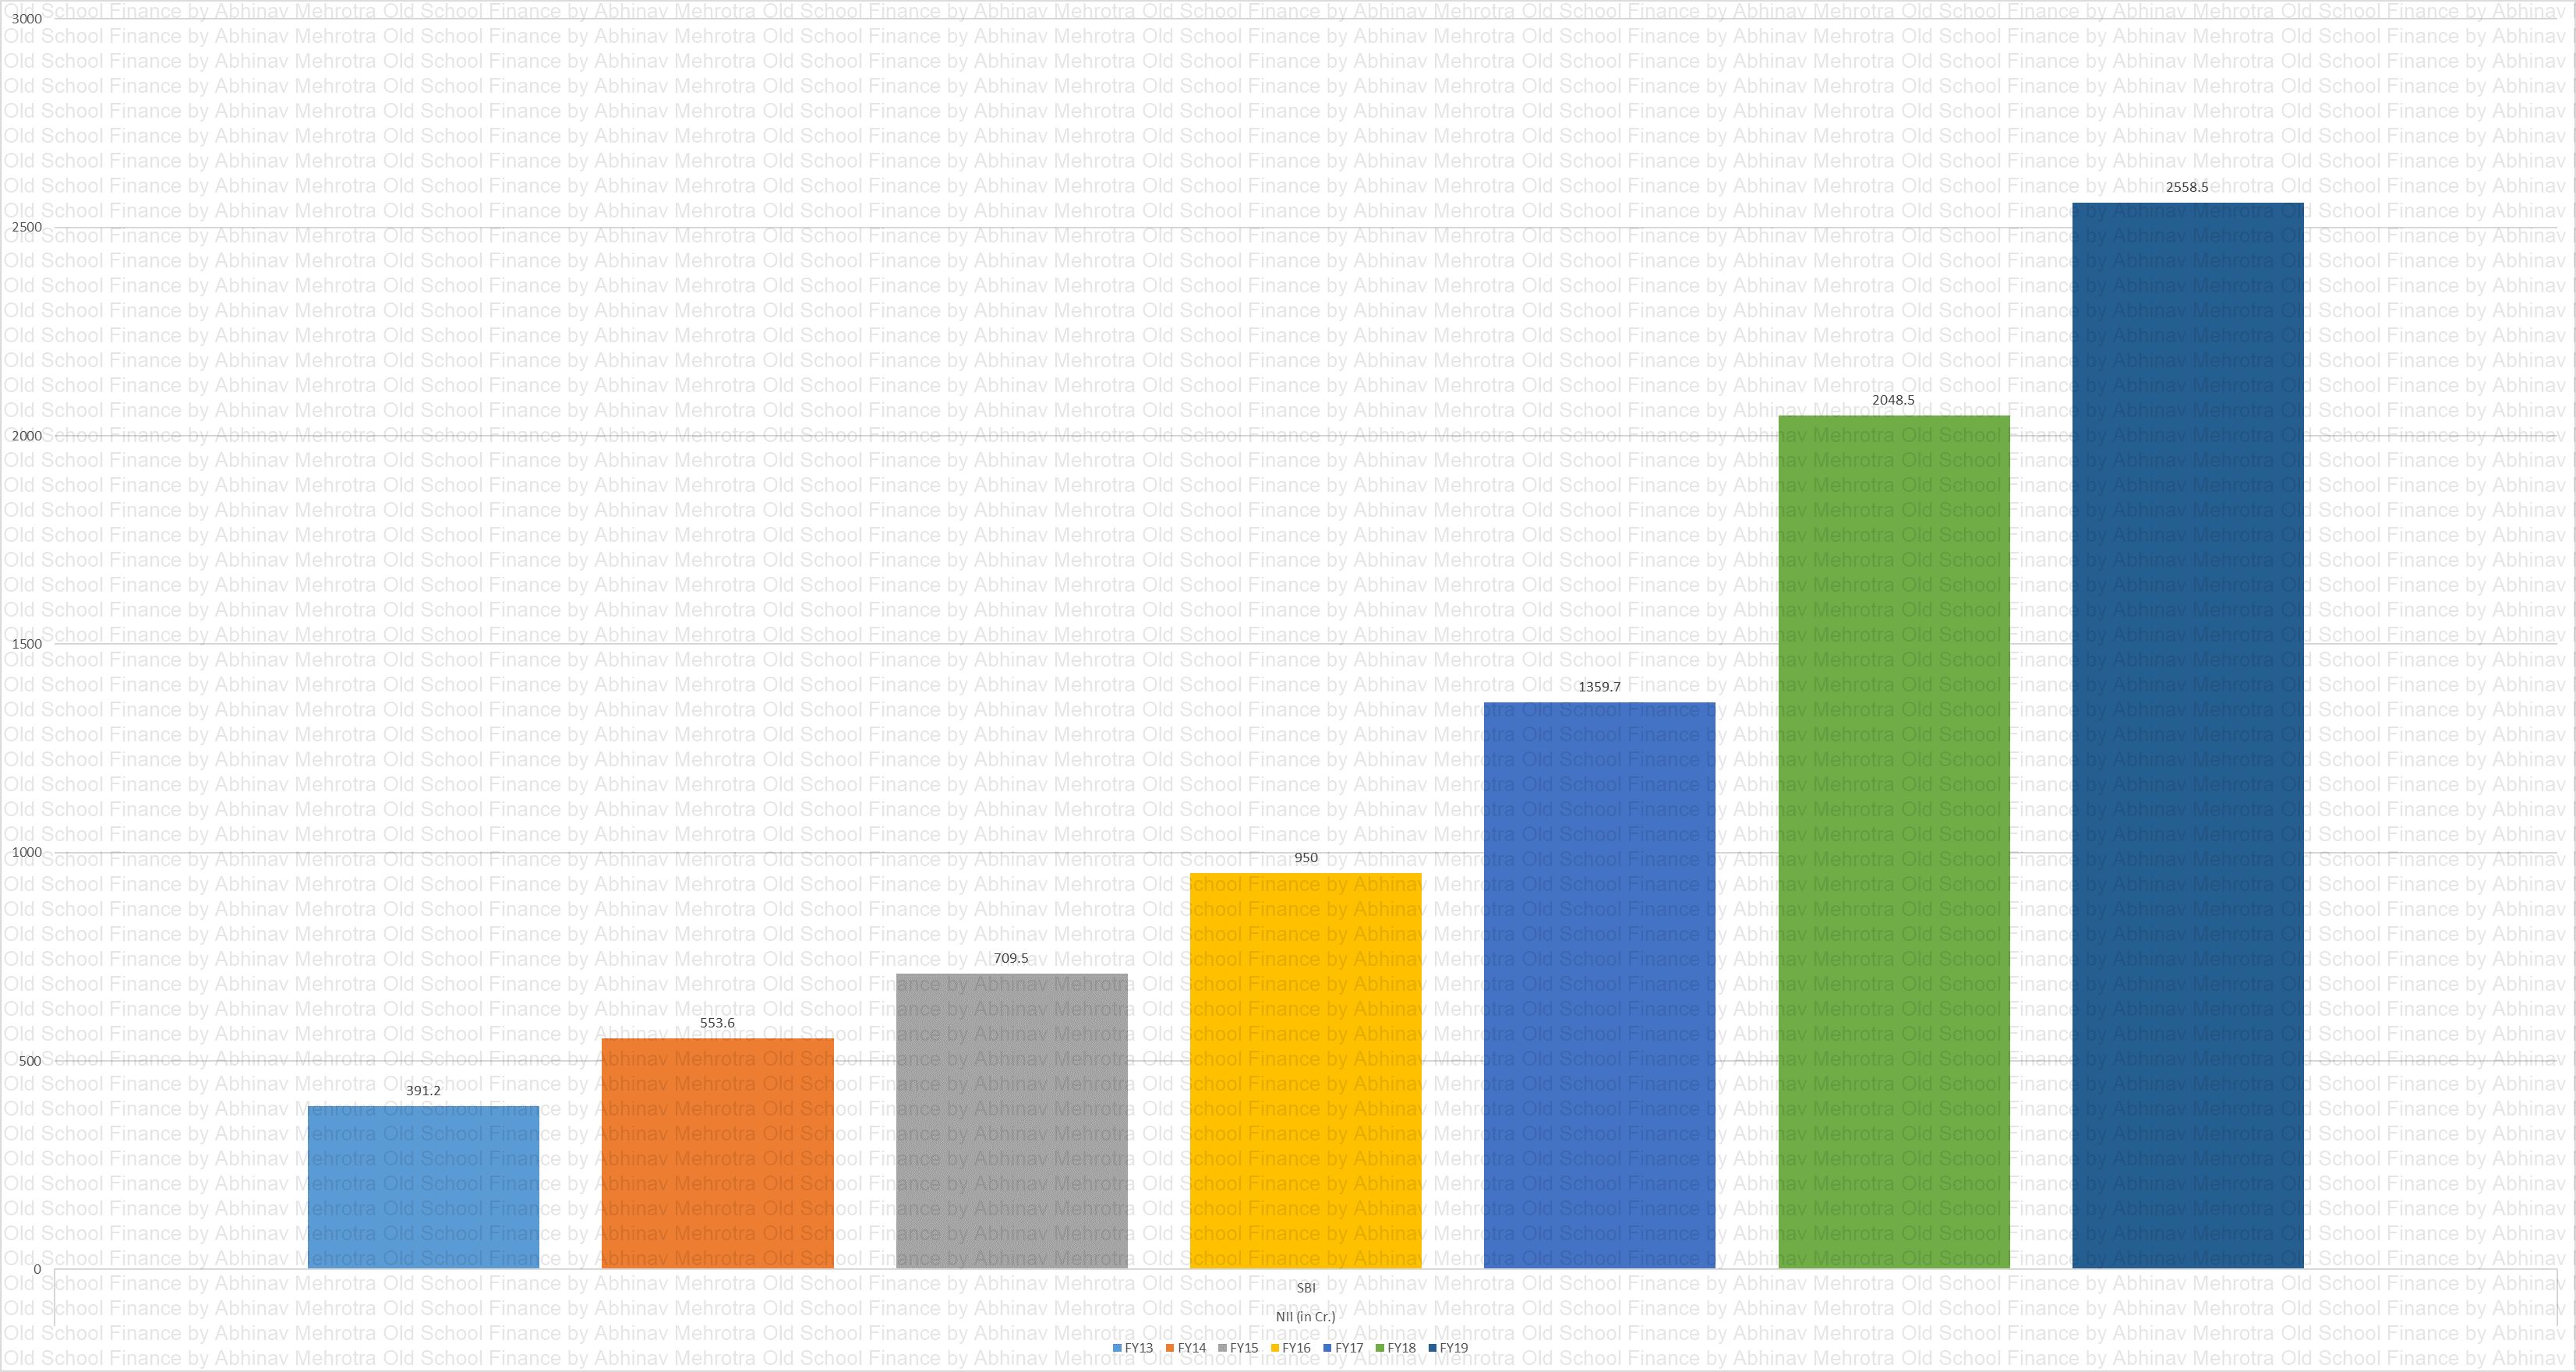
NII
Chart 34 – Net Interest Income in absolute terms.
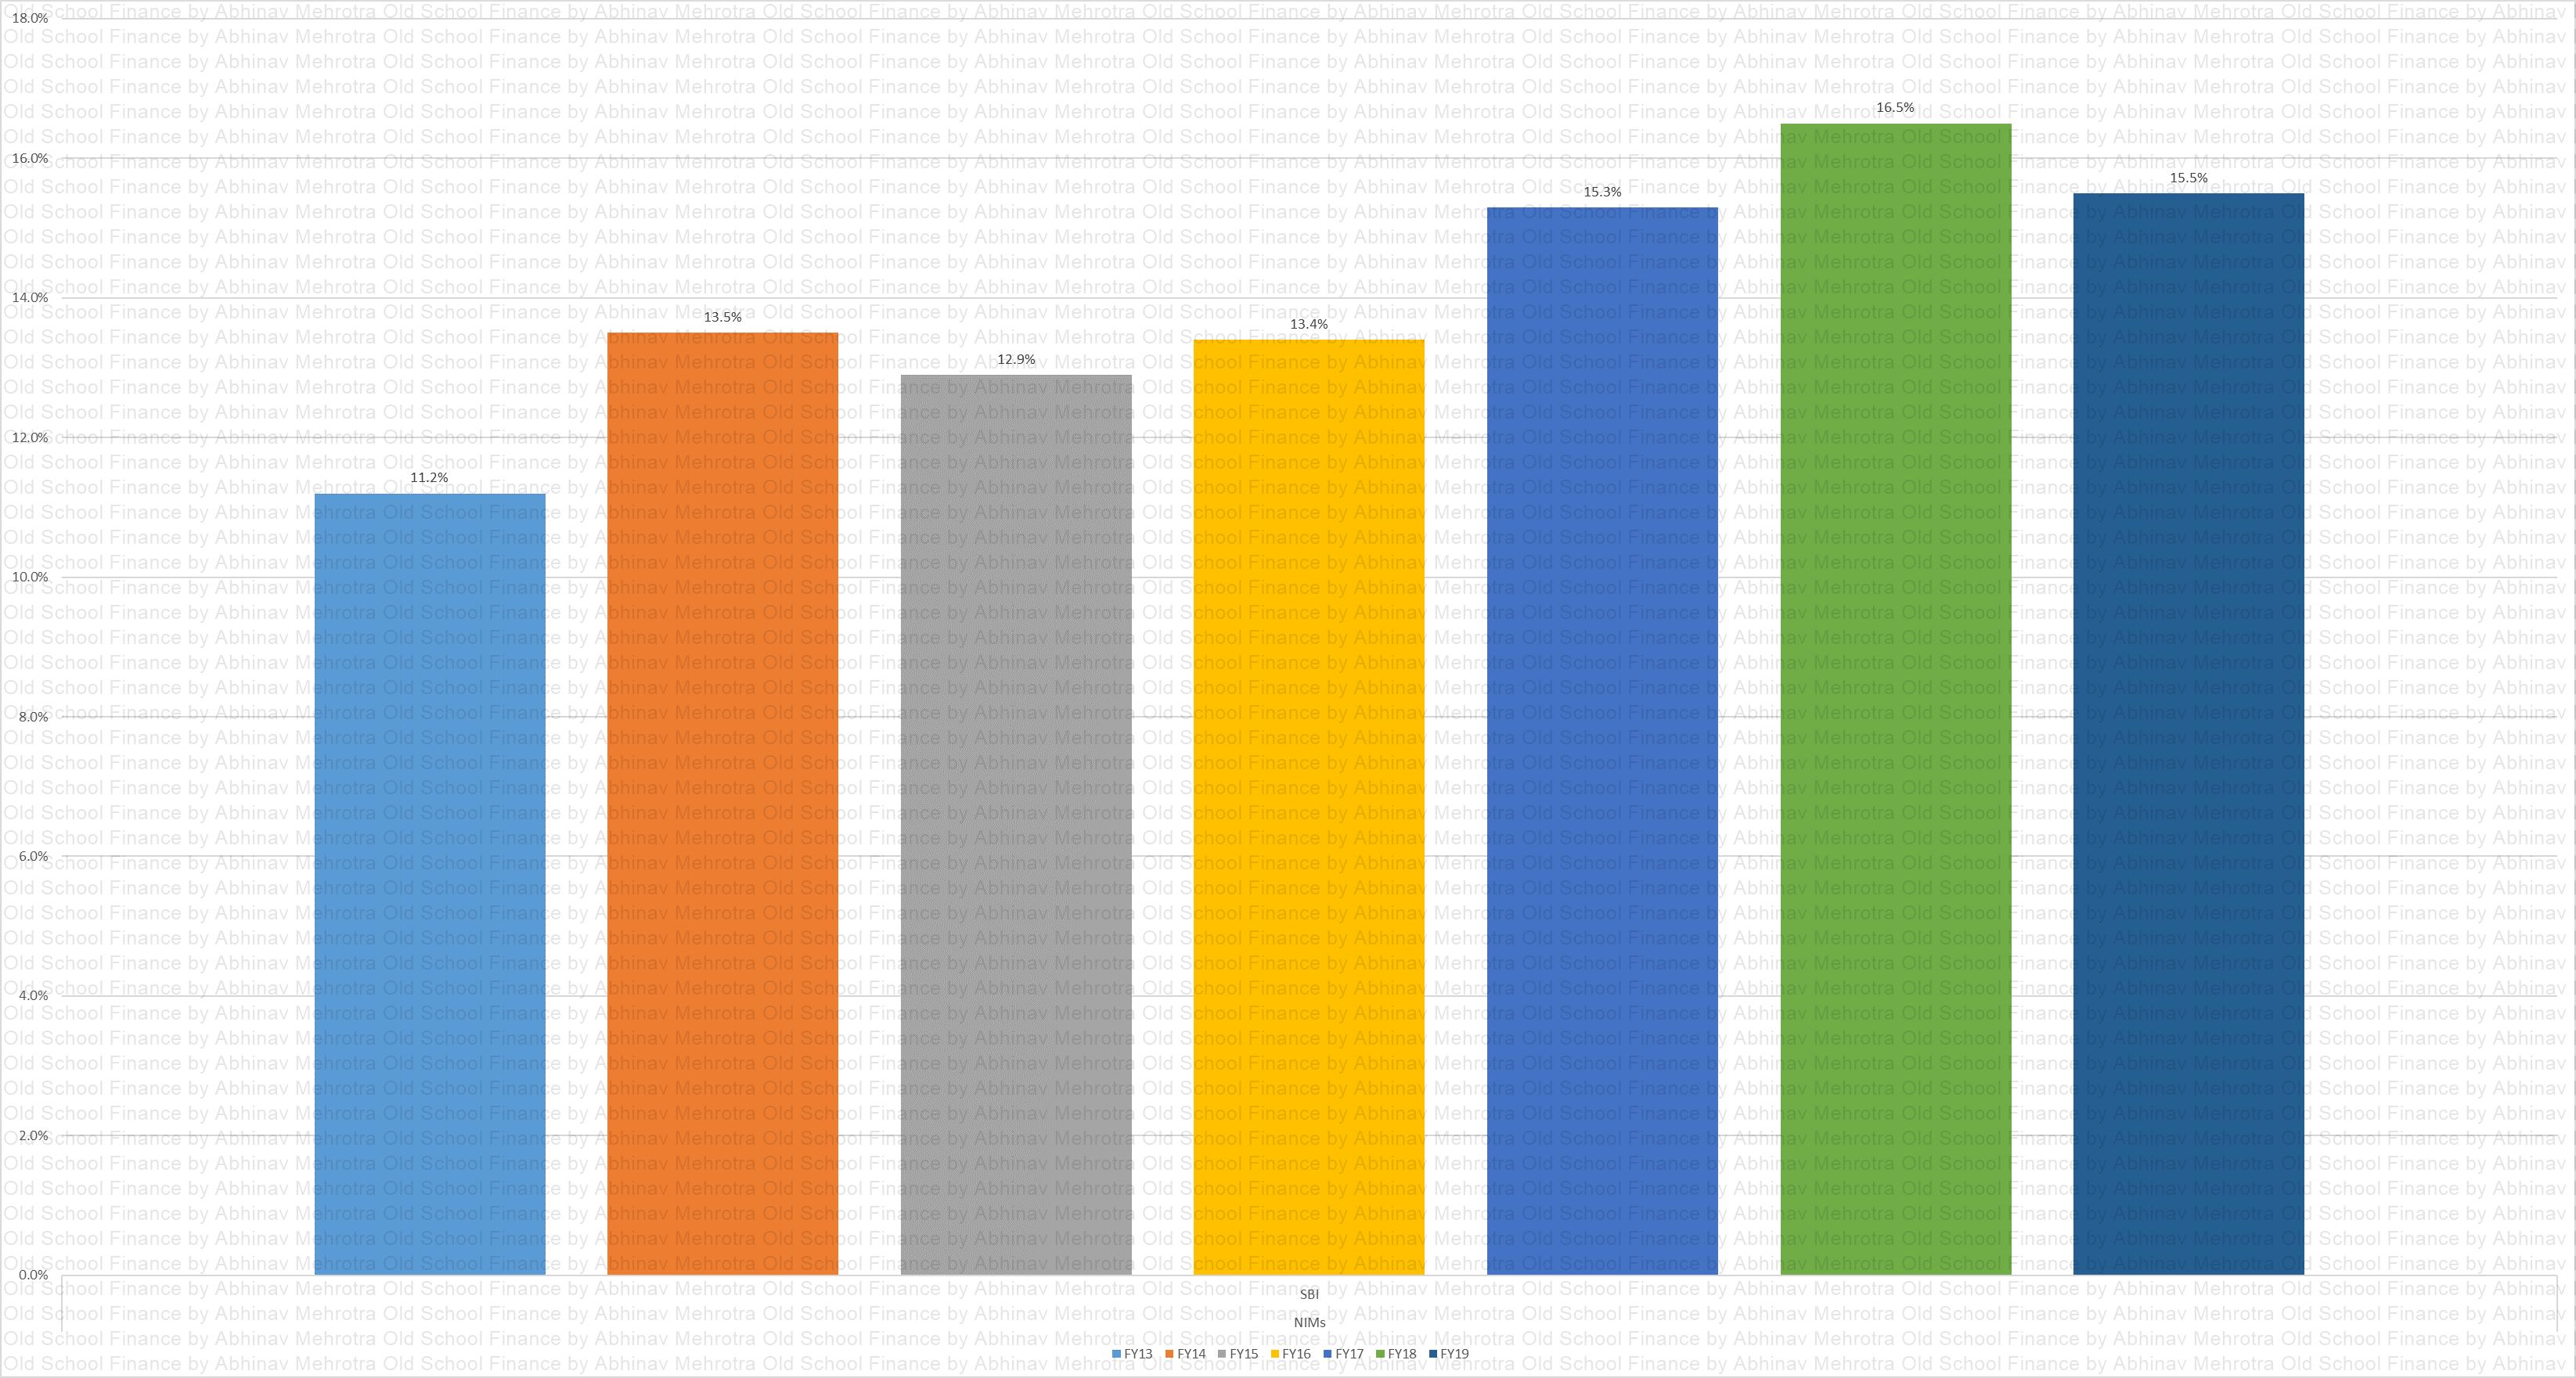
NIMs
Chart 35 – Net Interest Margins have improved with improving loan book yield.
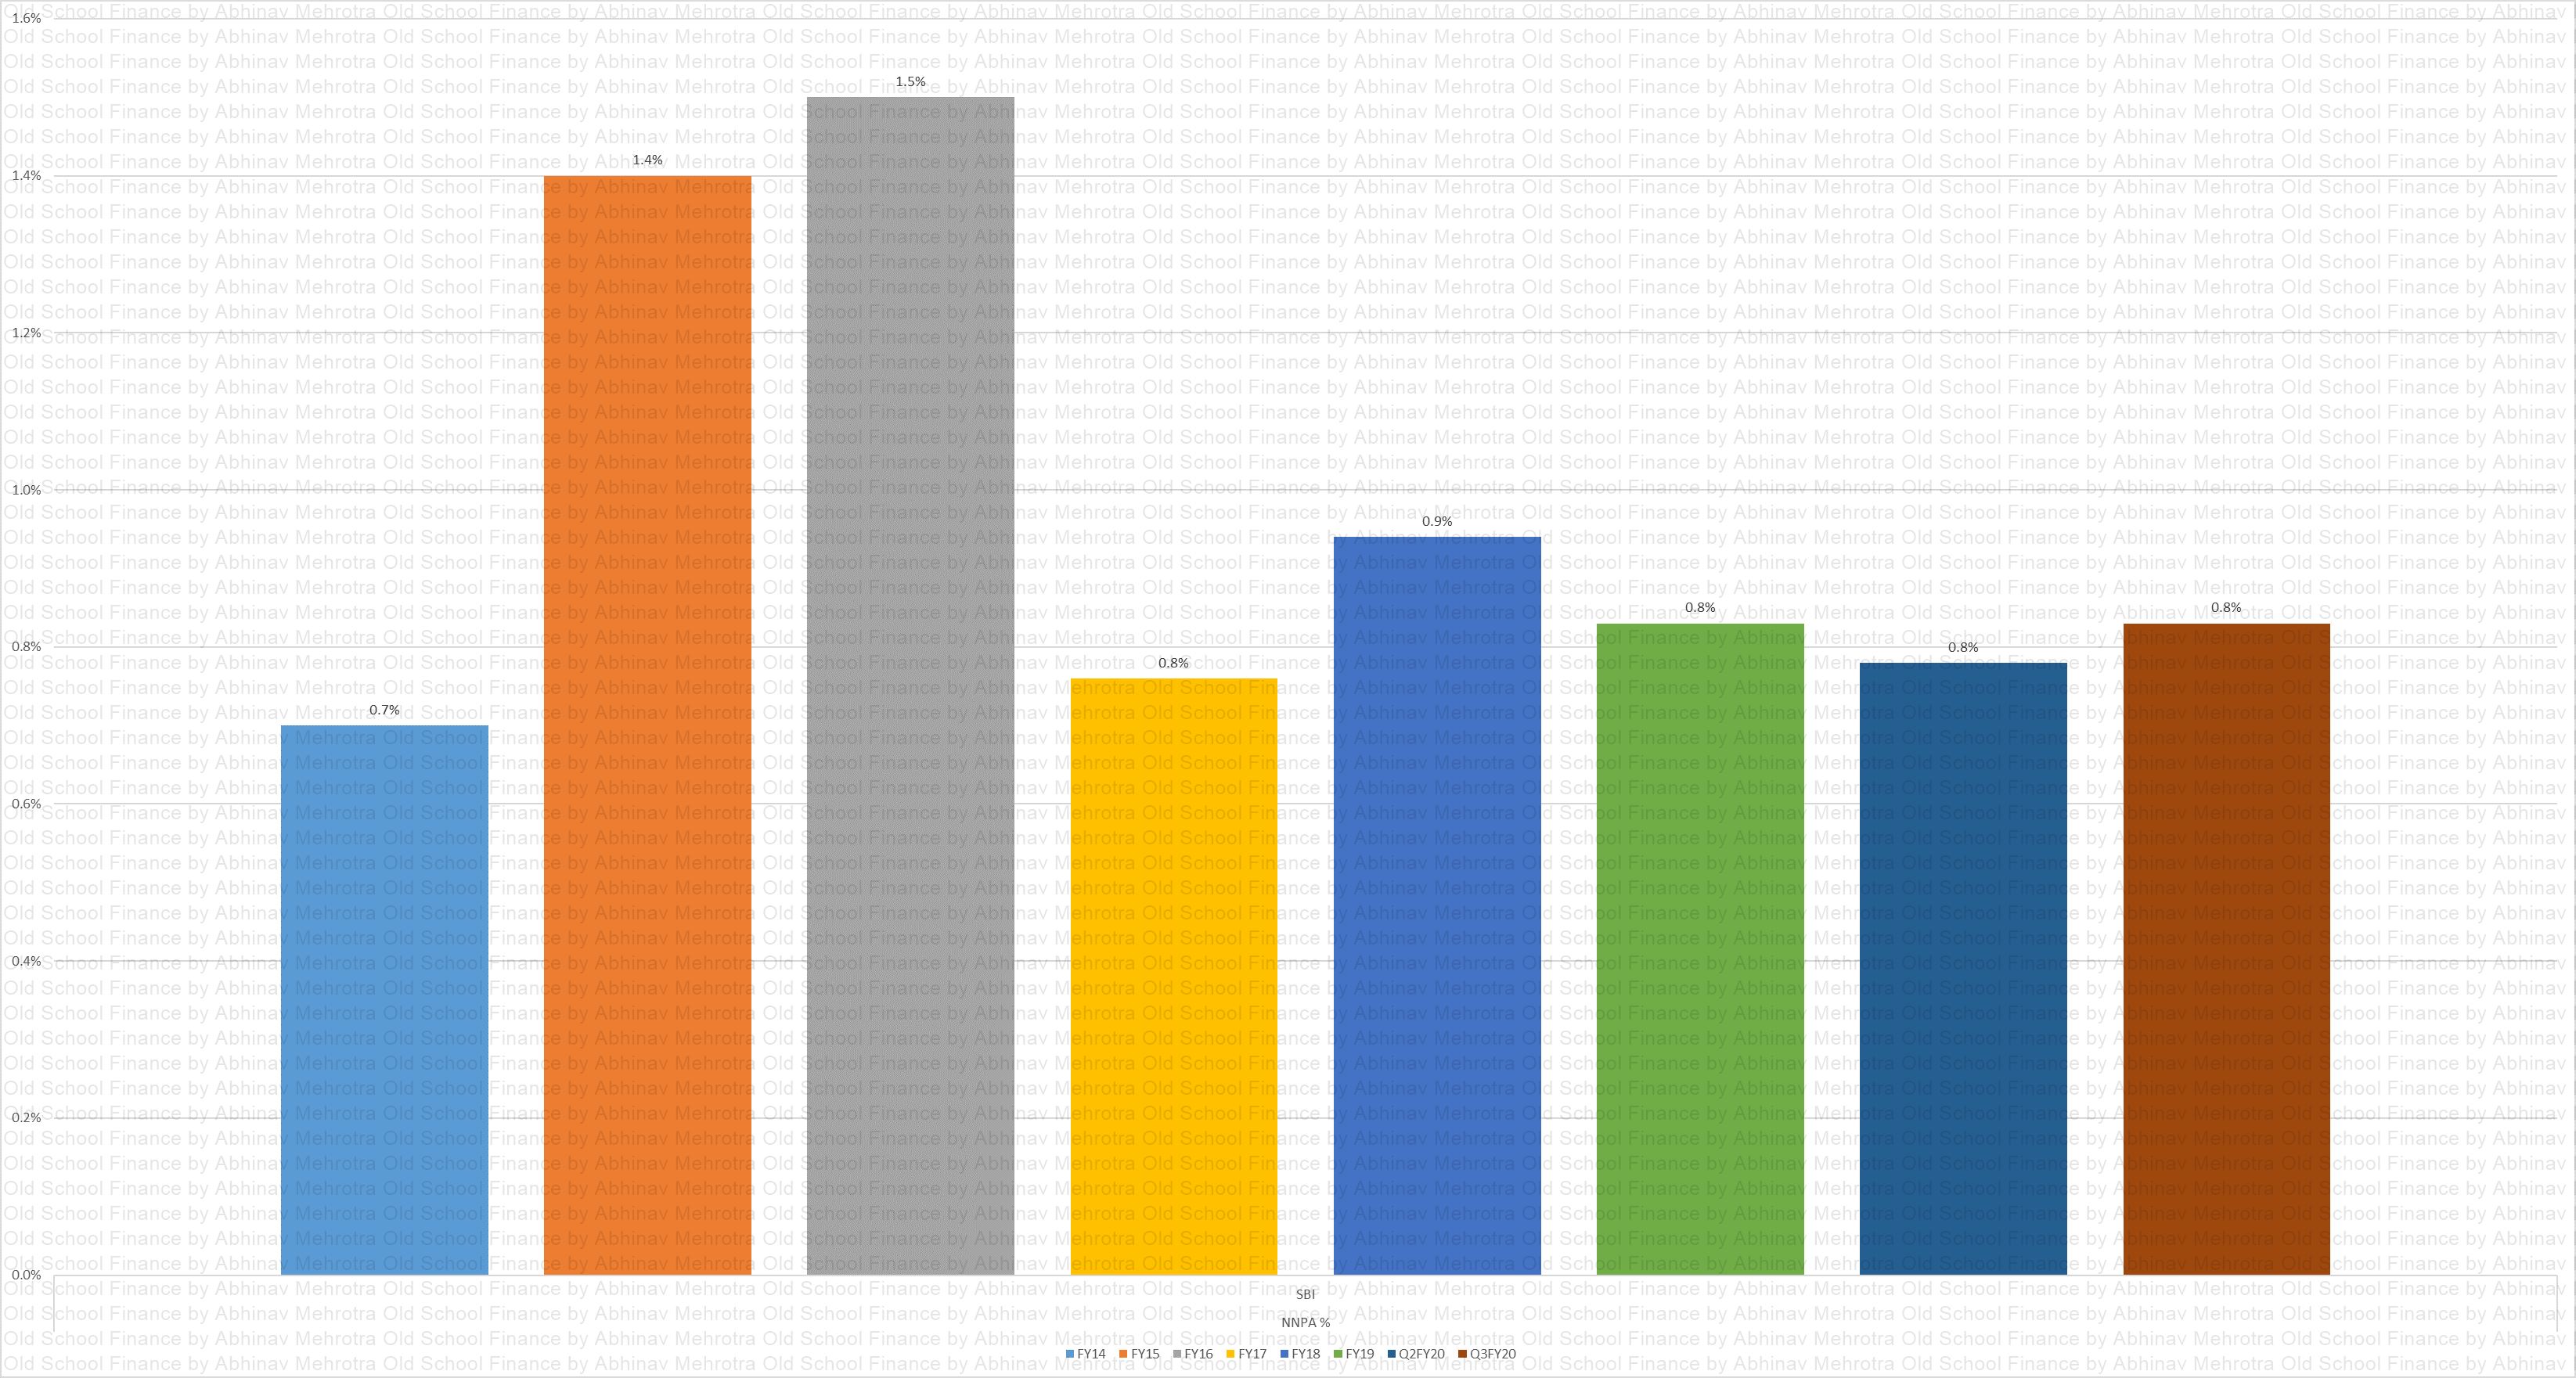
NNPA %
Chart 36 – NNPA % has been contained at sub 1% since the entry of Carlyle.
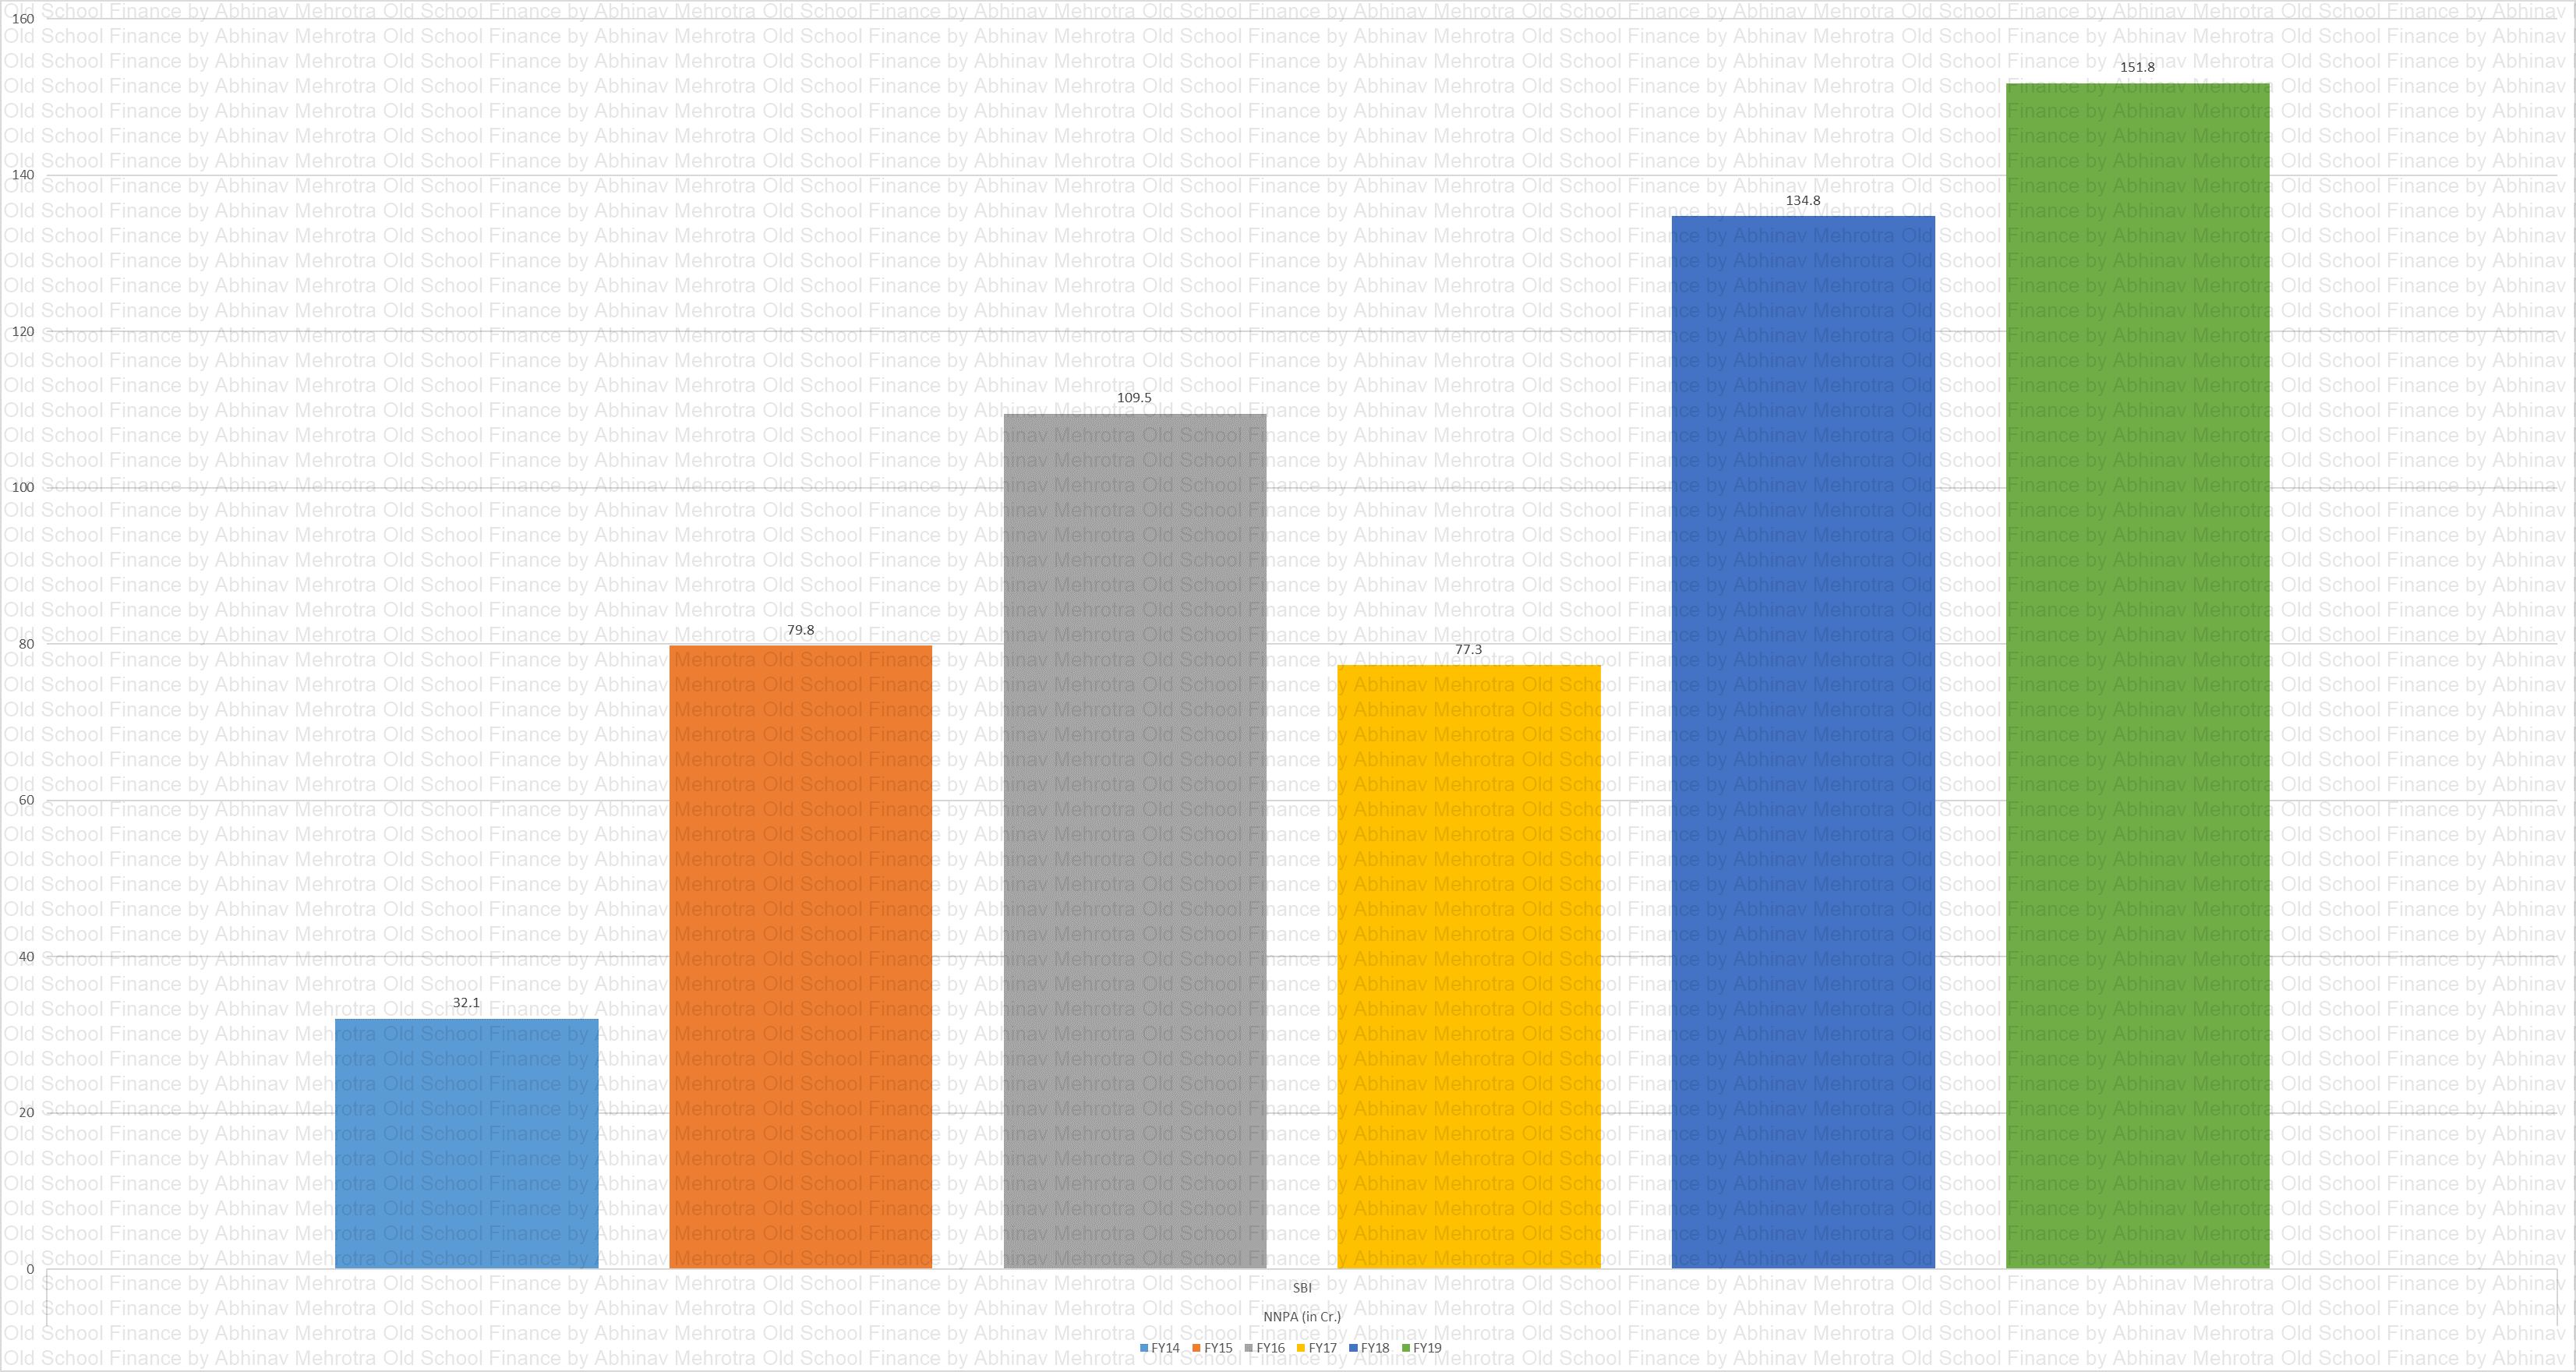
NNPA
Chart 37 – NNPA in absolute terms.
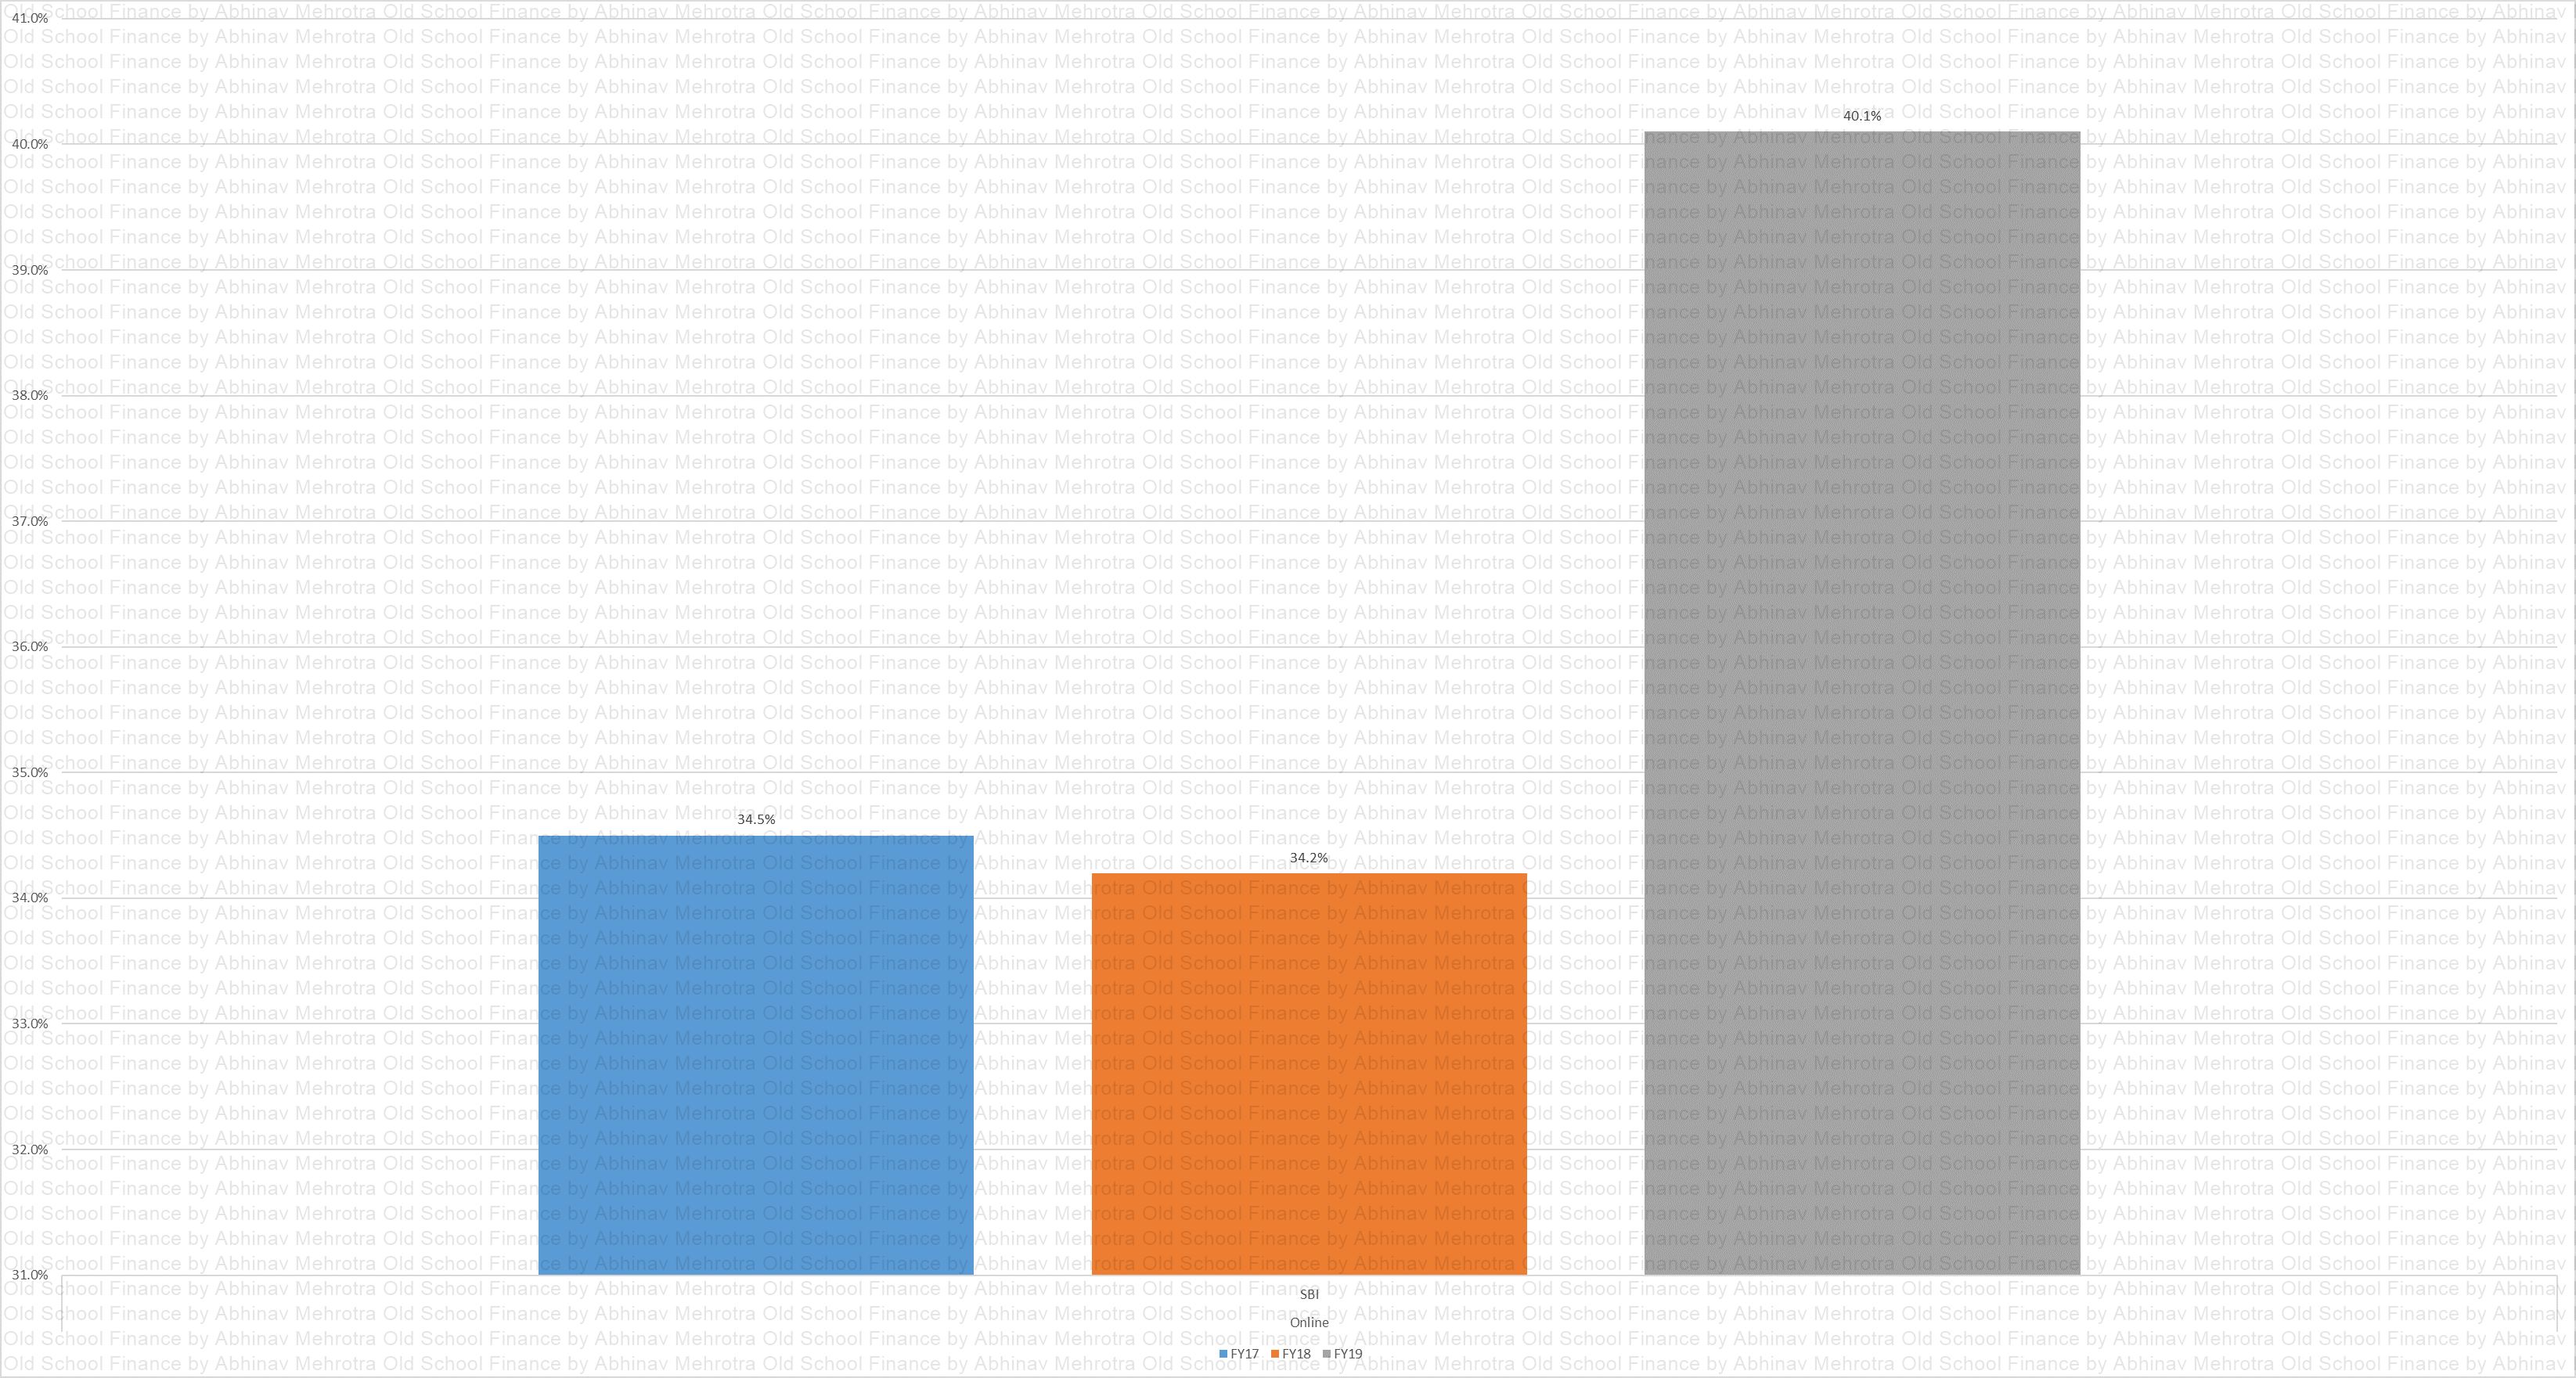
Online
Chart 38 – Depicts the percentage of transactions for online purchase. Seems like their sales, offers and promotions for online purchases could be a good reason that could attract customers to SBI.
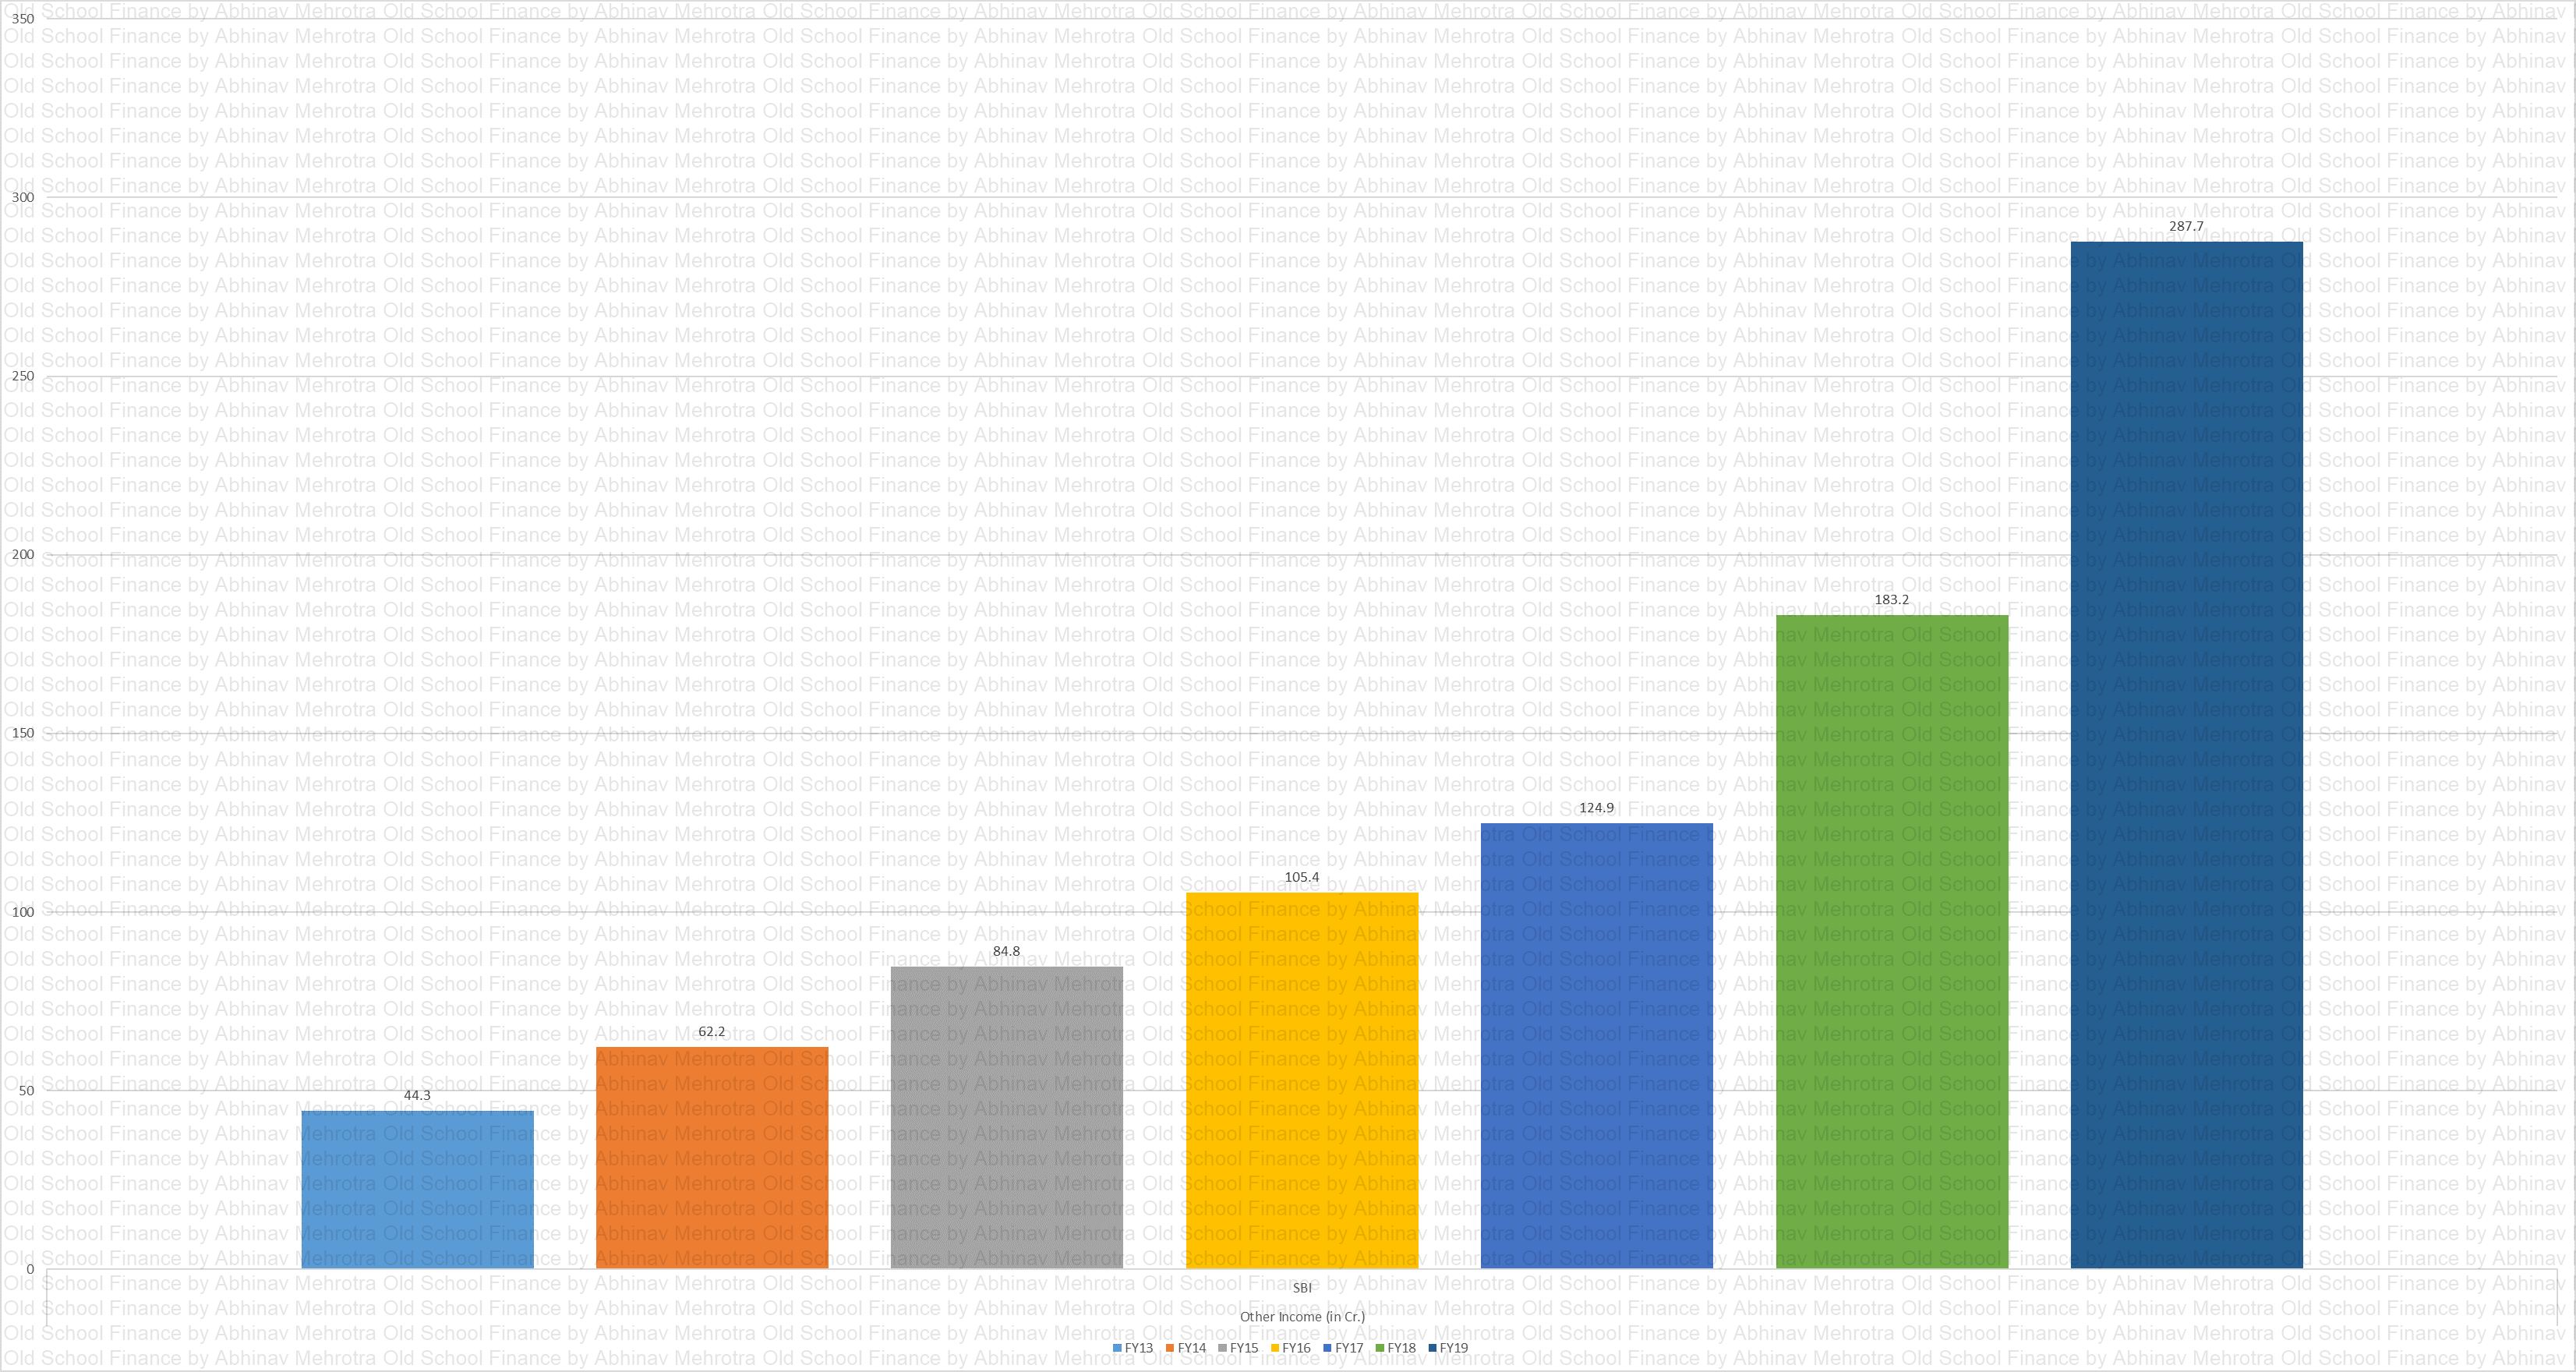
Other Income
Chart 39 – Other income in absolute terms.
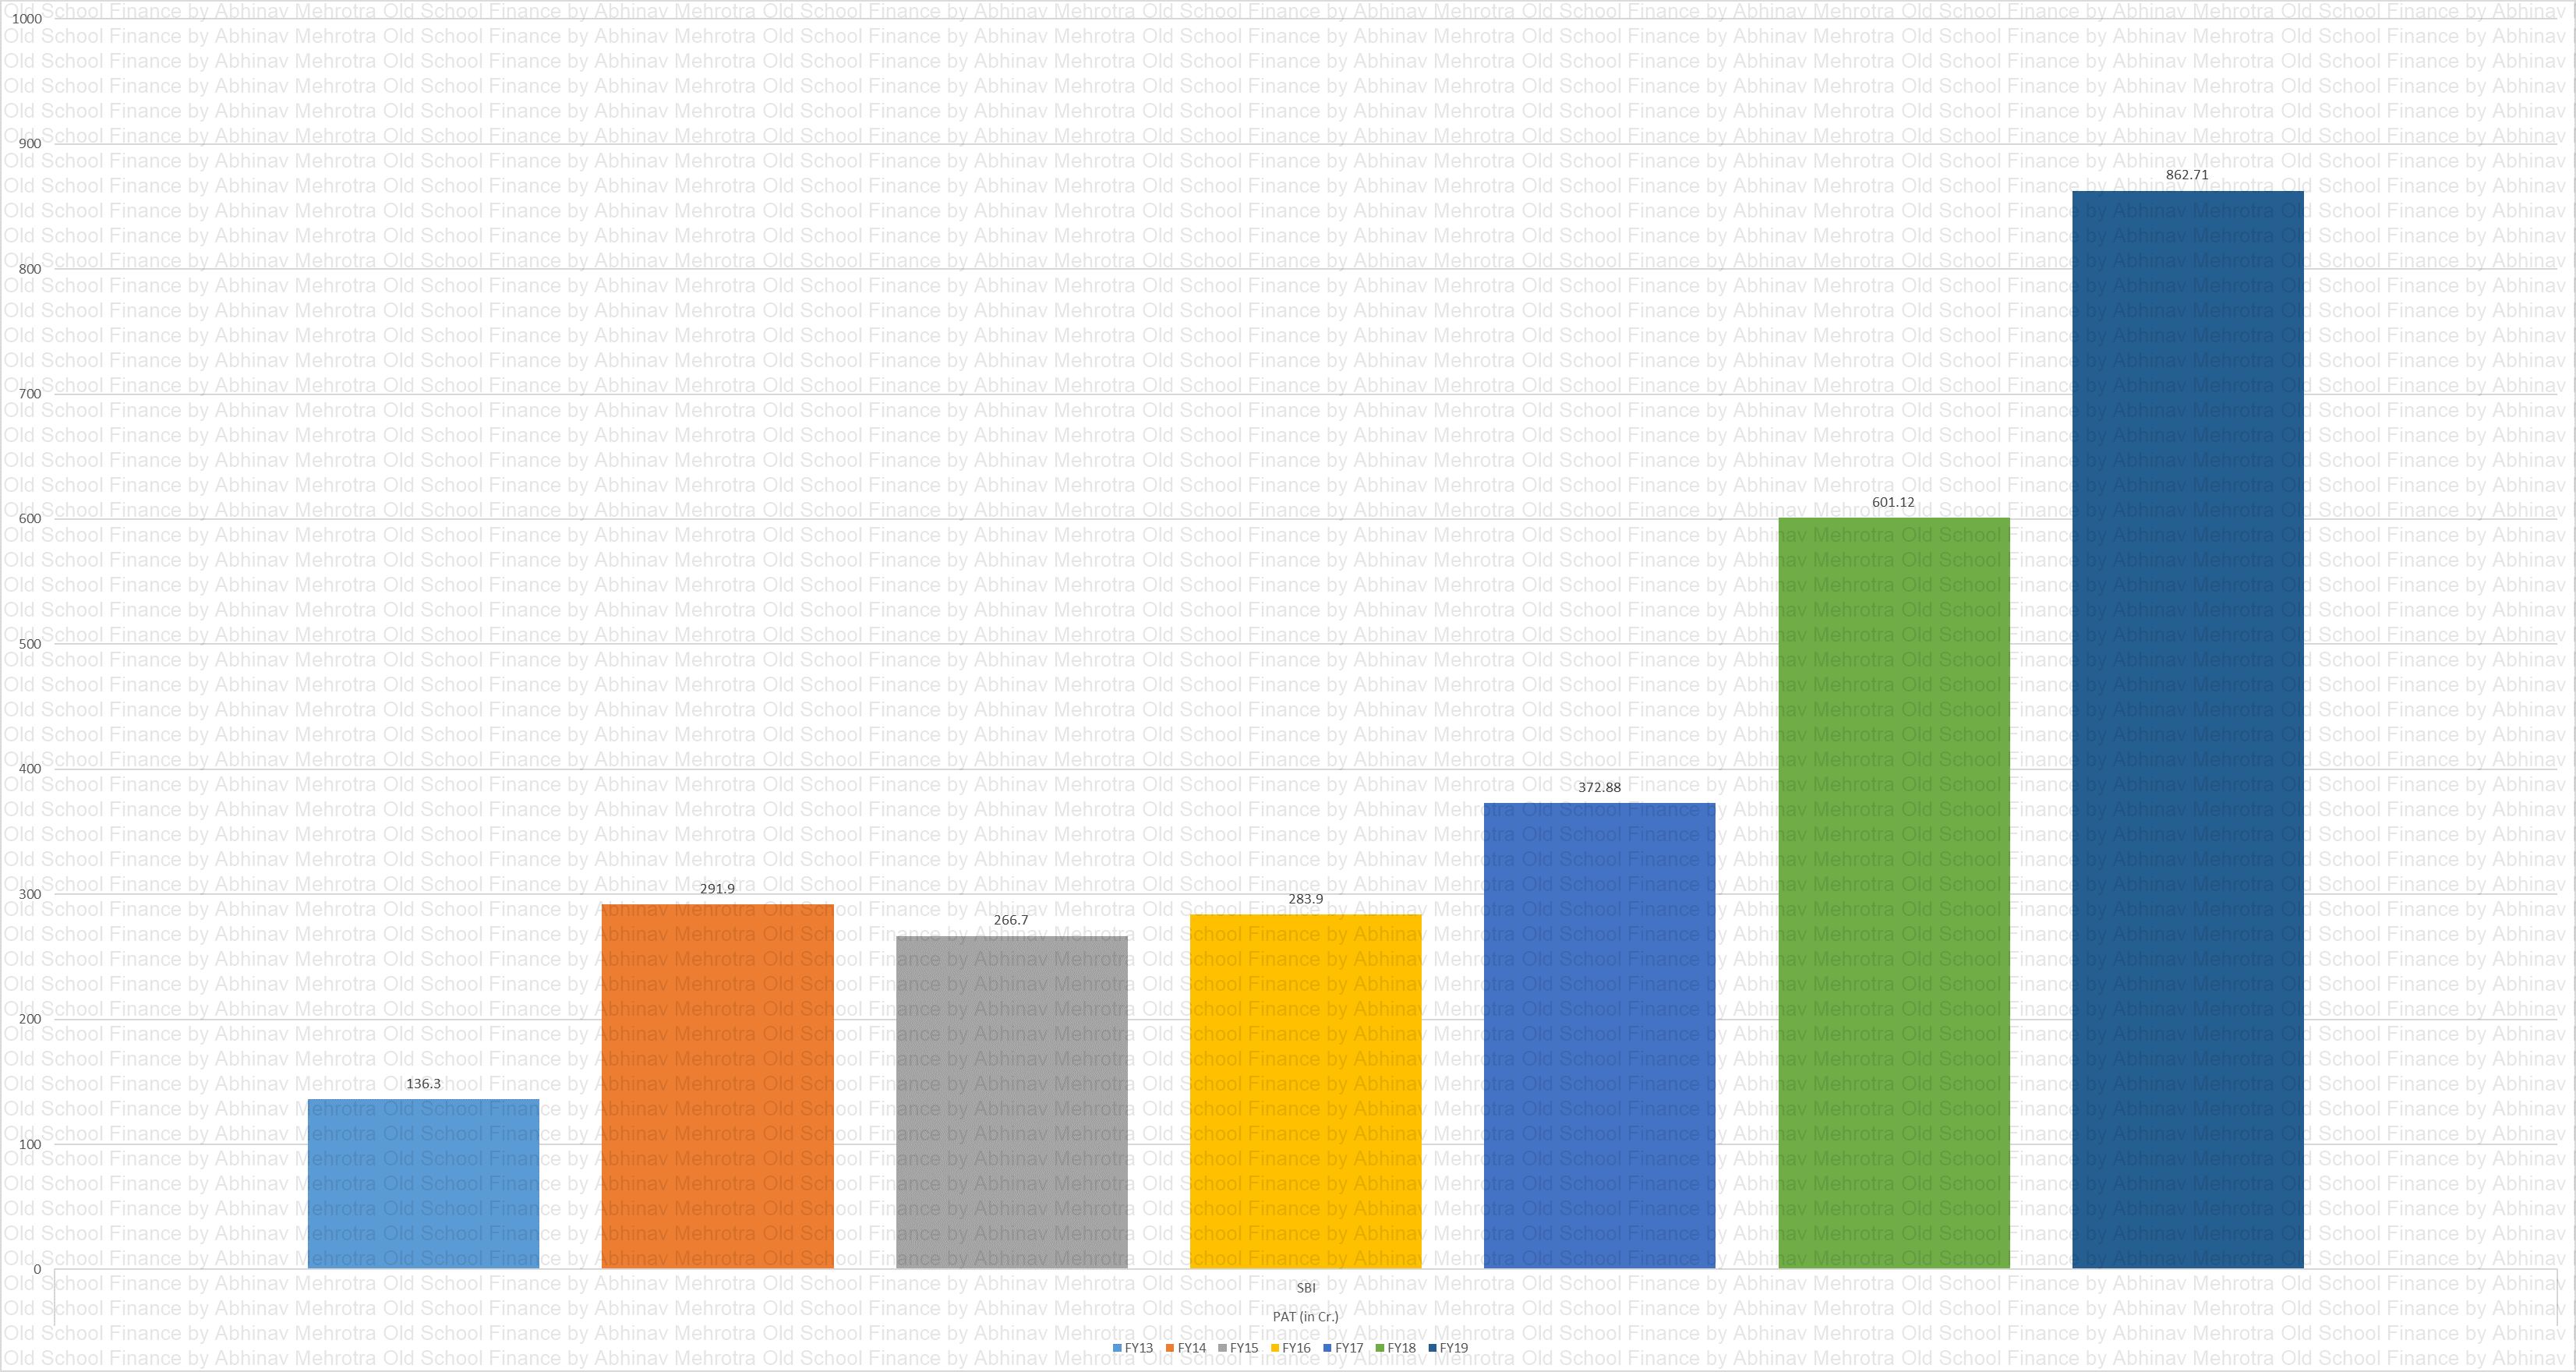
PAT
Chart 40 – PAT in absolute terms. The lending business is tail-ended which means the lender makes their actual profits when the last few instalments are paid. Half of the company’s revenue is from interest income and thus a portion of this PAT cannot be relied upon completely until we can ascertain the quality of underwriting of the management.
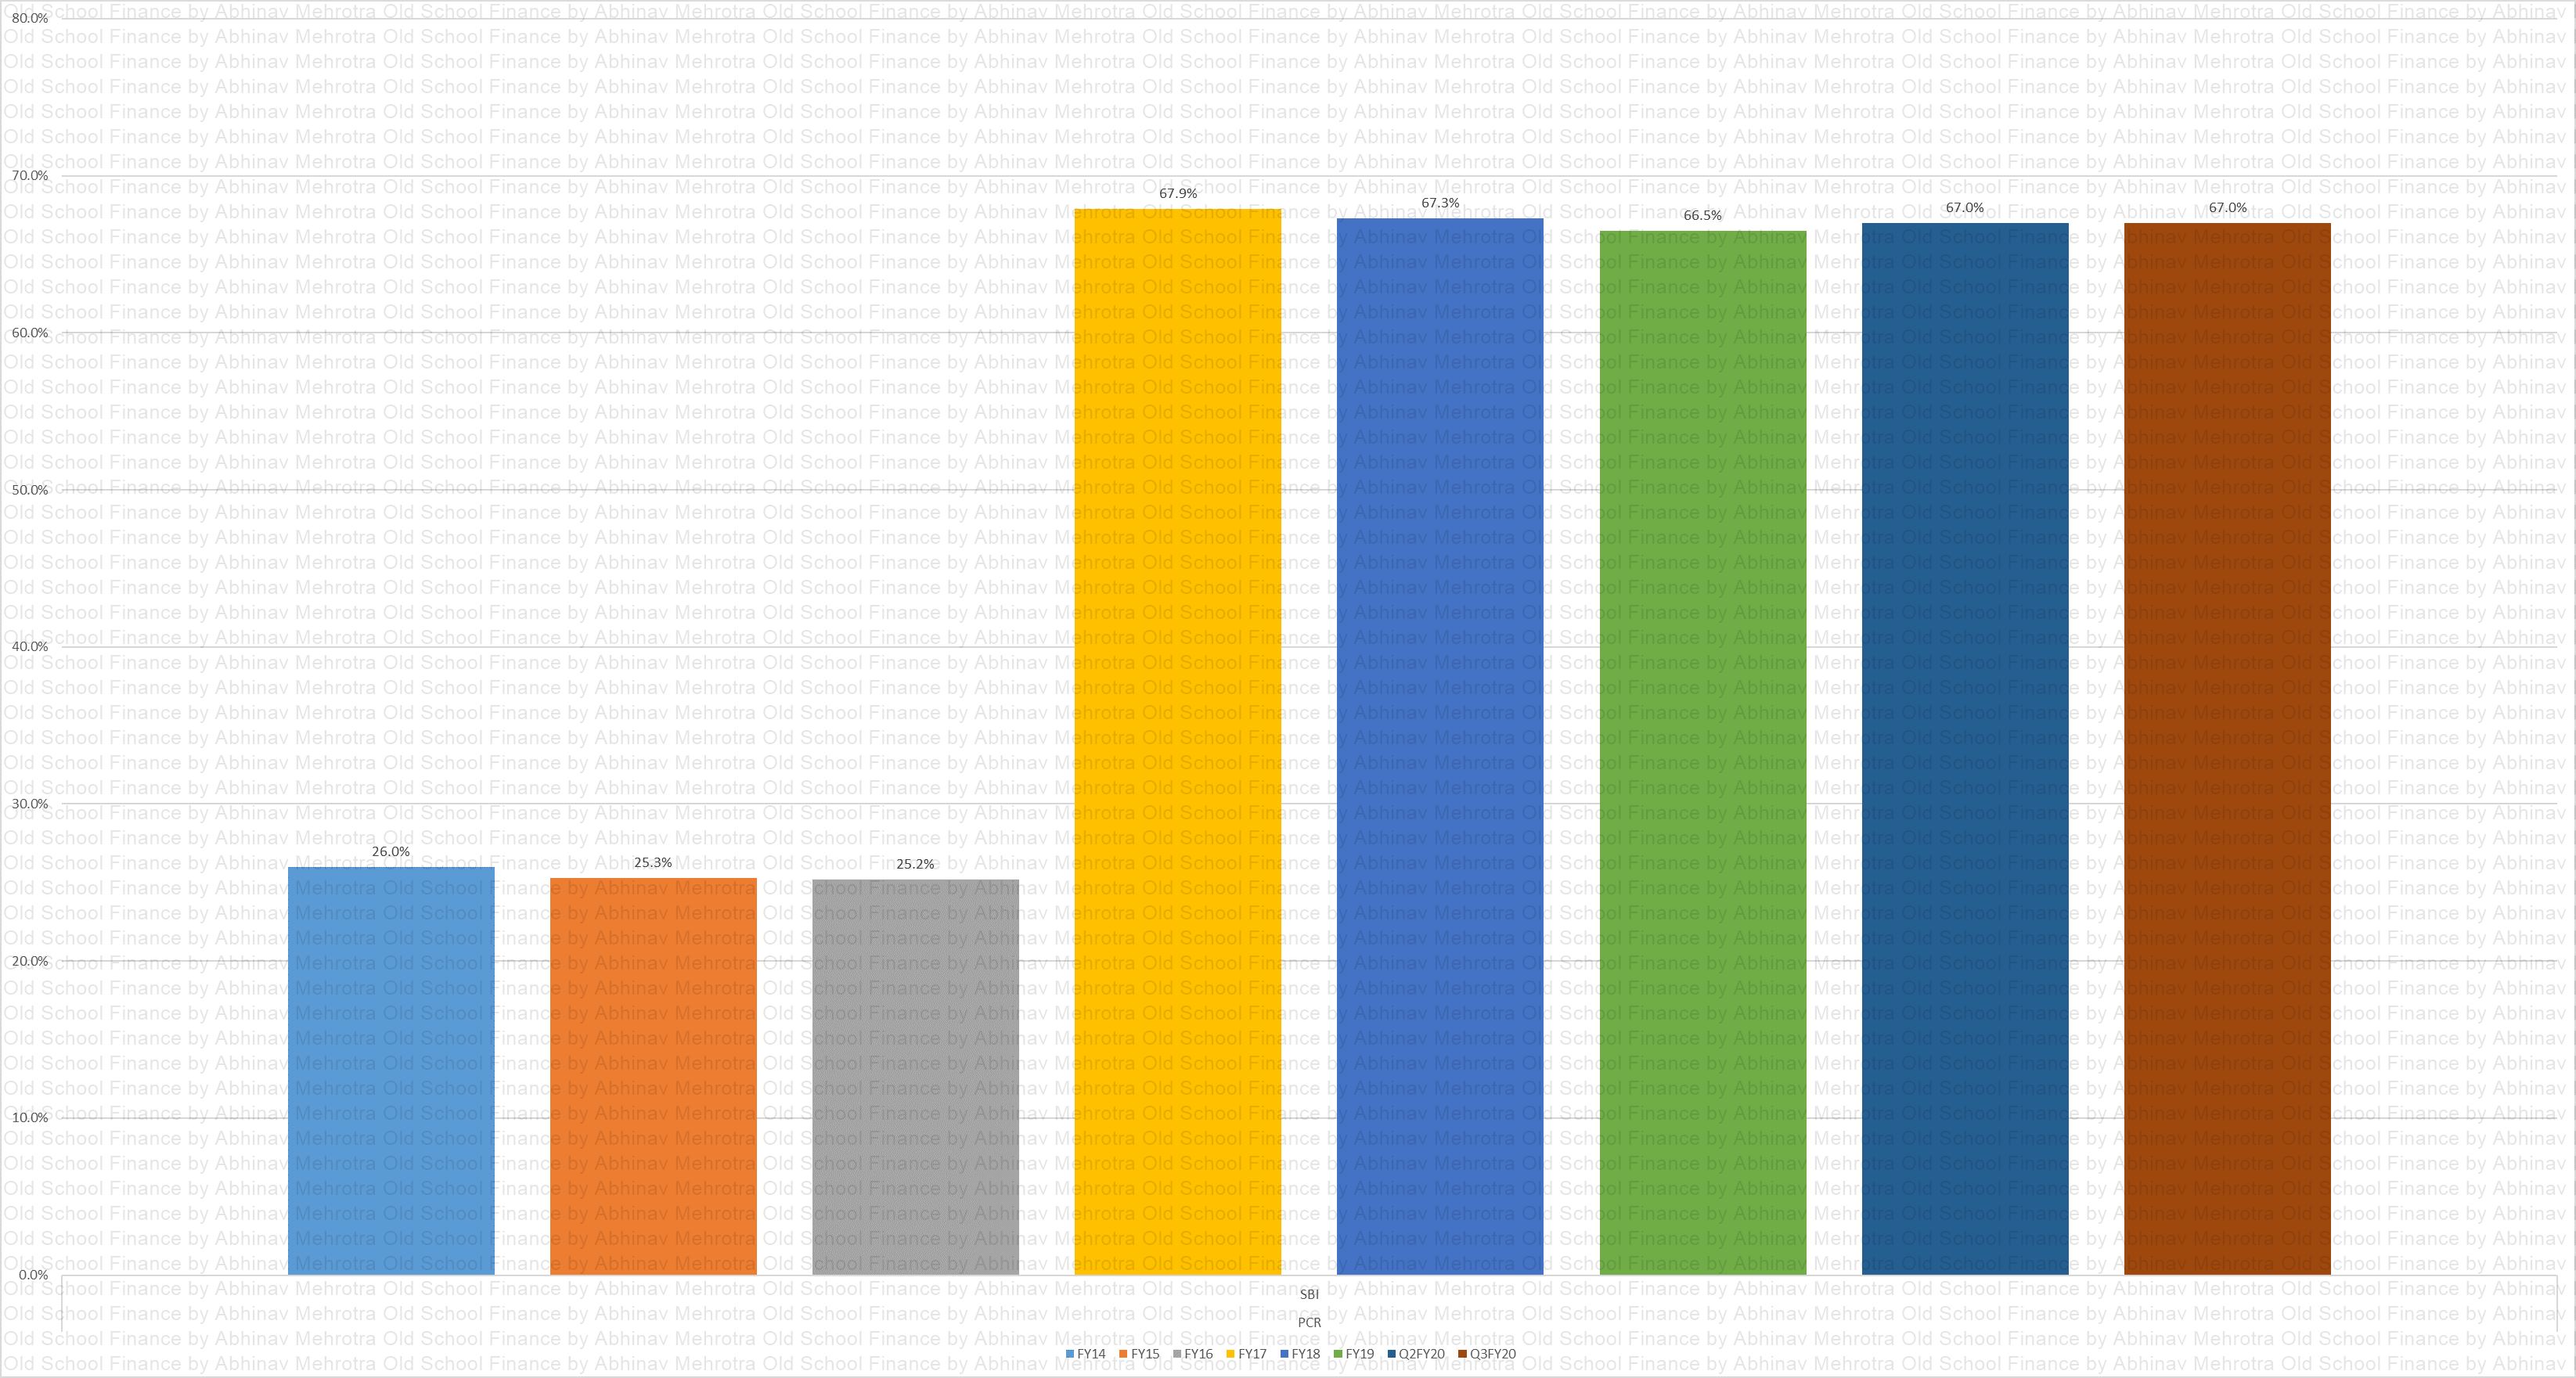
PCR
Chart 41 – Provision Coverage Ratio. Good to see PCR increasing with the entry of Carlyle.
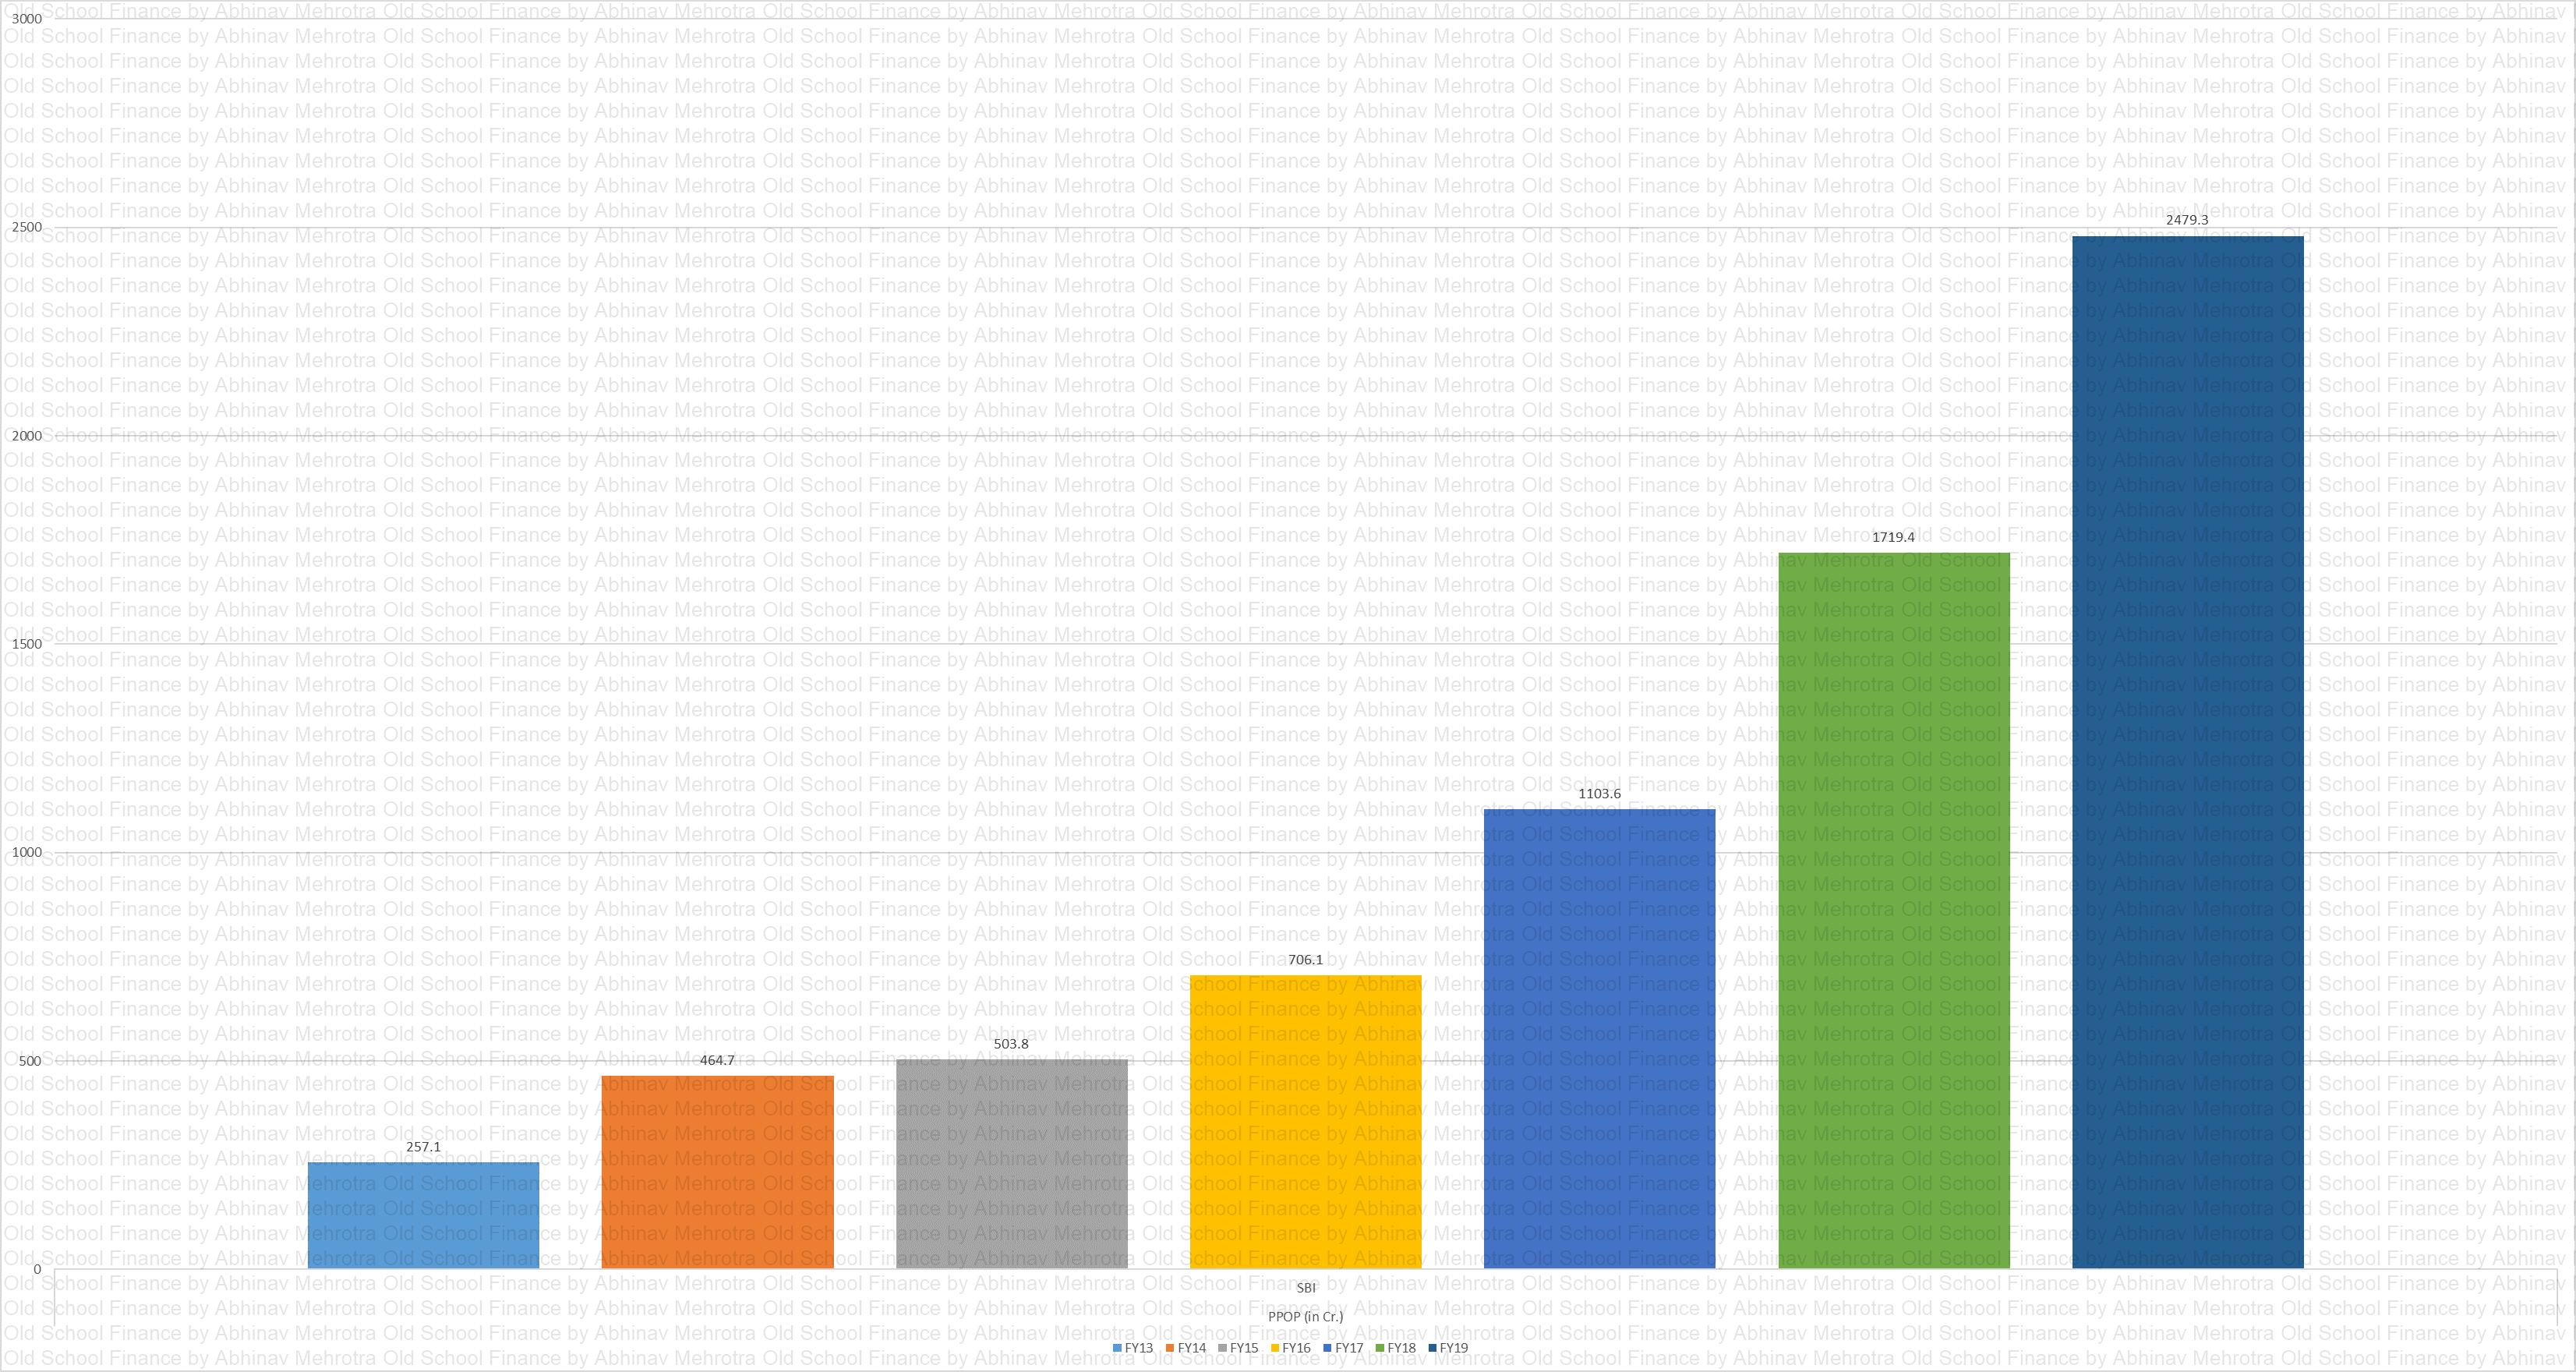
PPOP
Chart 42 – Pre-Provisioning Profit in absolute terms.
% Provisions
Chart 43 – Provisions as a % of average assets. With reference to Chart 19, I believe that these are the true credit cost on the loan book of the company. These are awfully high and are a result of the unsecured nature of the loan book. Will seek confirmation from the management.
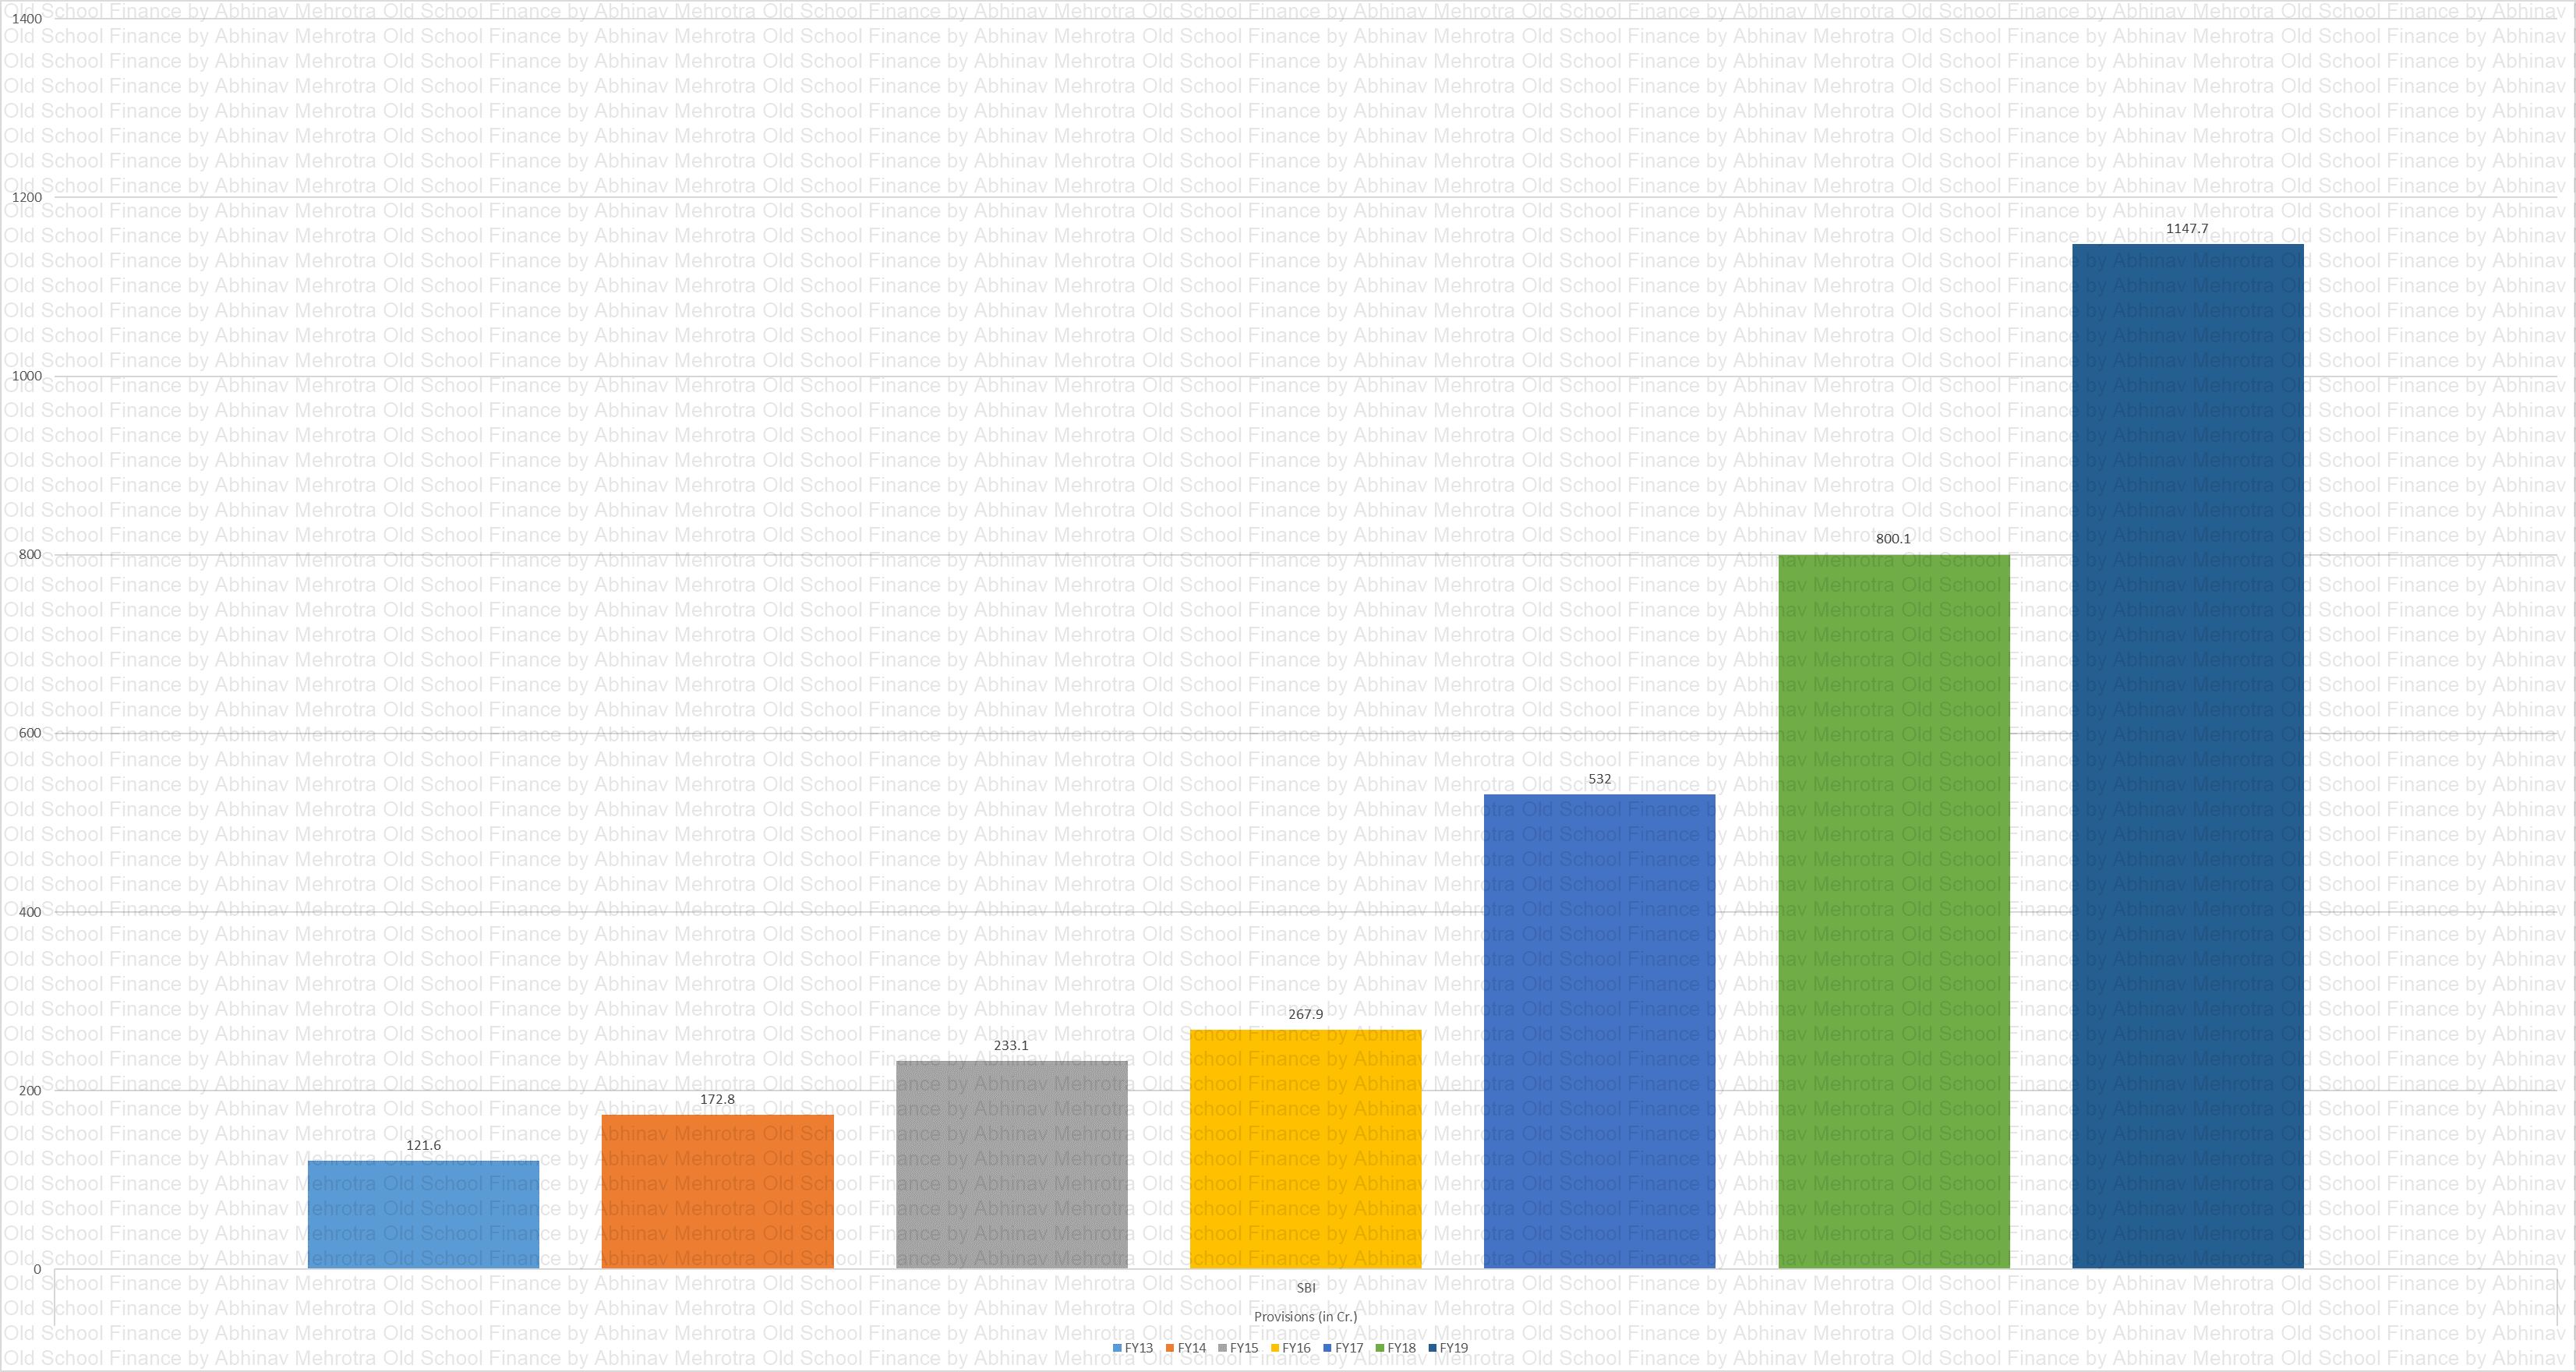
Provisions
Chart 44 – Provision Expenses in absolute terms.
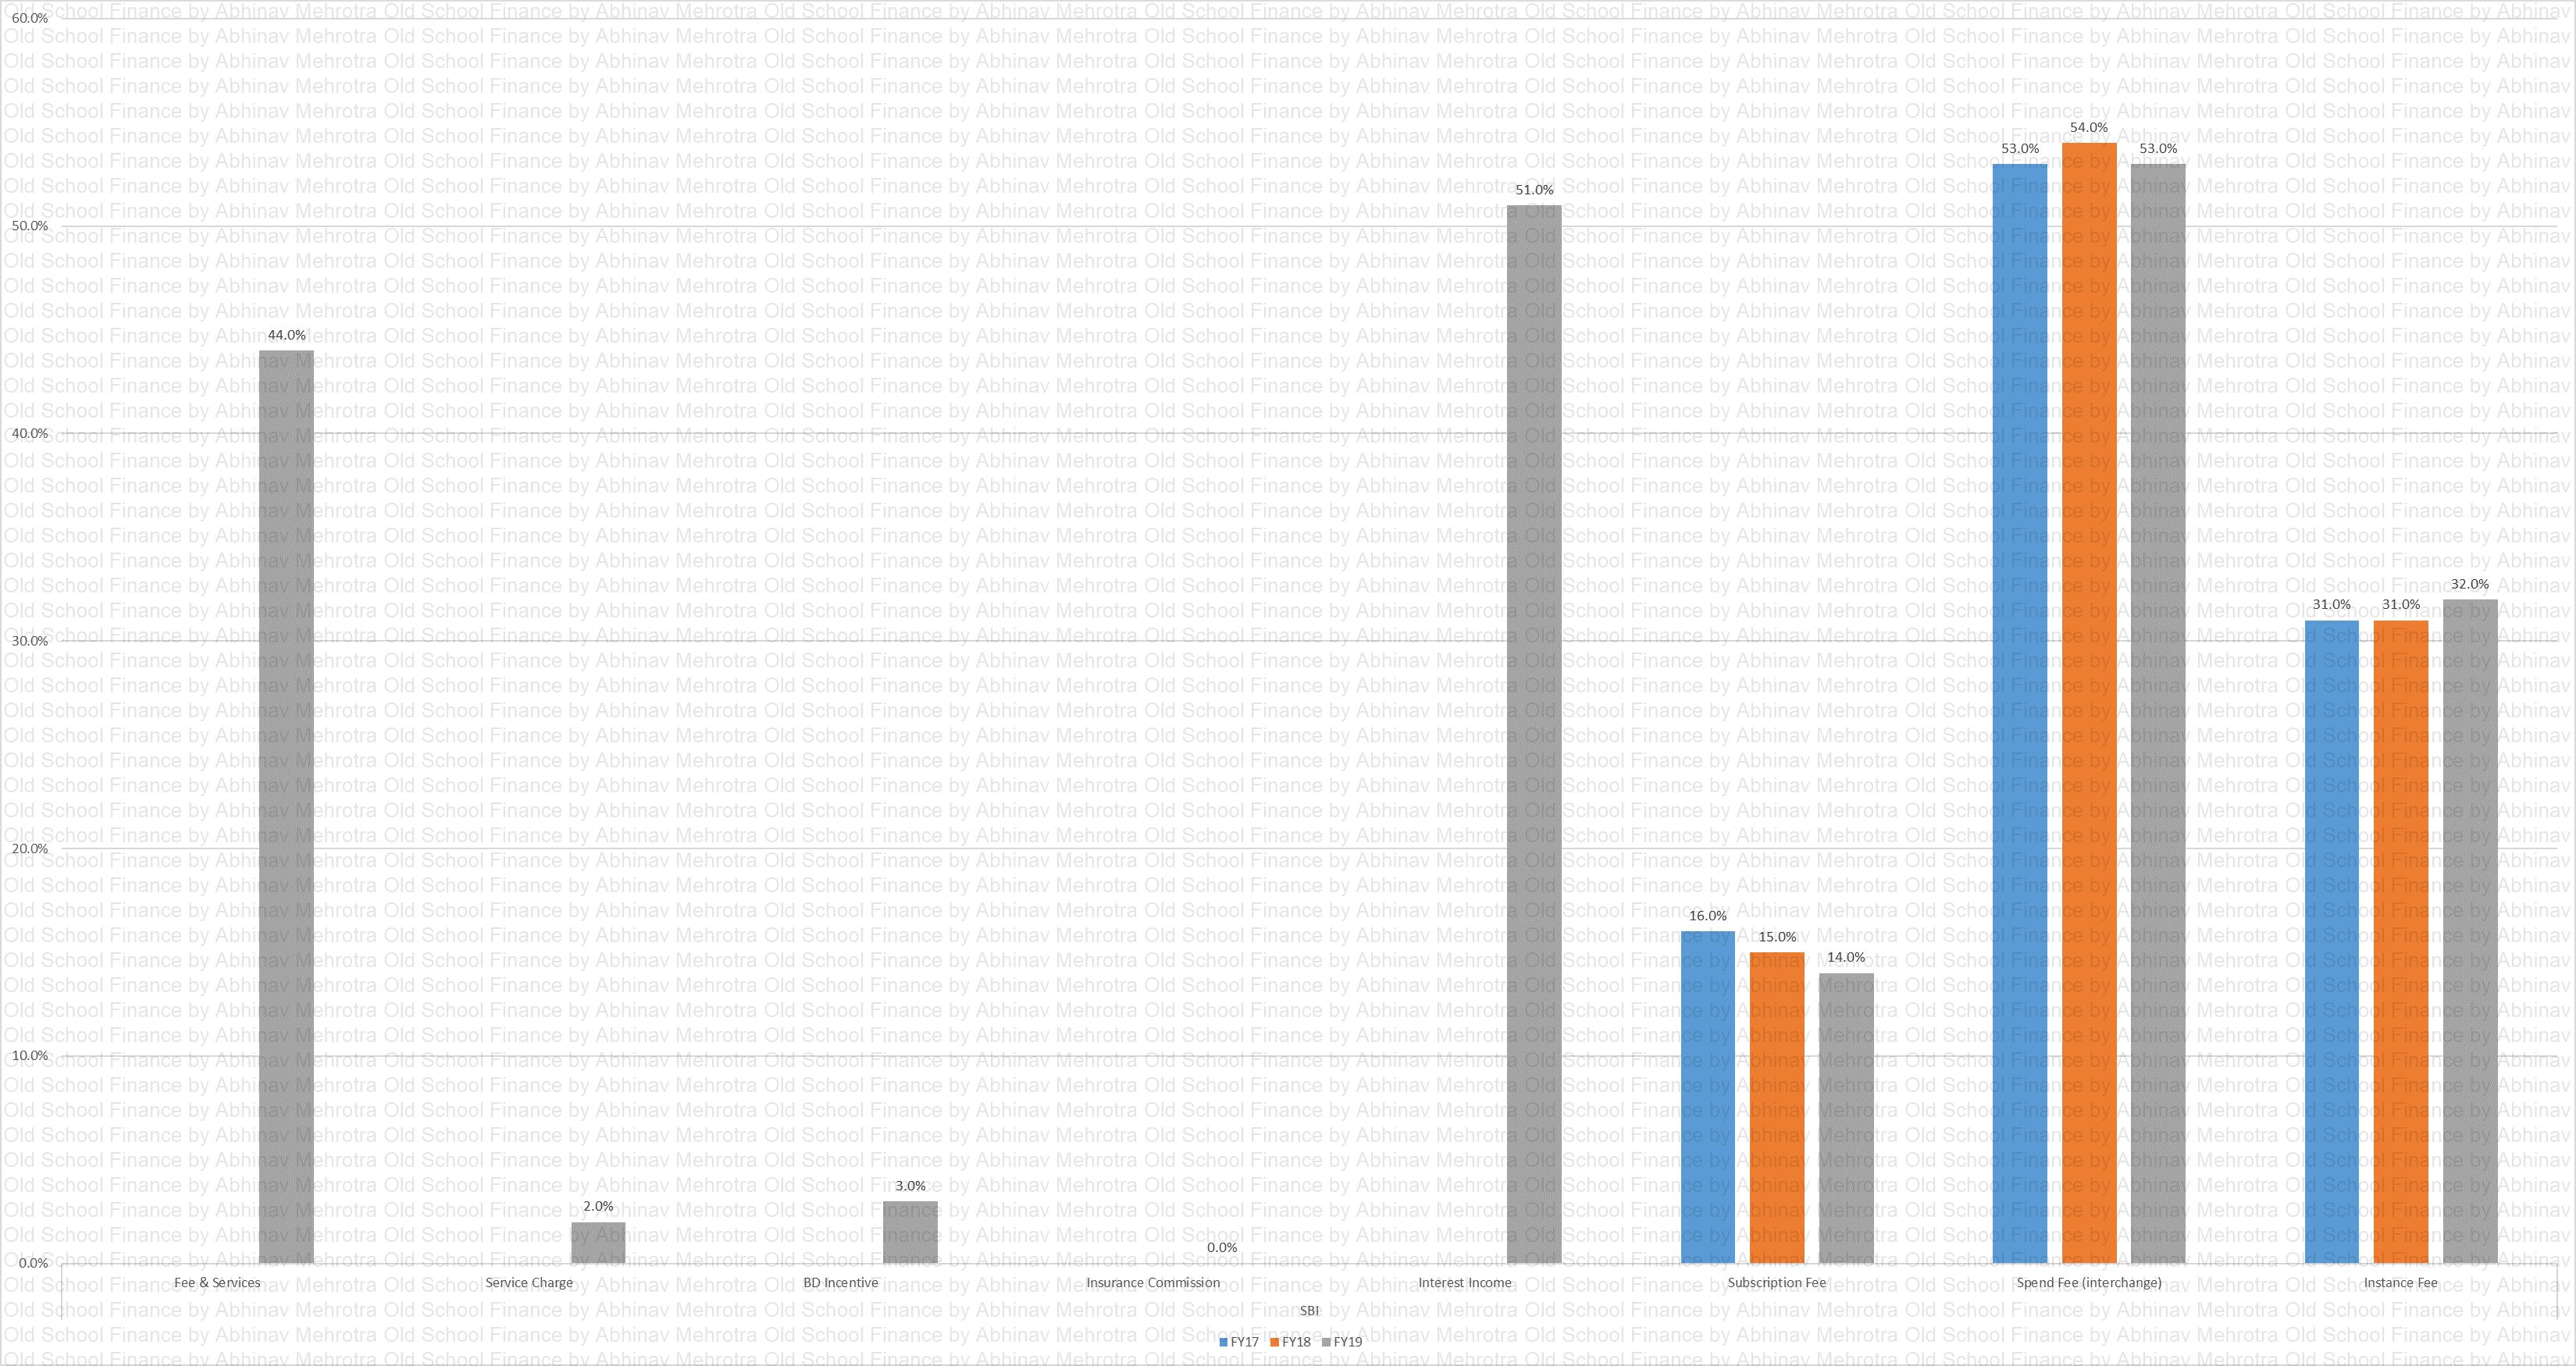
Rev. Seg.
Chart 45 – Depicts the revenue segmentation. Half of the revenue comes from interest and the other half from fee-based income. Amongst fee-based income, half comes from the interchange fee, one third from instance fee and the rest from annual subscription charge.
Rewards Spend
Chart 46 – Reward redemption expenses as a percentage of total spend on the card. RBL is clearly trying to lure customers with rewards. SBI is being competitive by offering higher rewards than competitors.
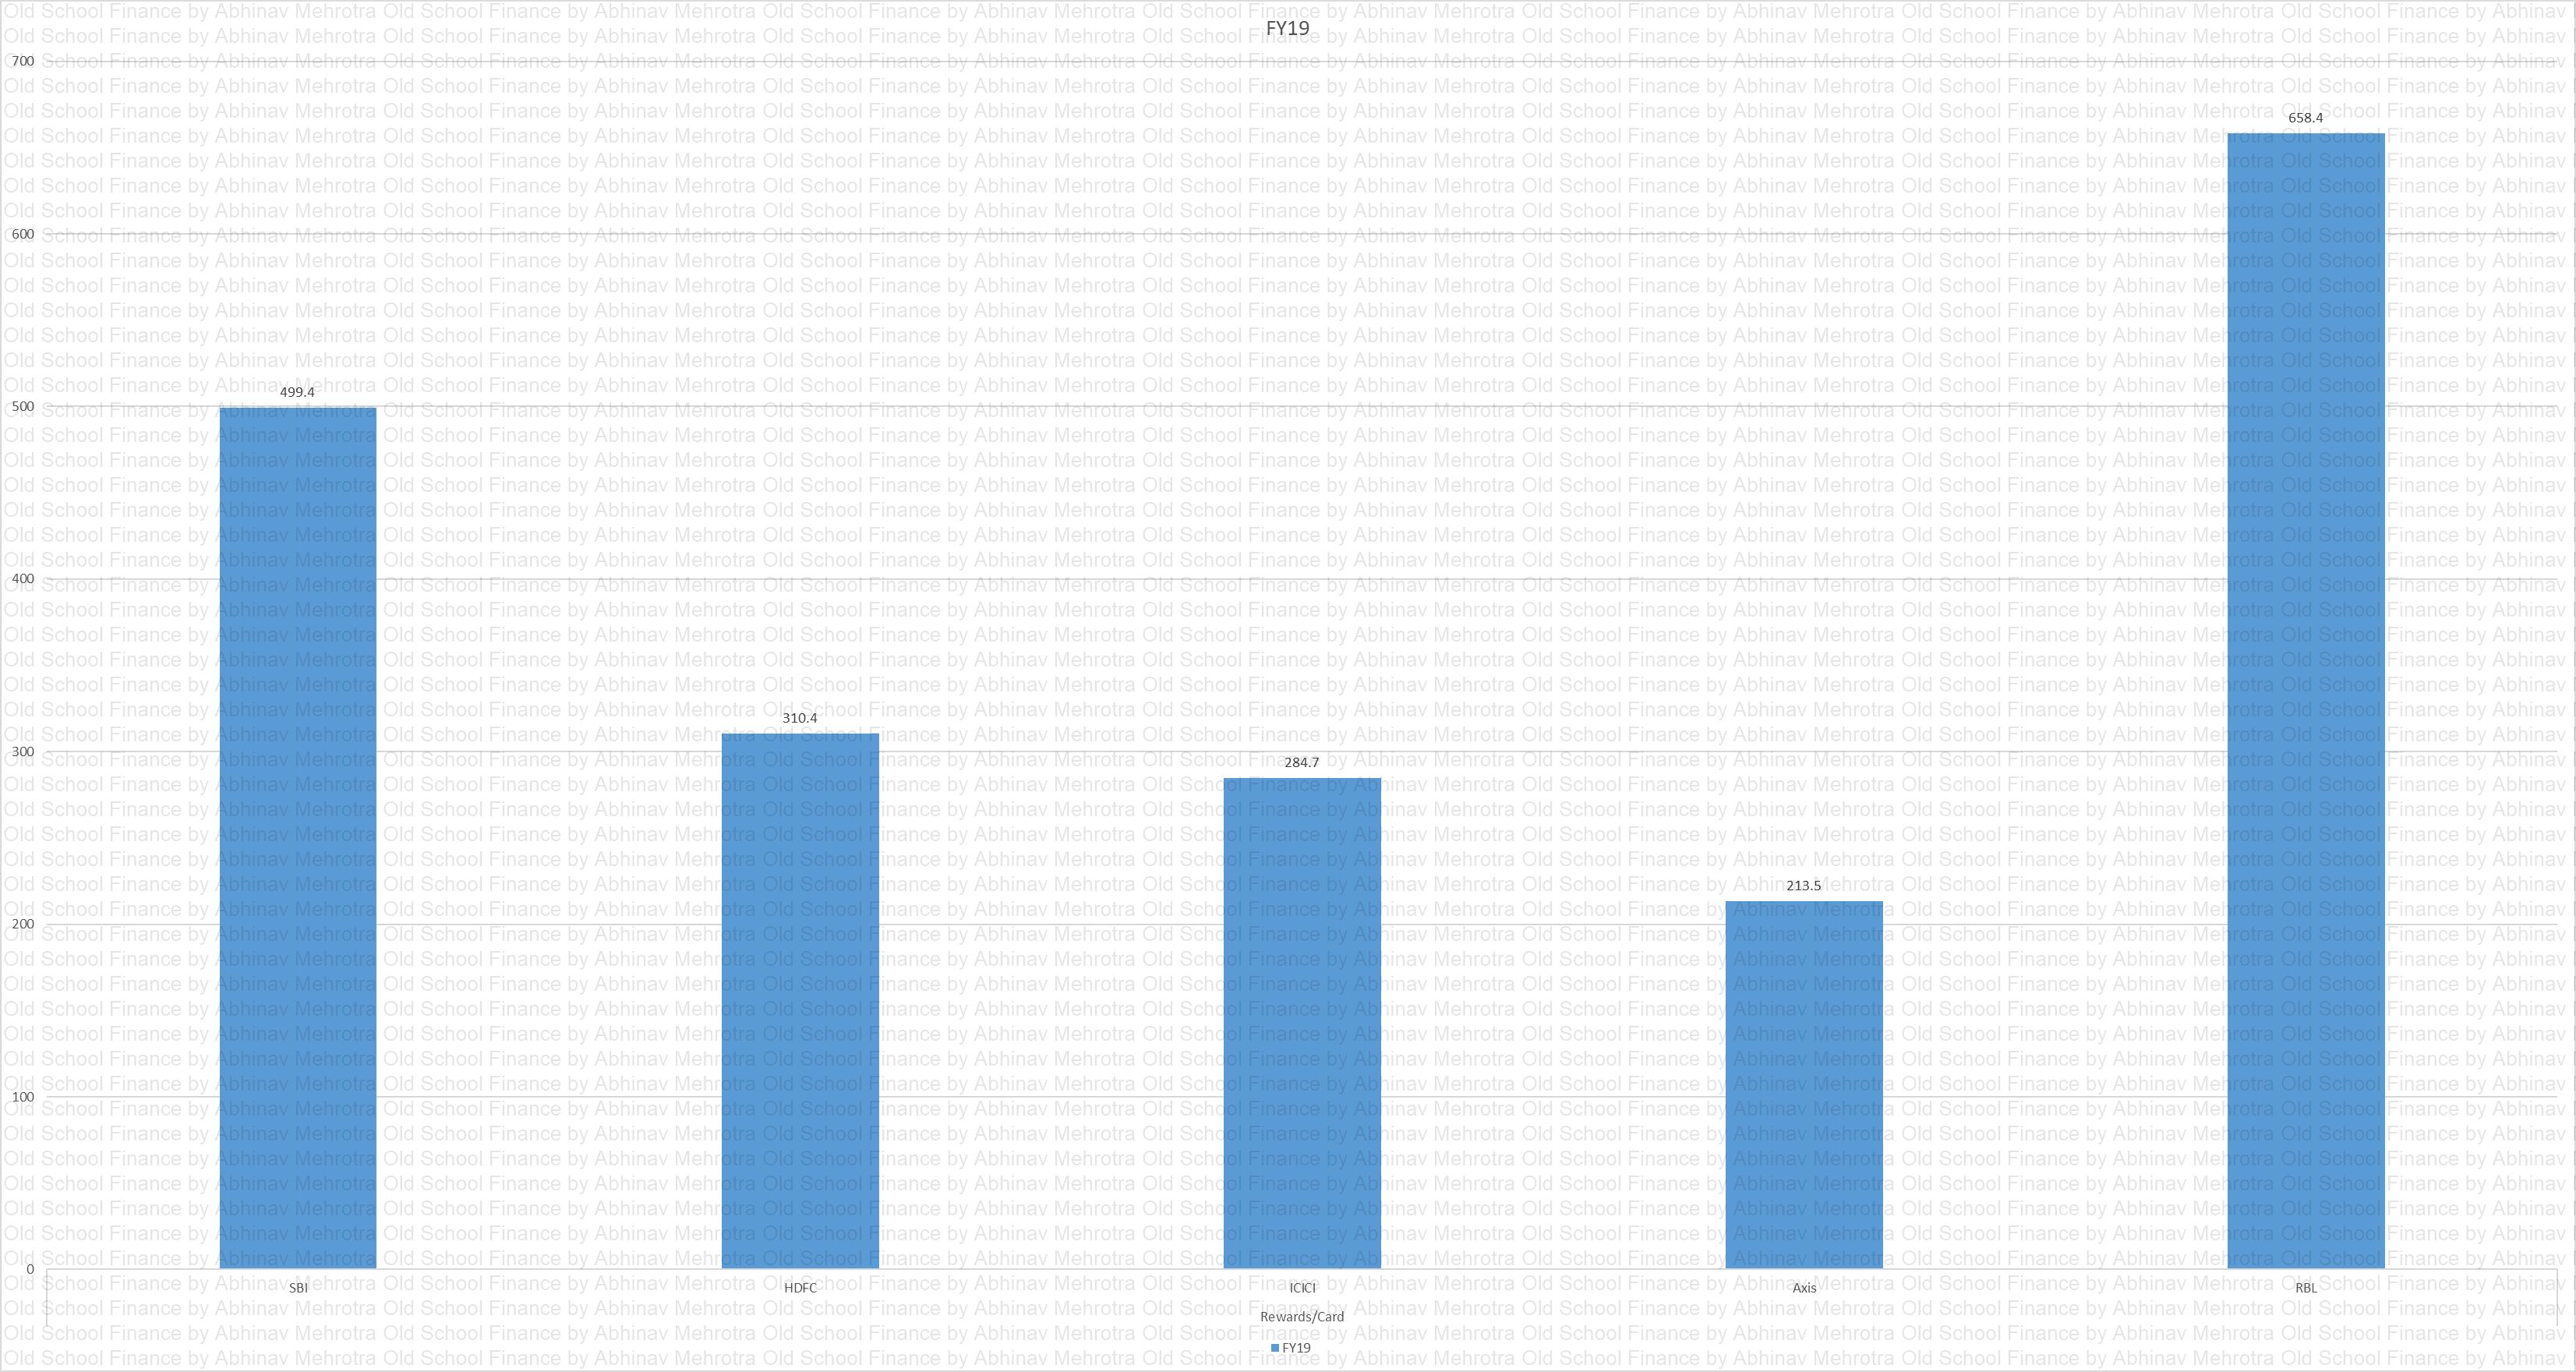
Rewards CC
Chart 47 – Rewards expense per card in absolute terms. Same story as above.
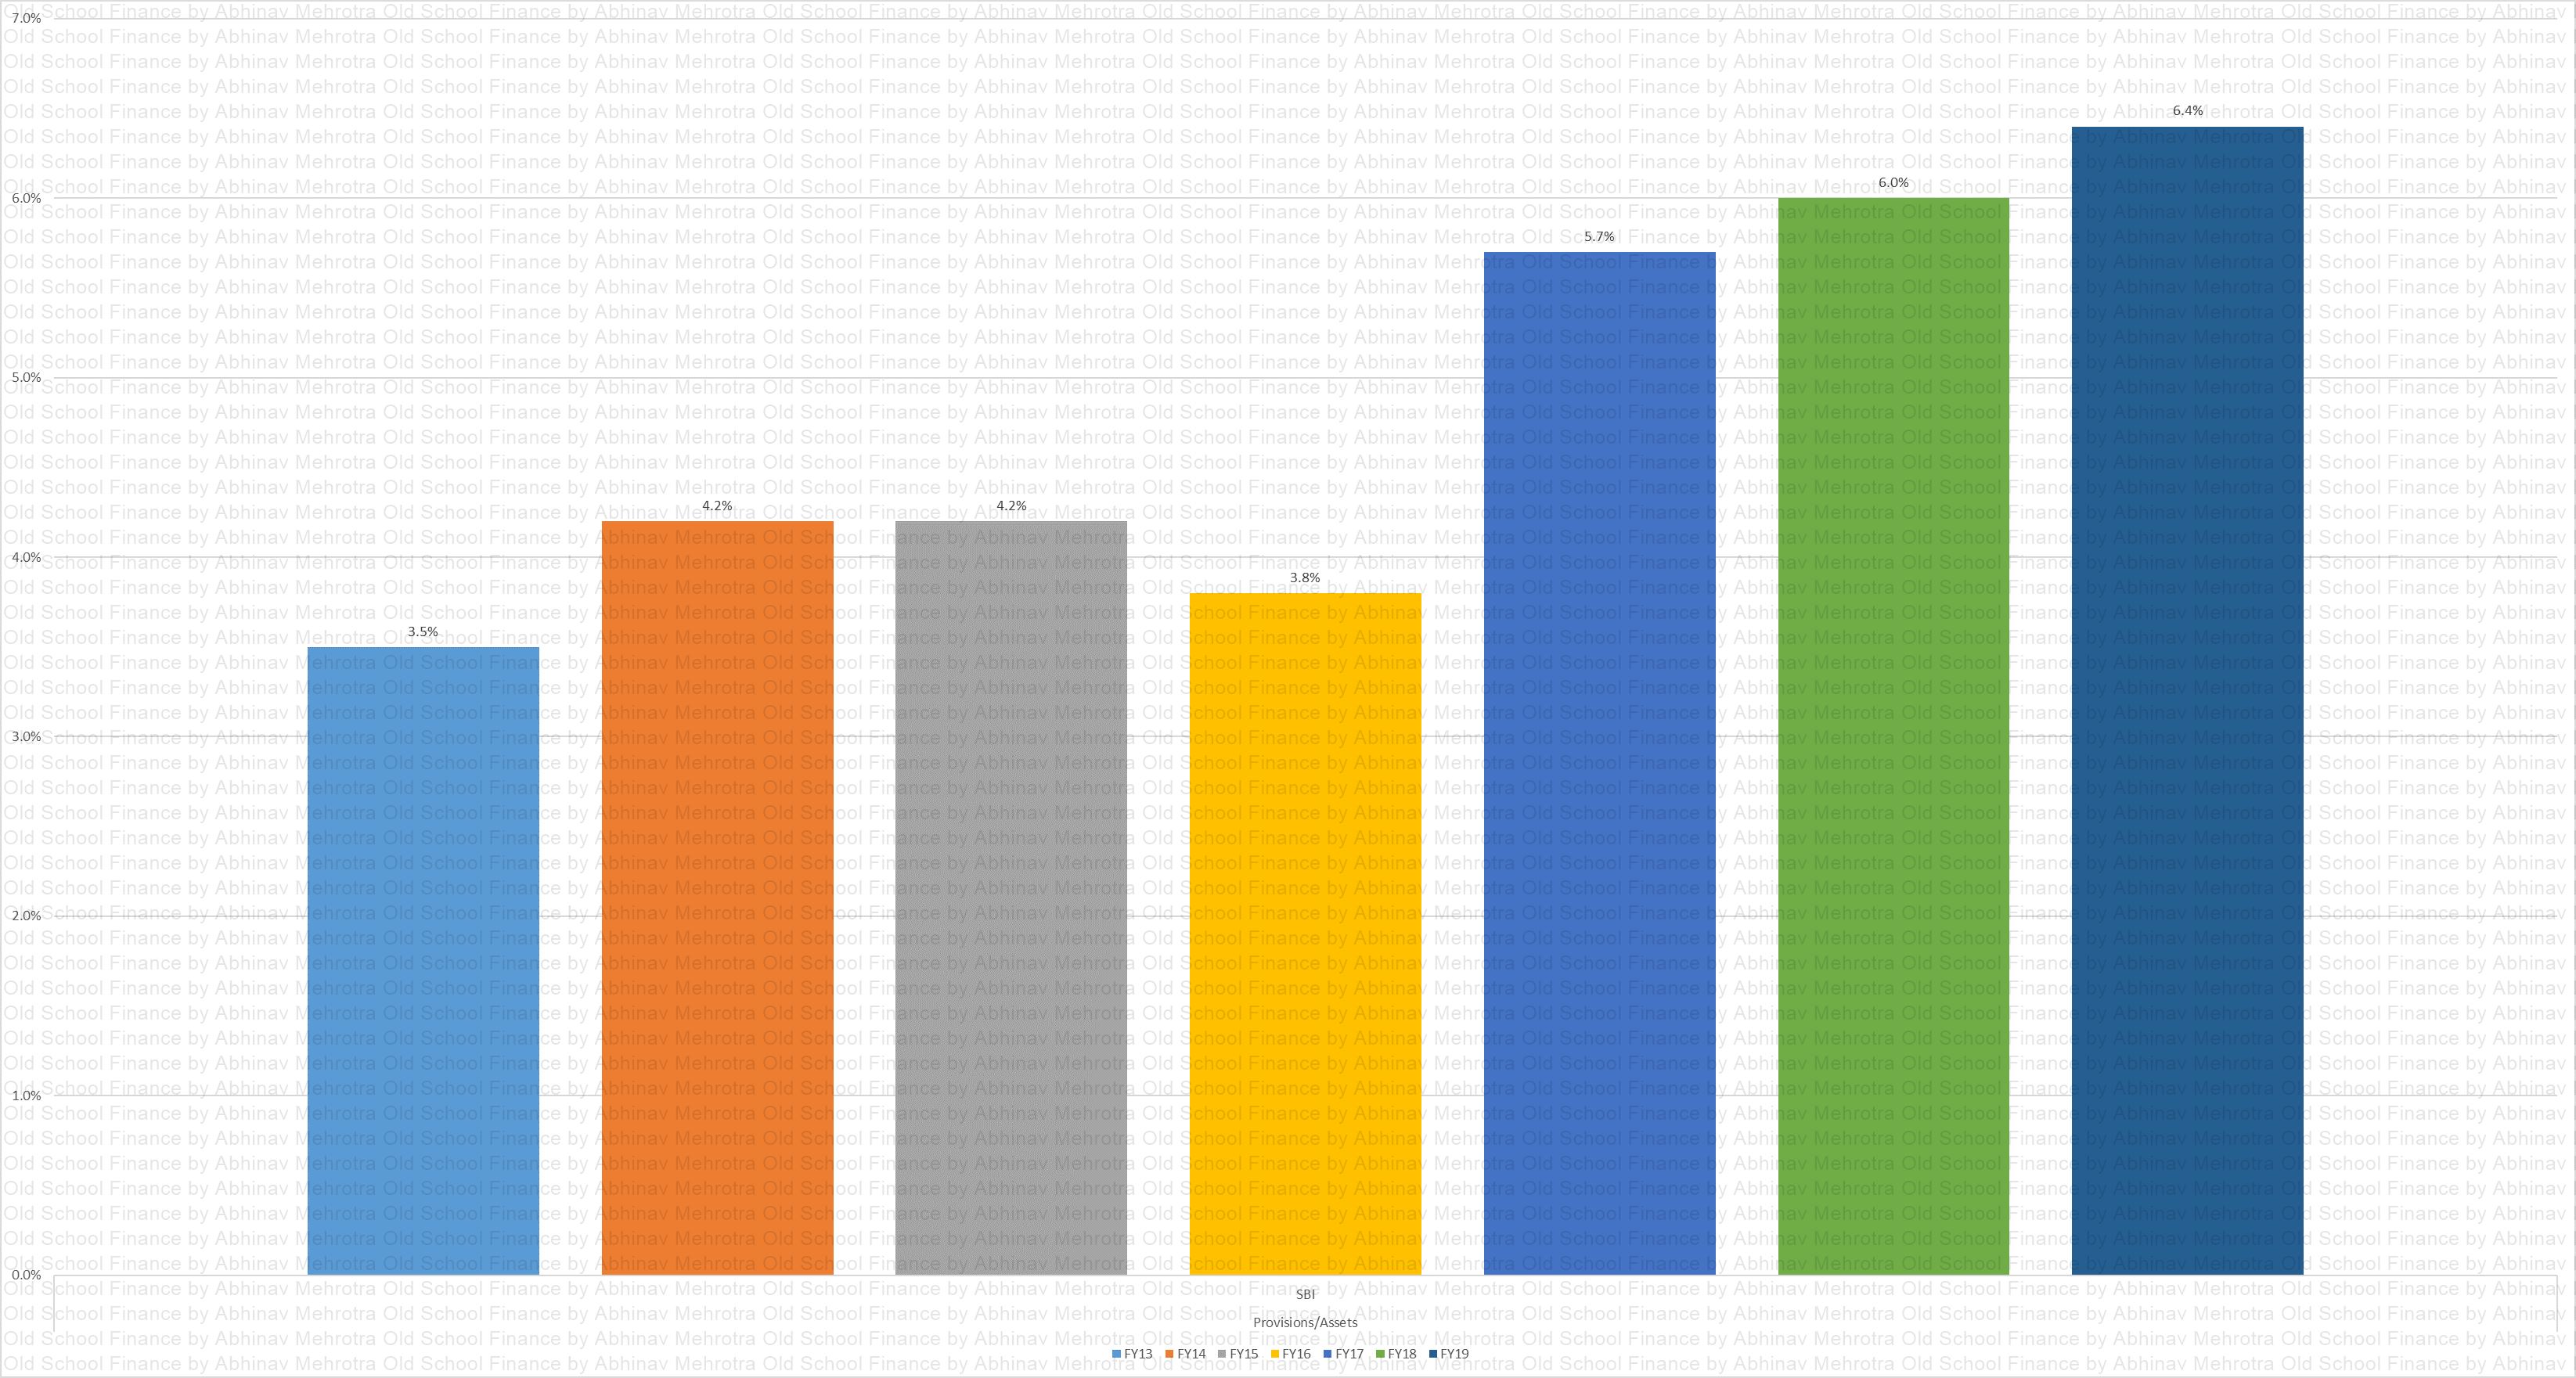
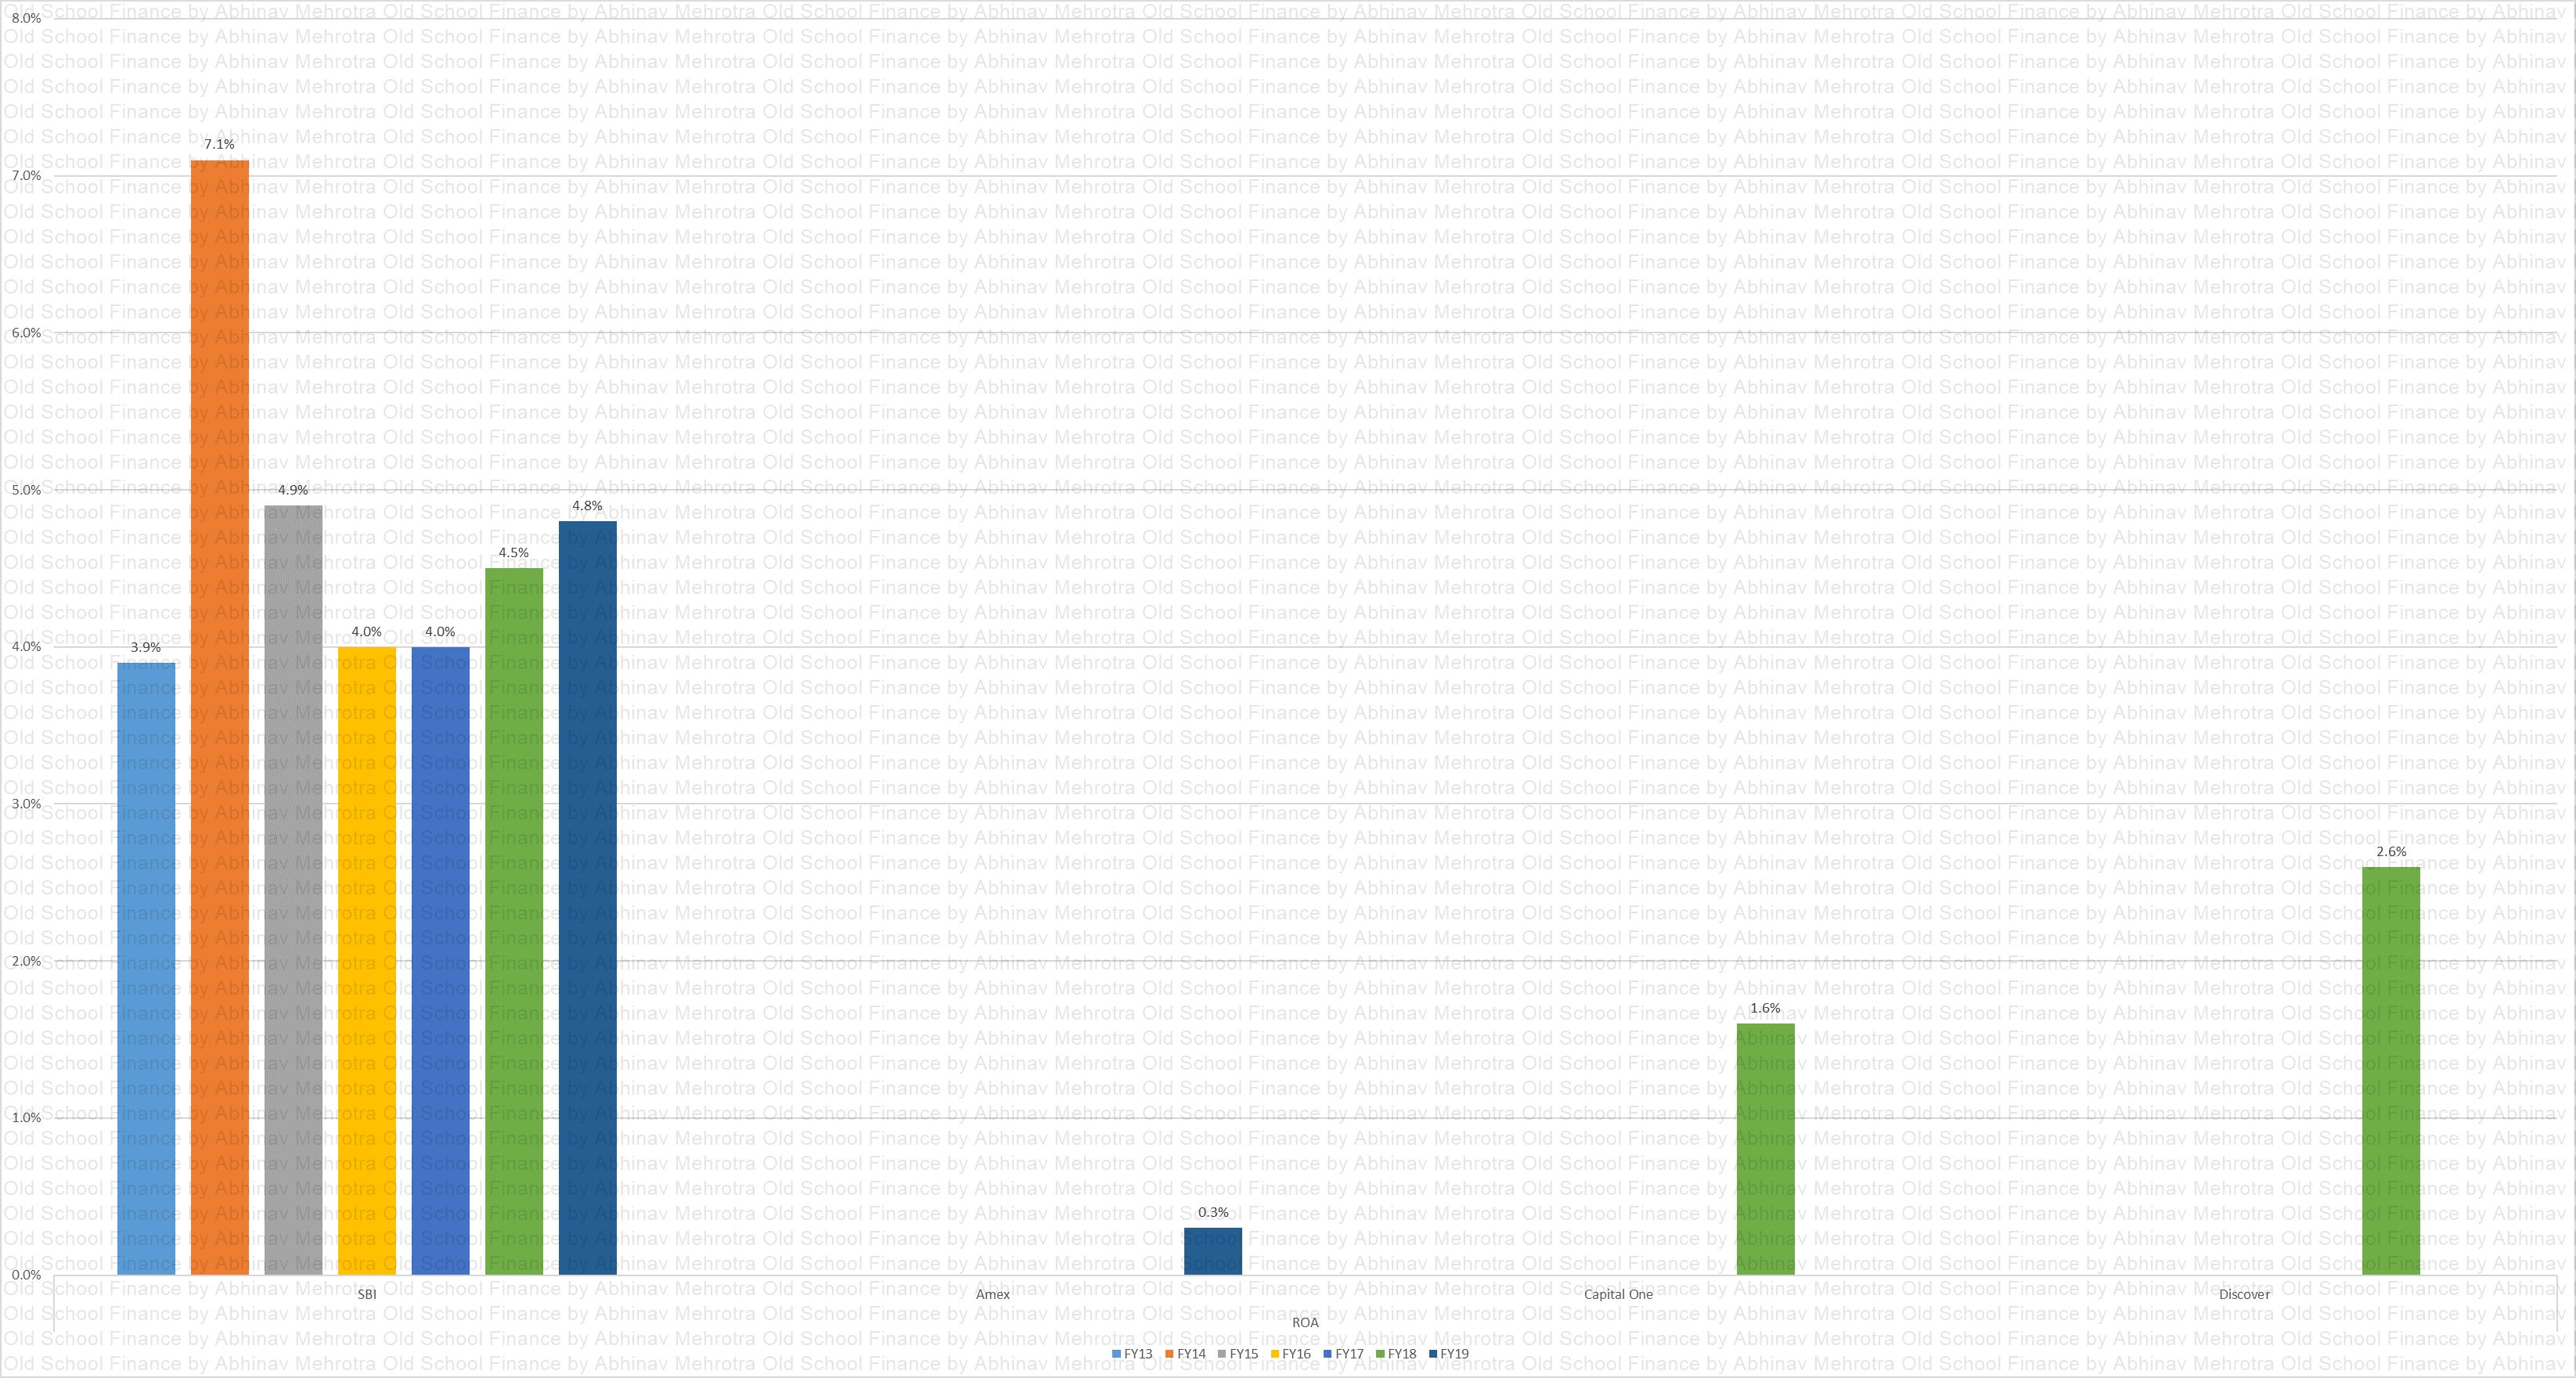
ROA
Chart 48 – Return of Assets (ROA) has been maintained throughout. AMEX’s figures are for India business and are surprising. Industry benchmark ROA is 3.5%.
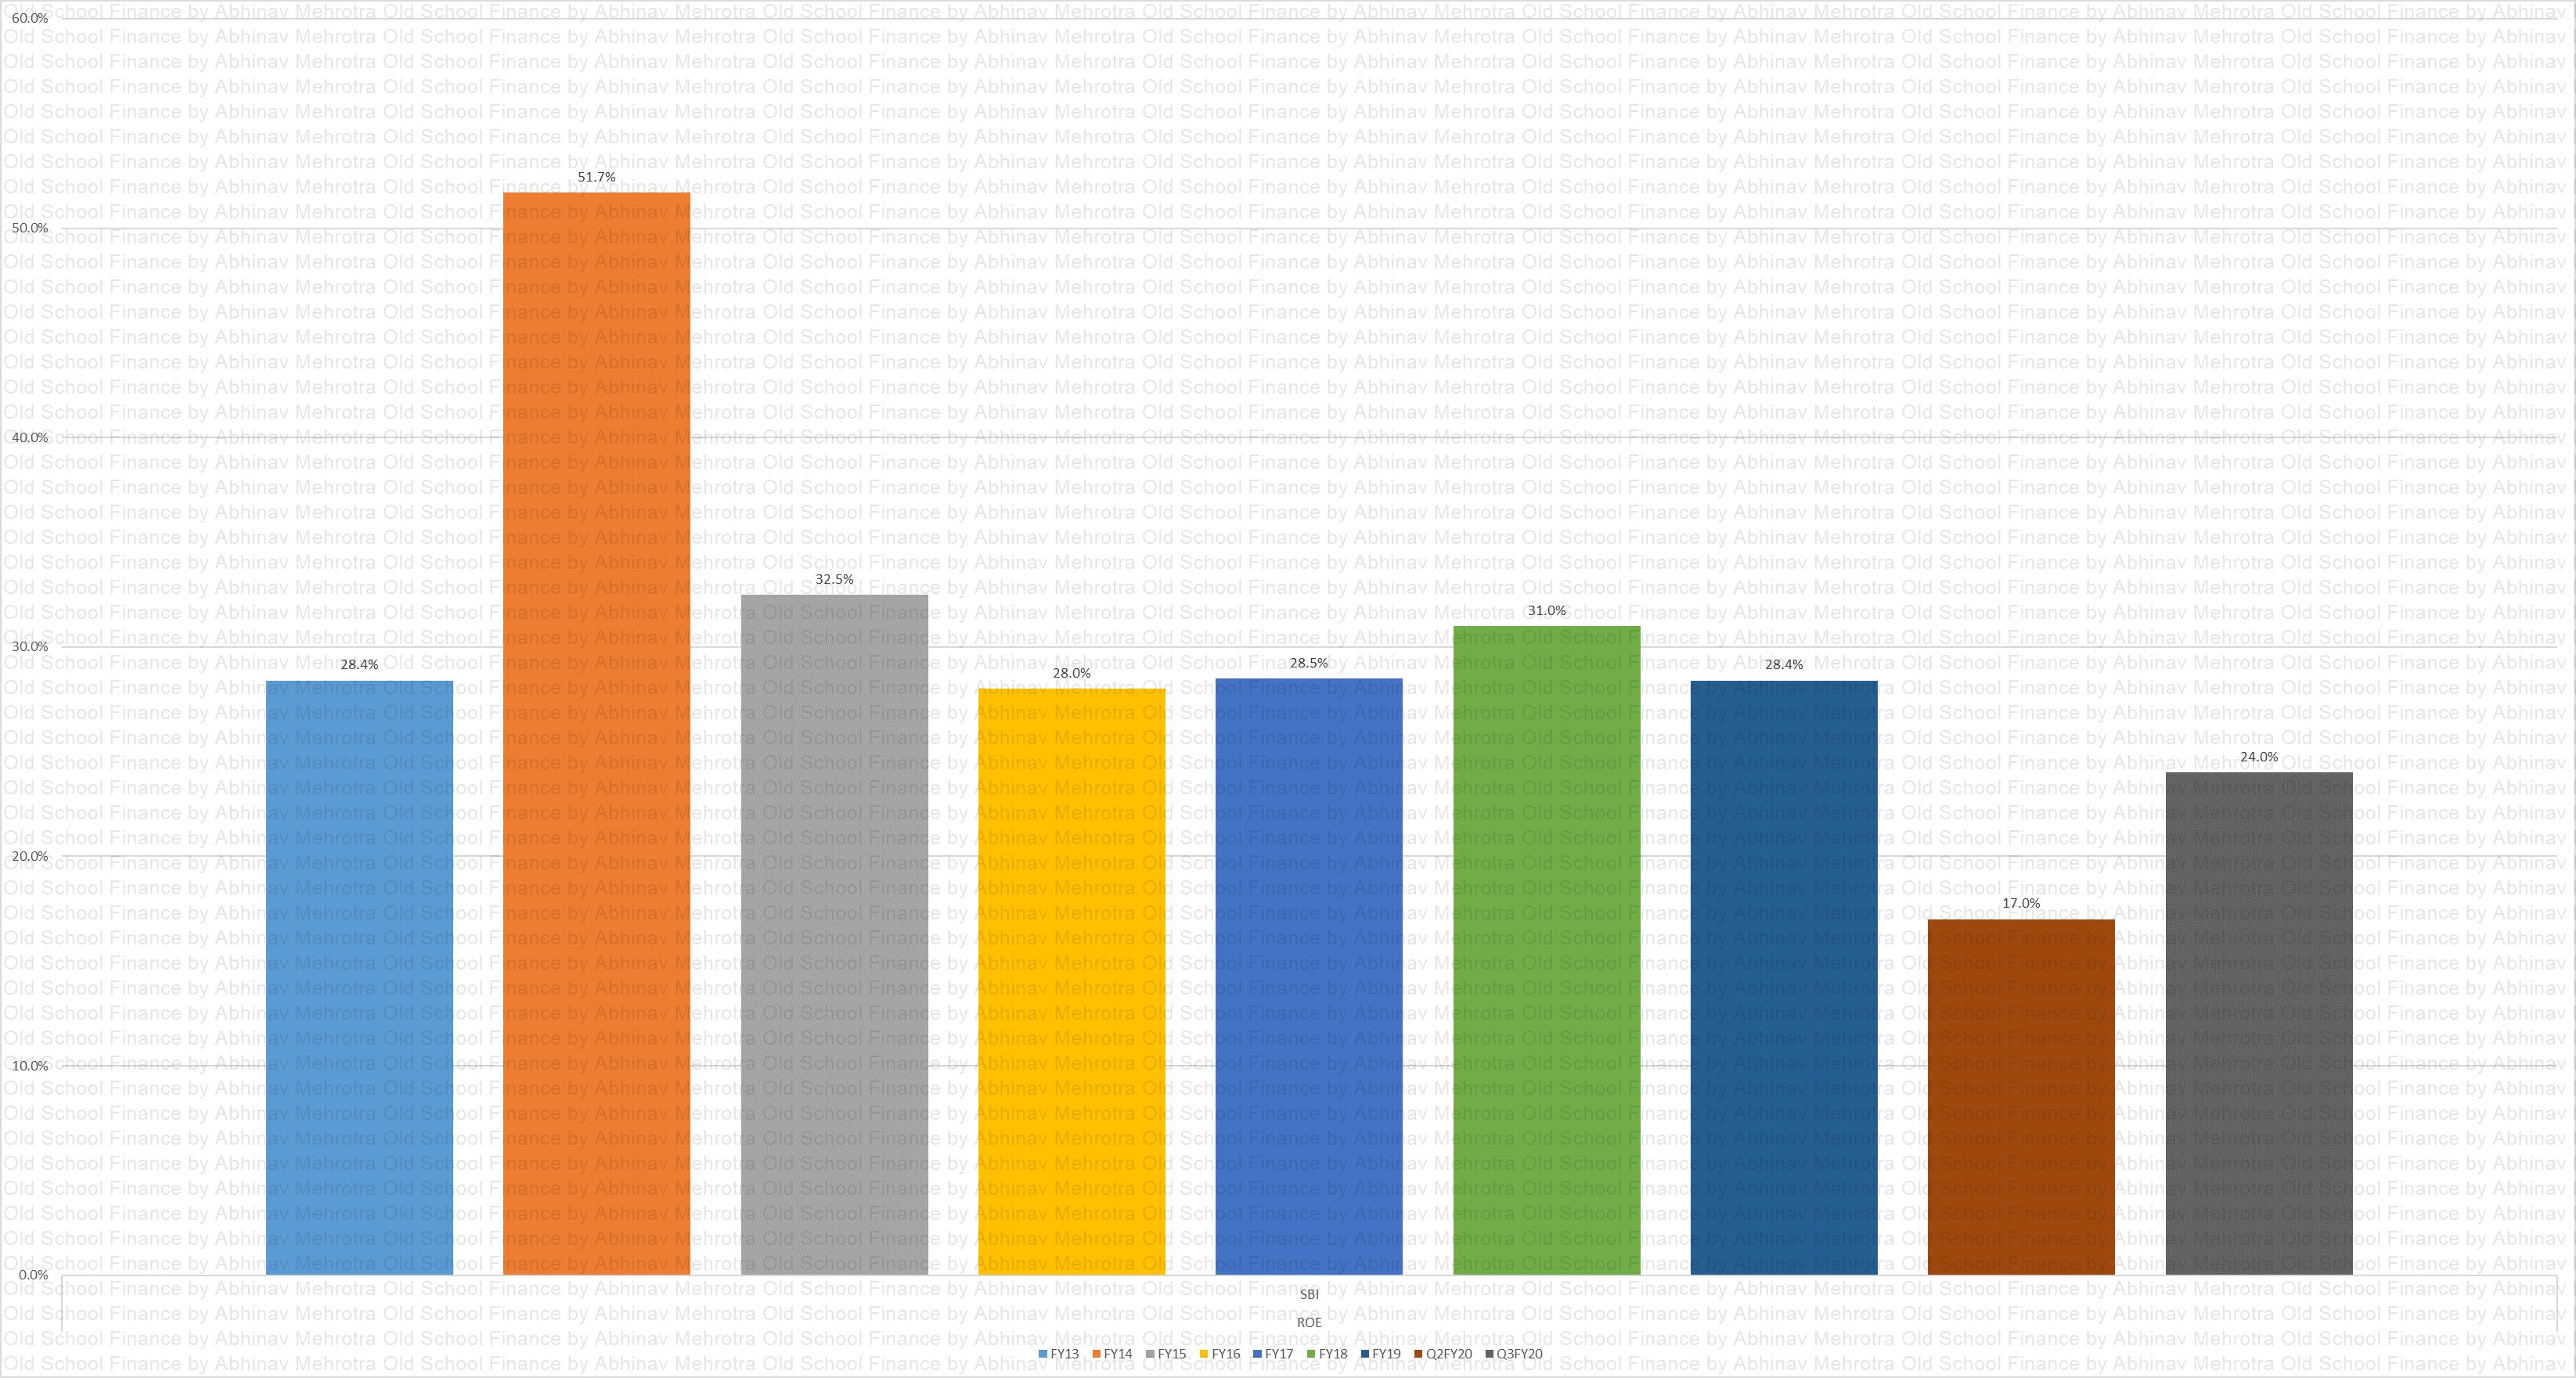
ROE
Chart 49 – Return on Equity (ROE) is stable over the years.
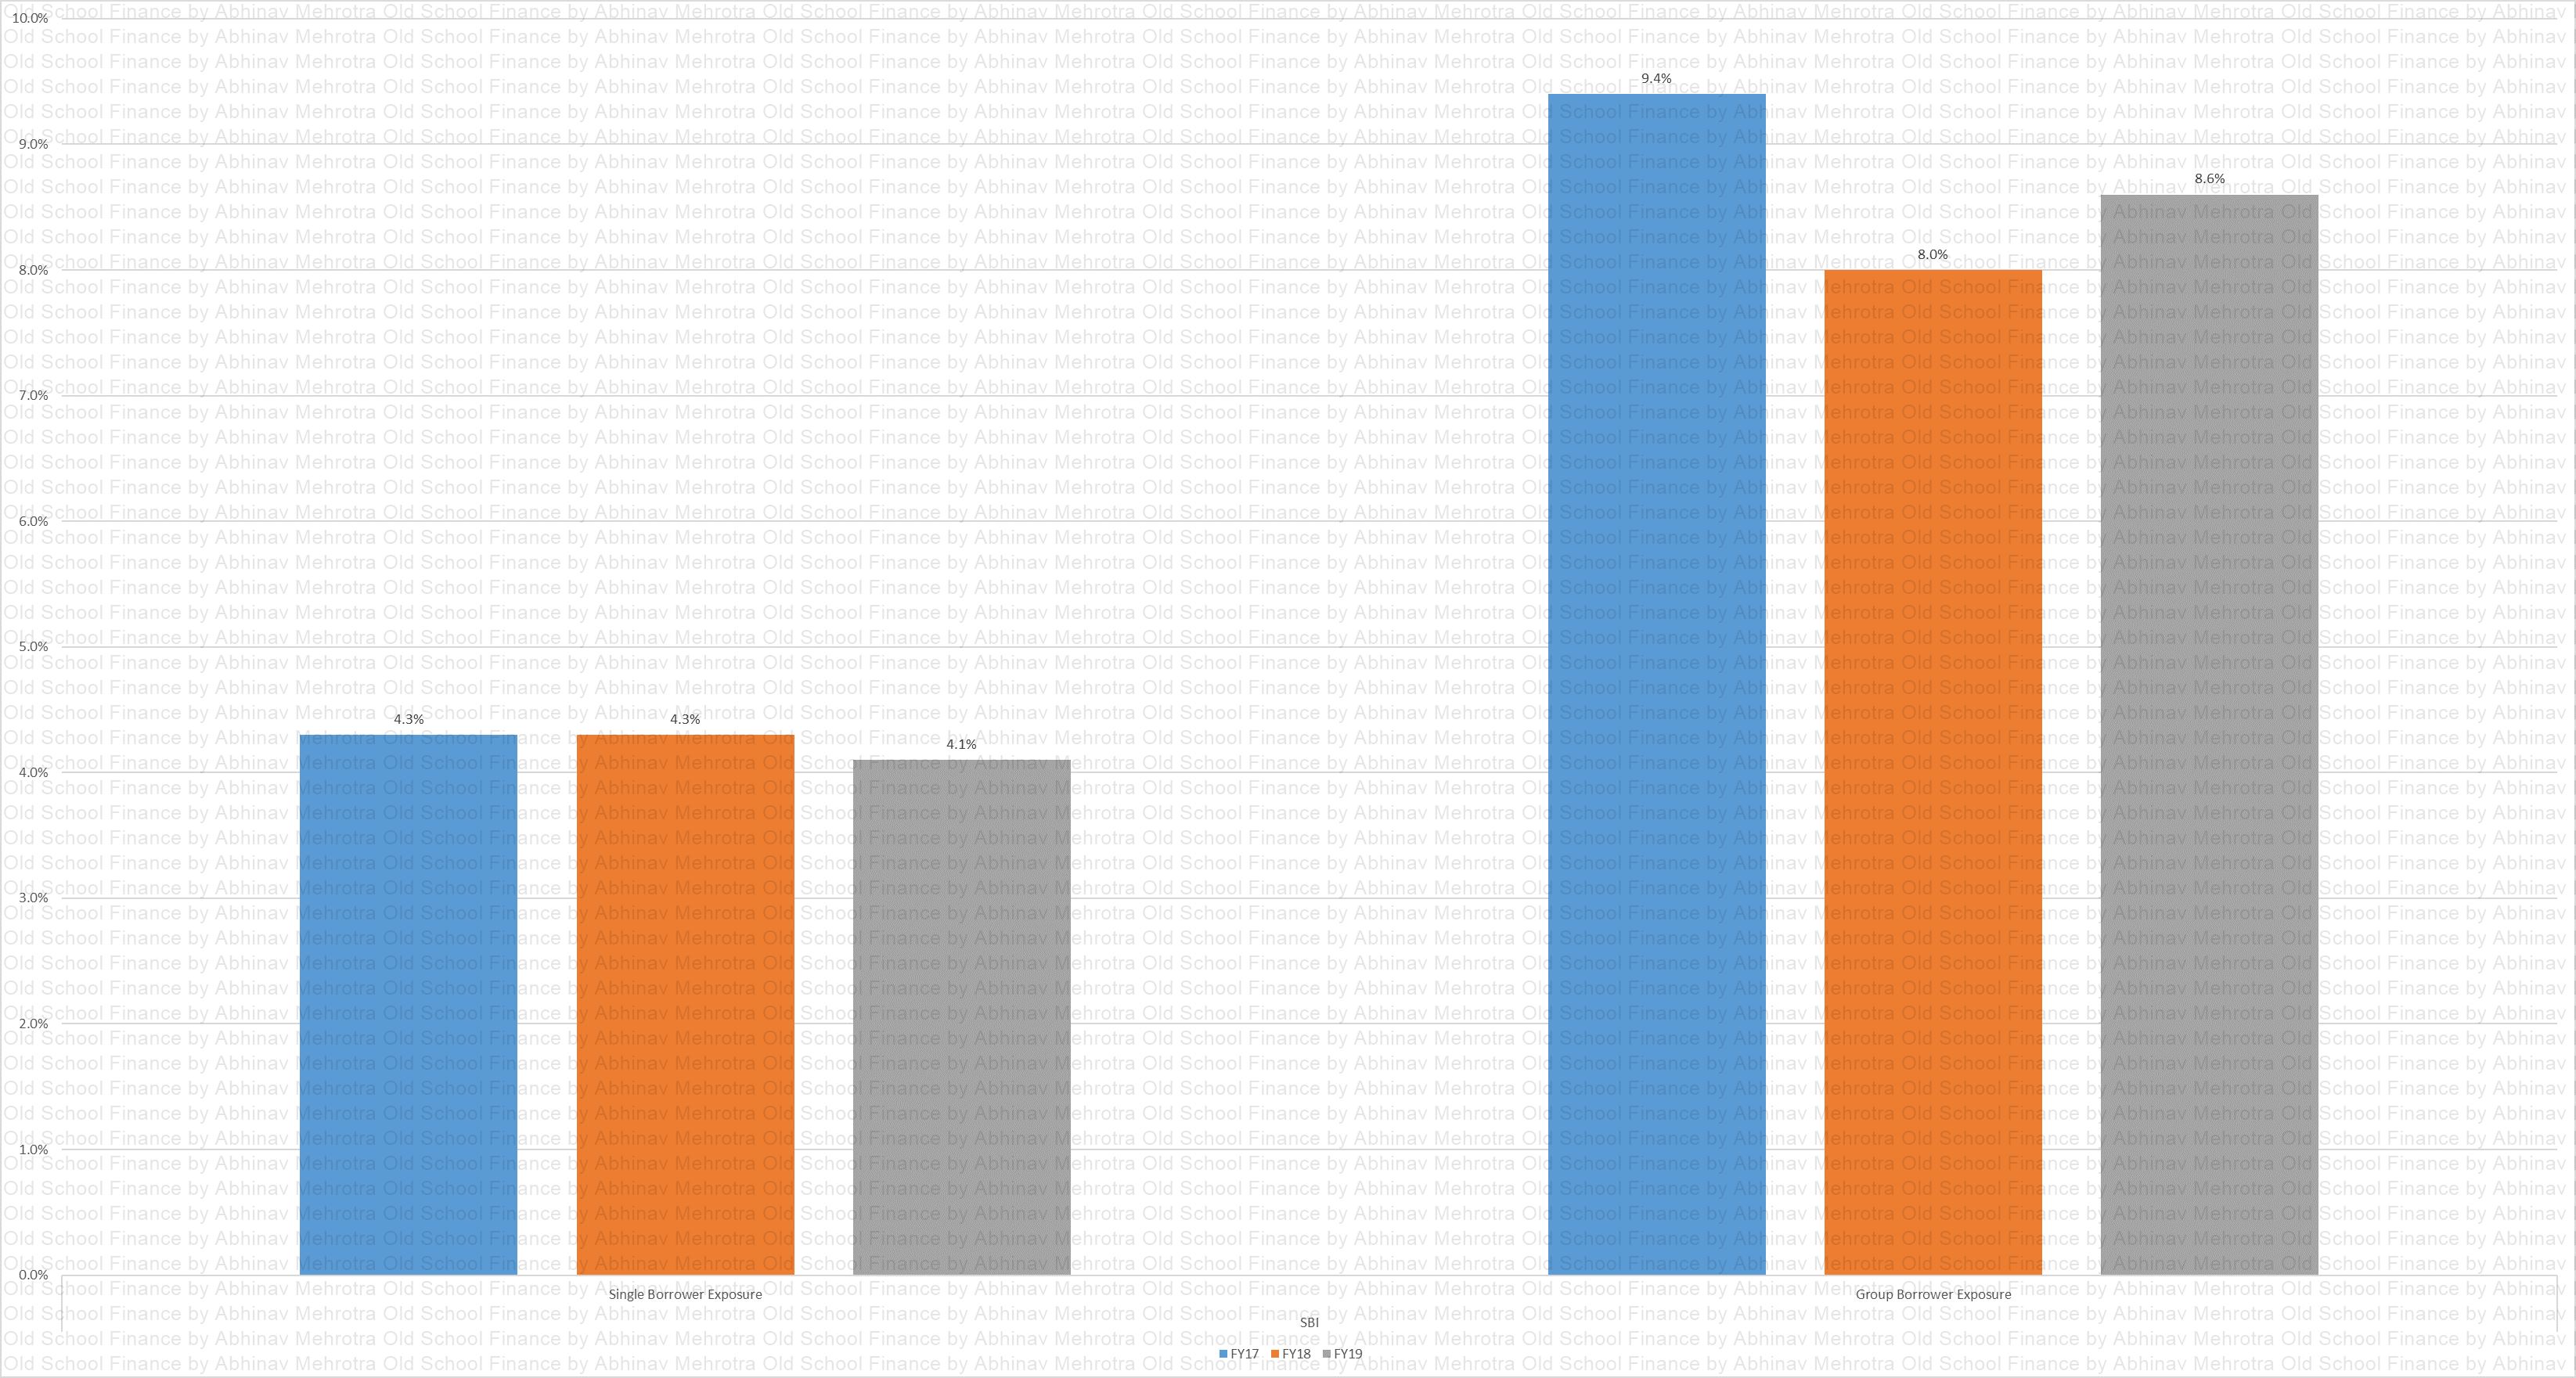
Single Borrower Exposure
Chart 50 – Concentration in single borrower appearing in cards business is very surprising. Have discussed more about this at the end.
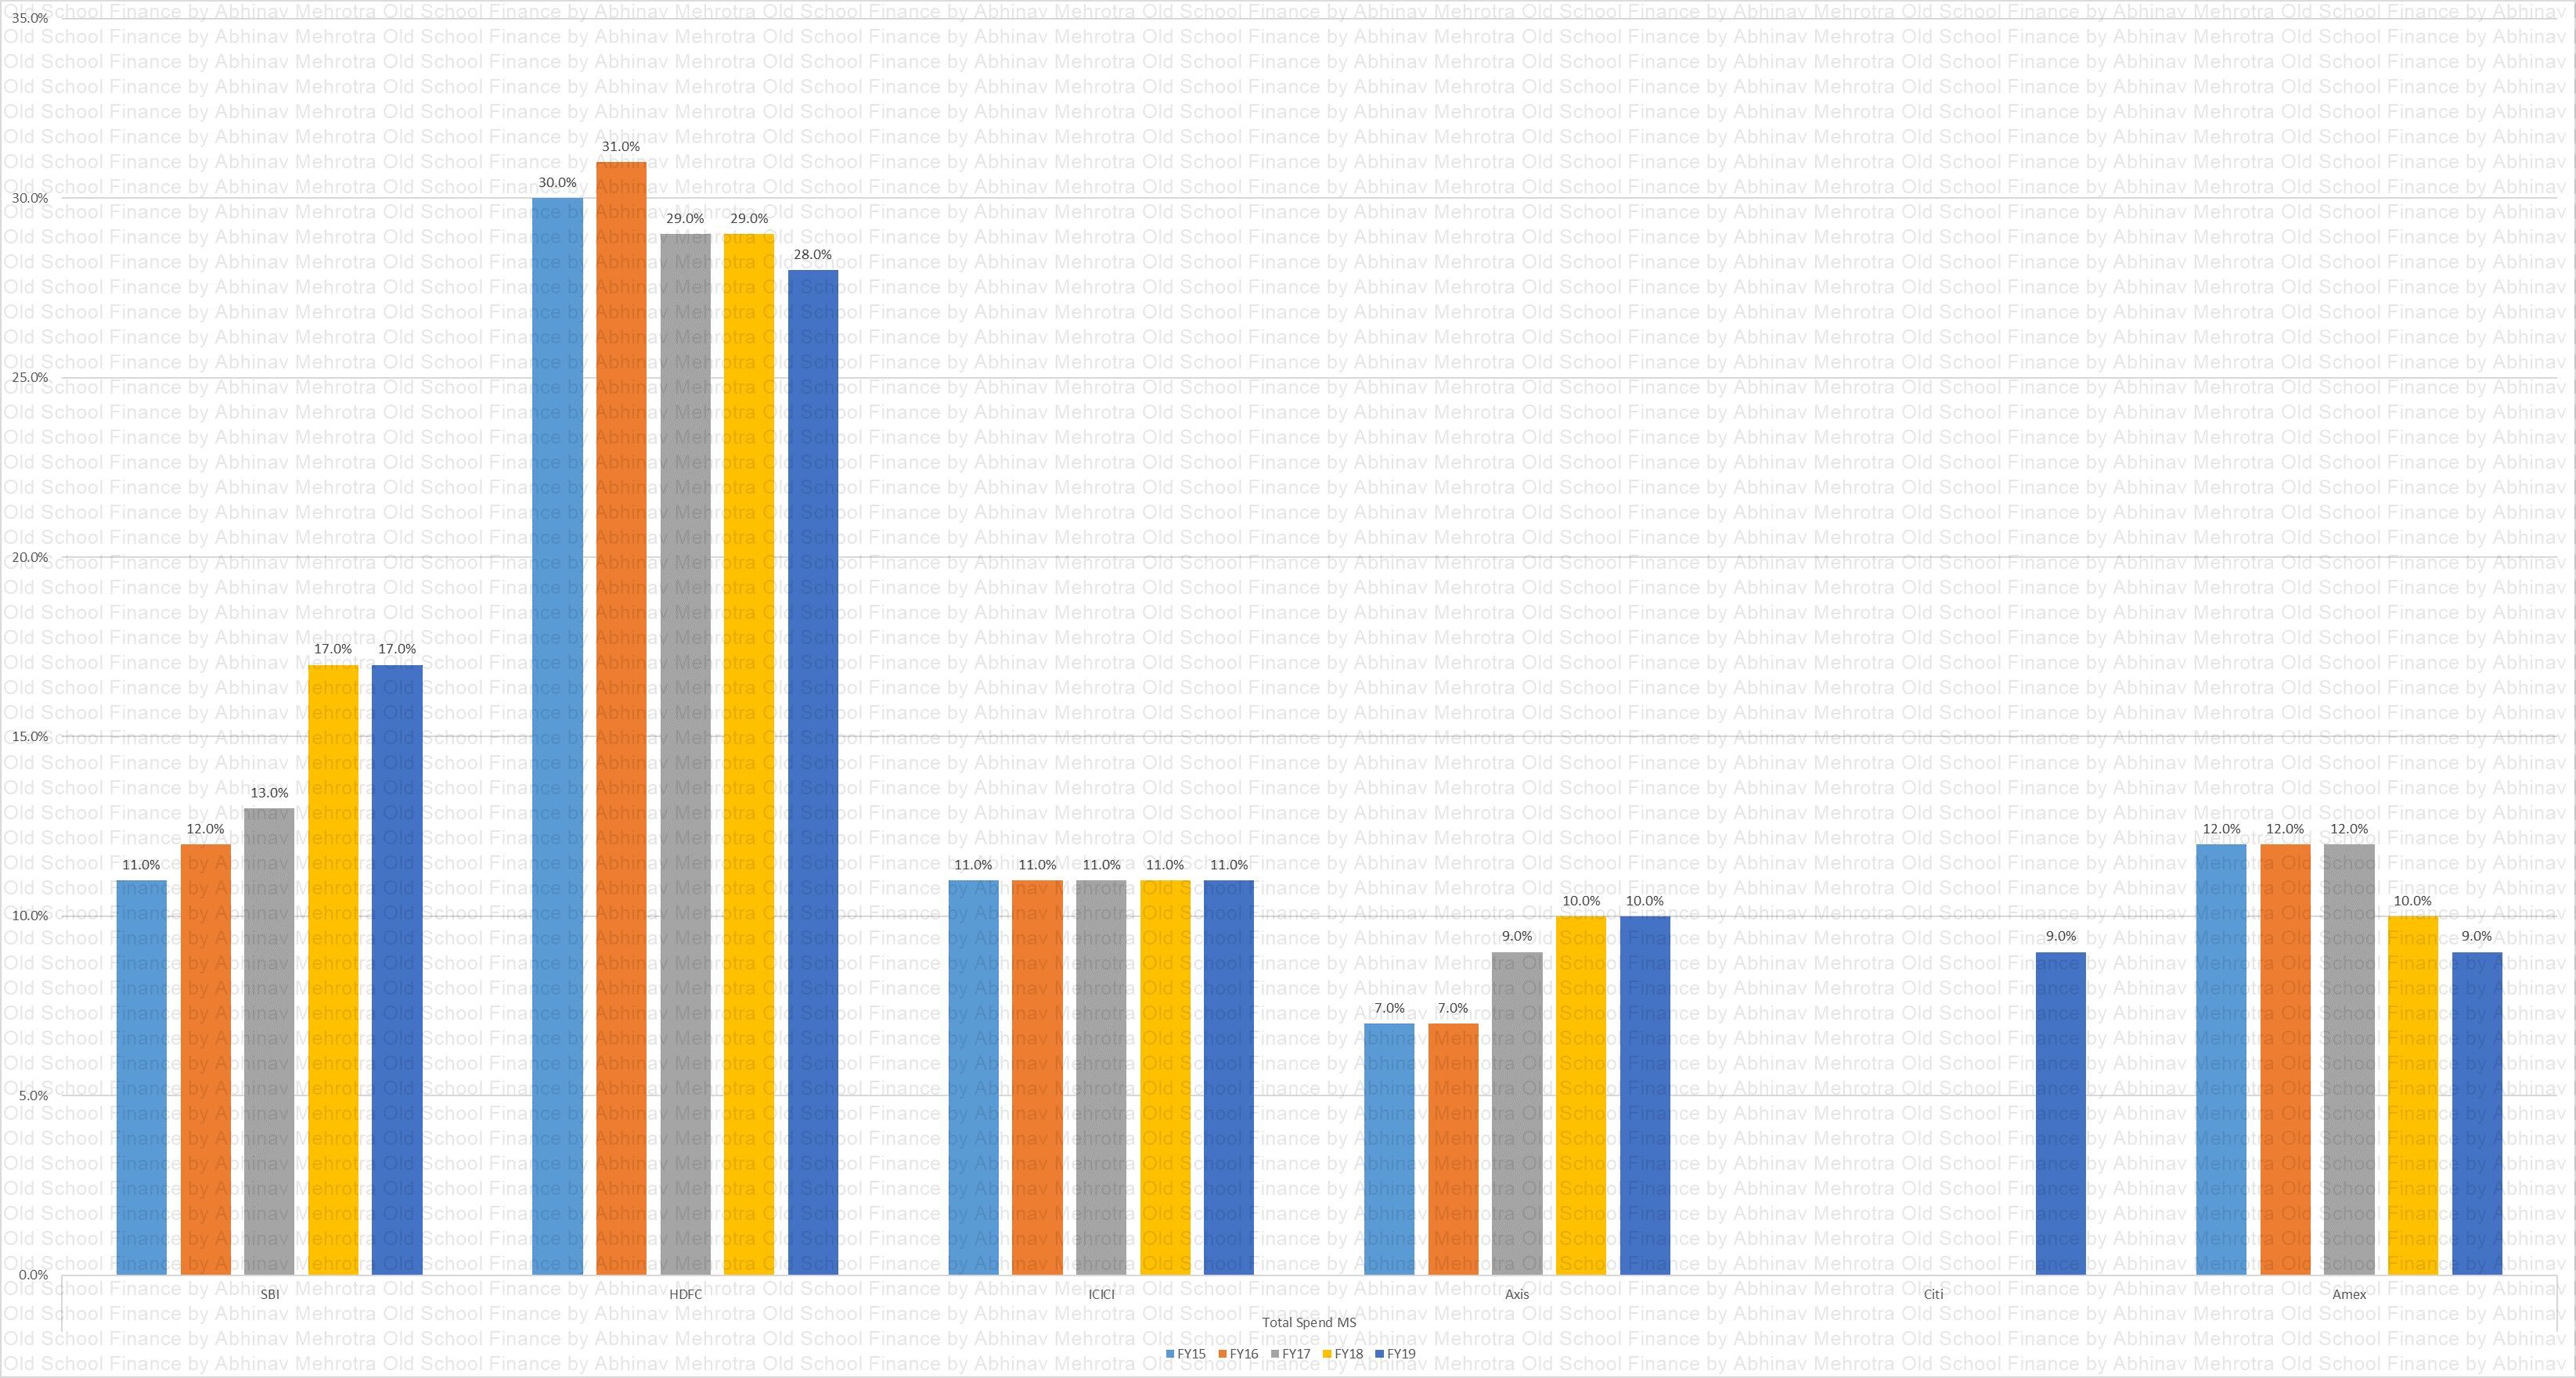
Total Spend MS
Chart 51 – Market share based on total spend. HDFC dominating again.
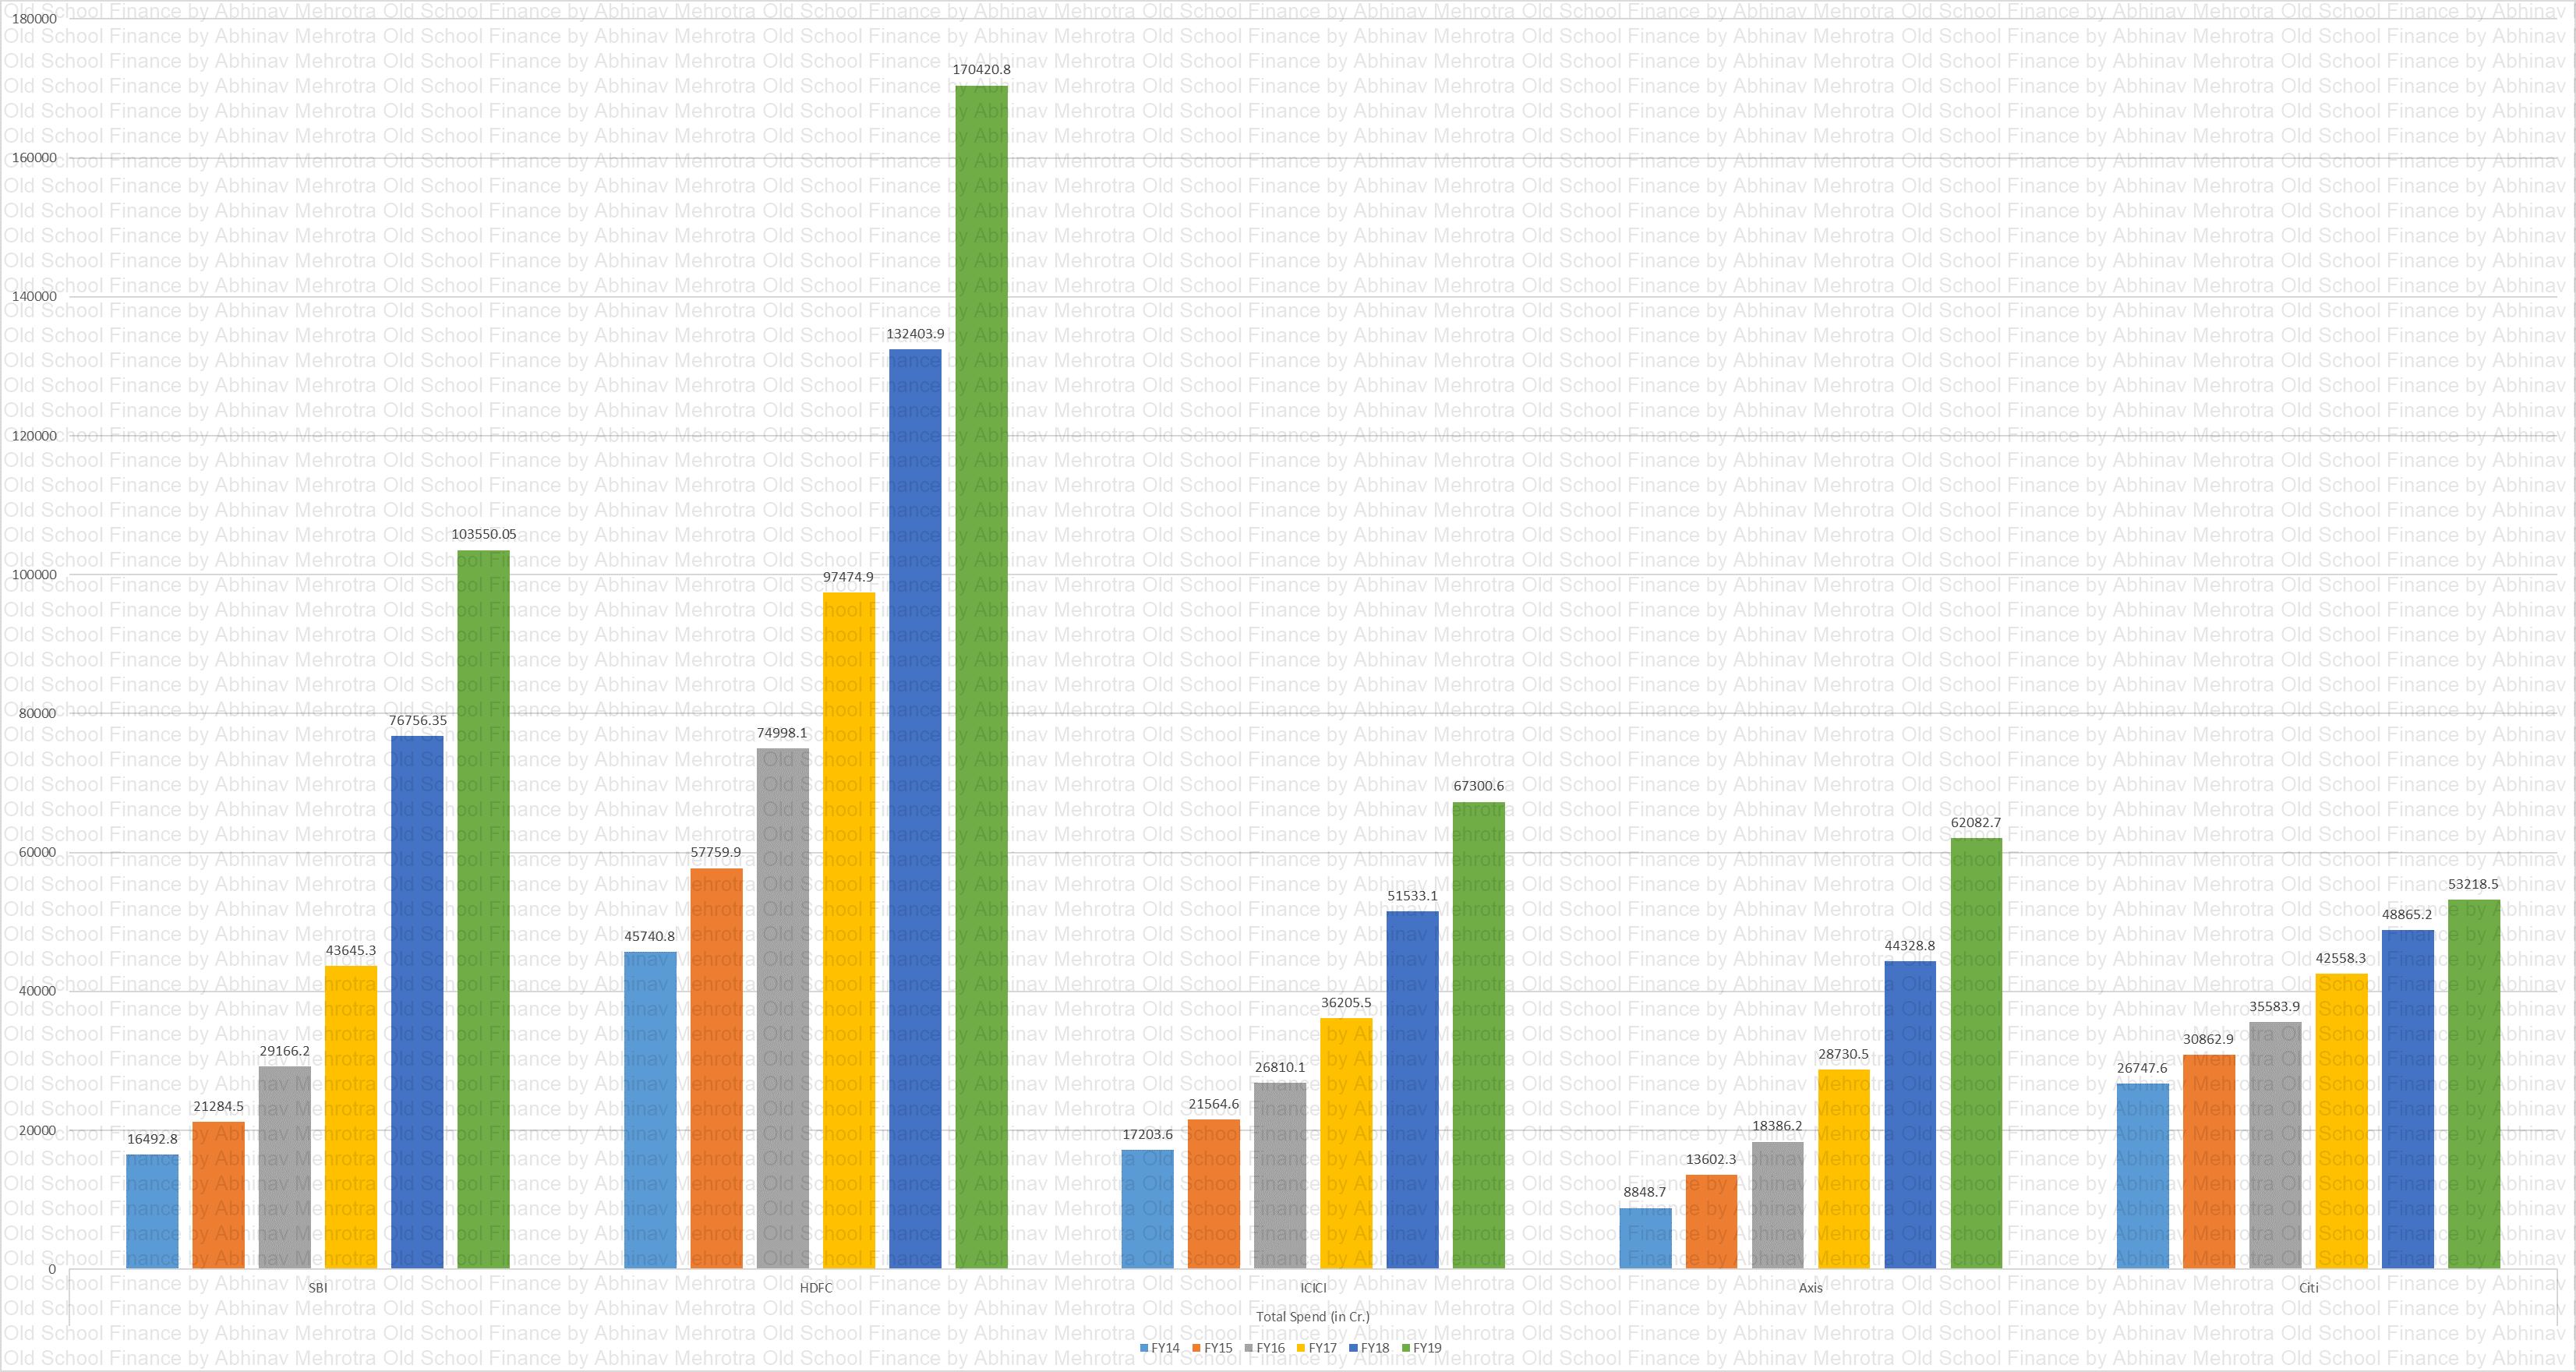
Total Spend
Chart 52 – Total annual spend for the top card issuers. Growth is systemic.
TXN MS
Chart 53 – Market share based on transactions. SBI slowly inching up, HDFC and Citi declining.
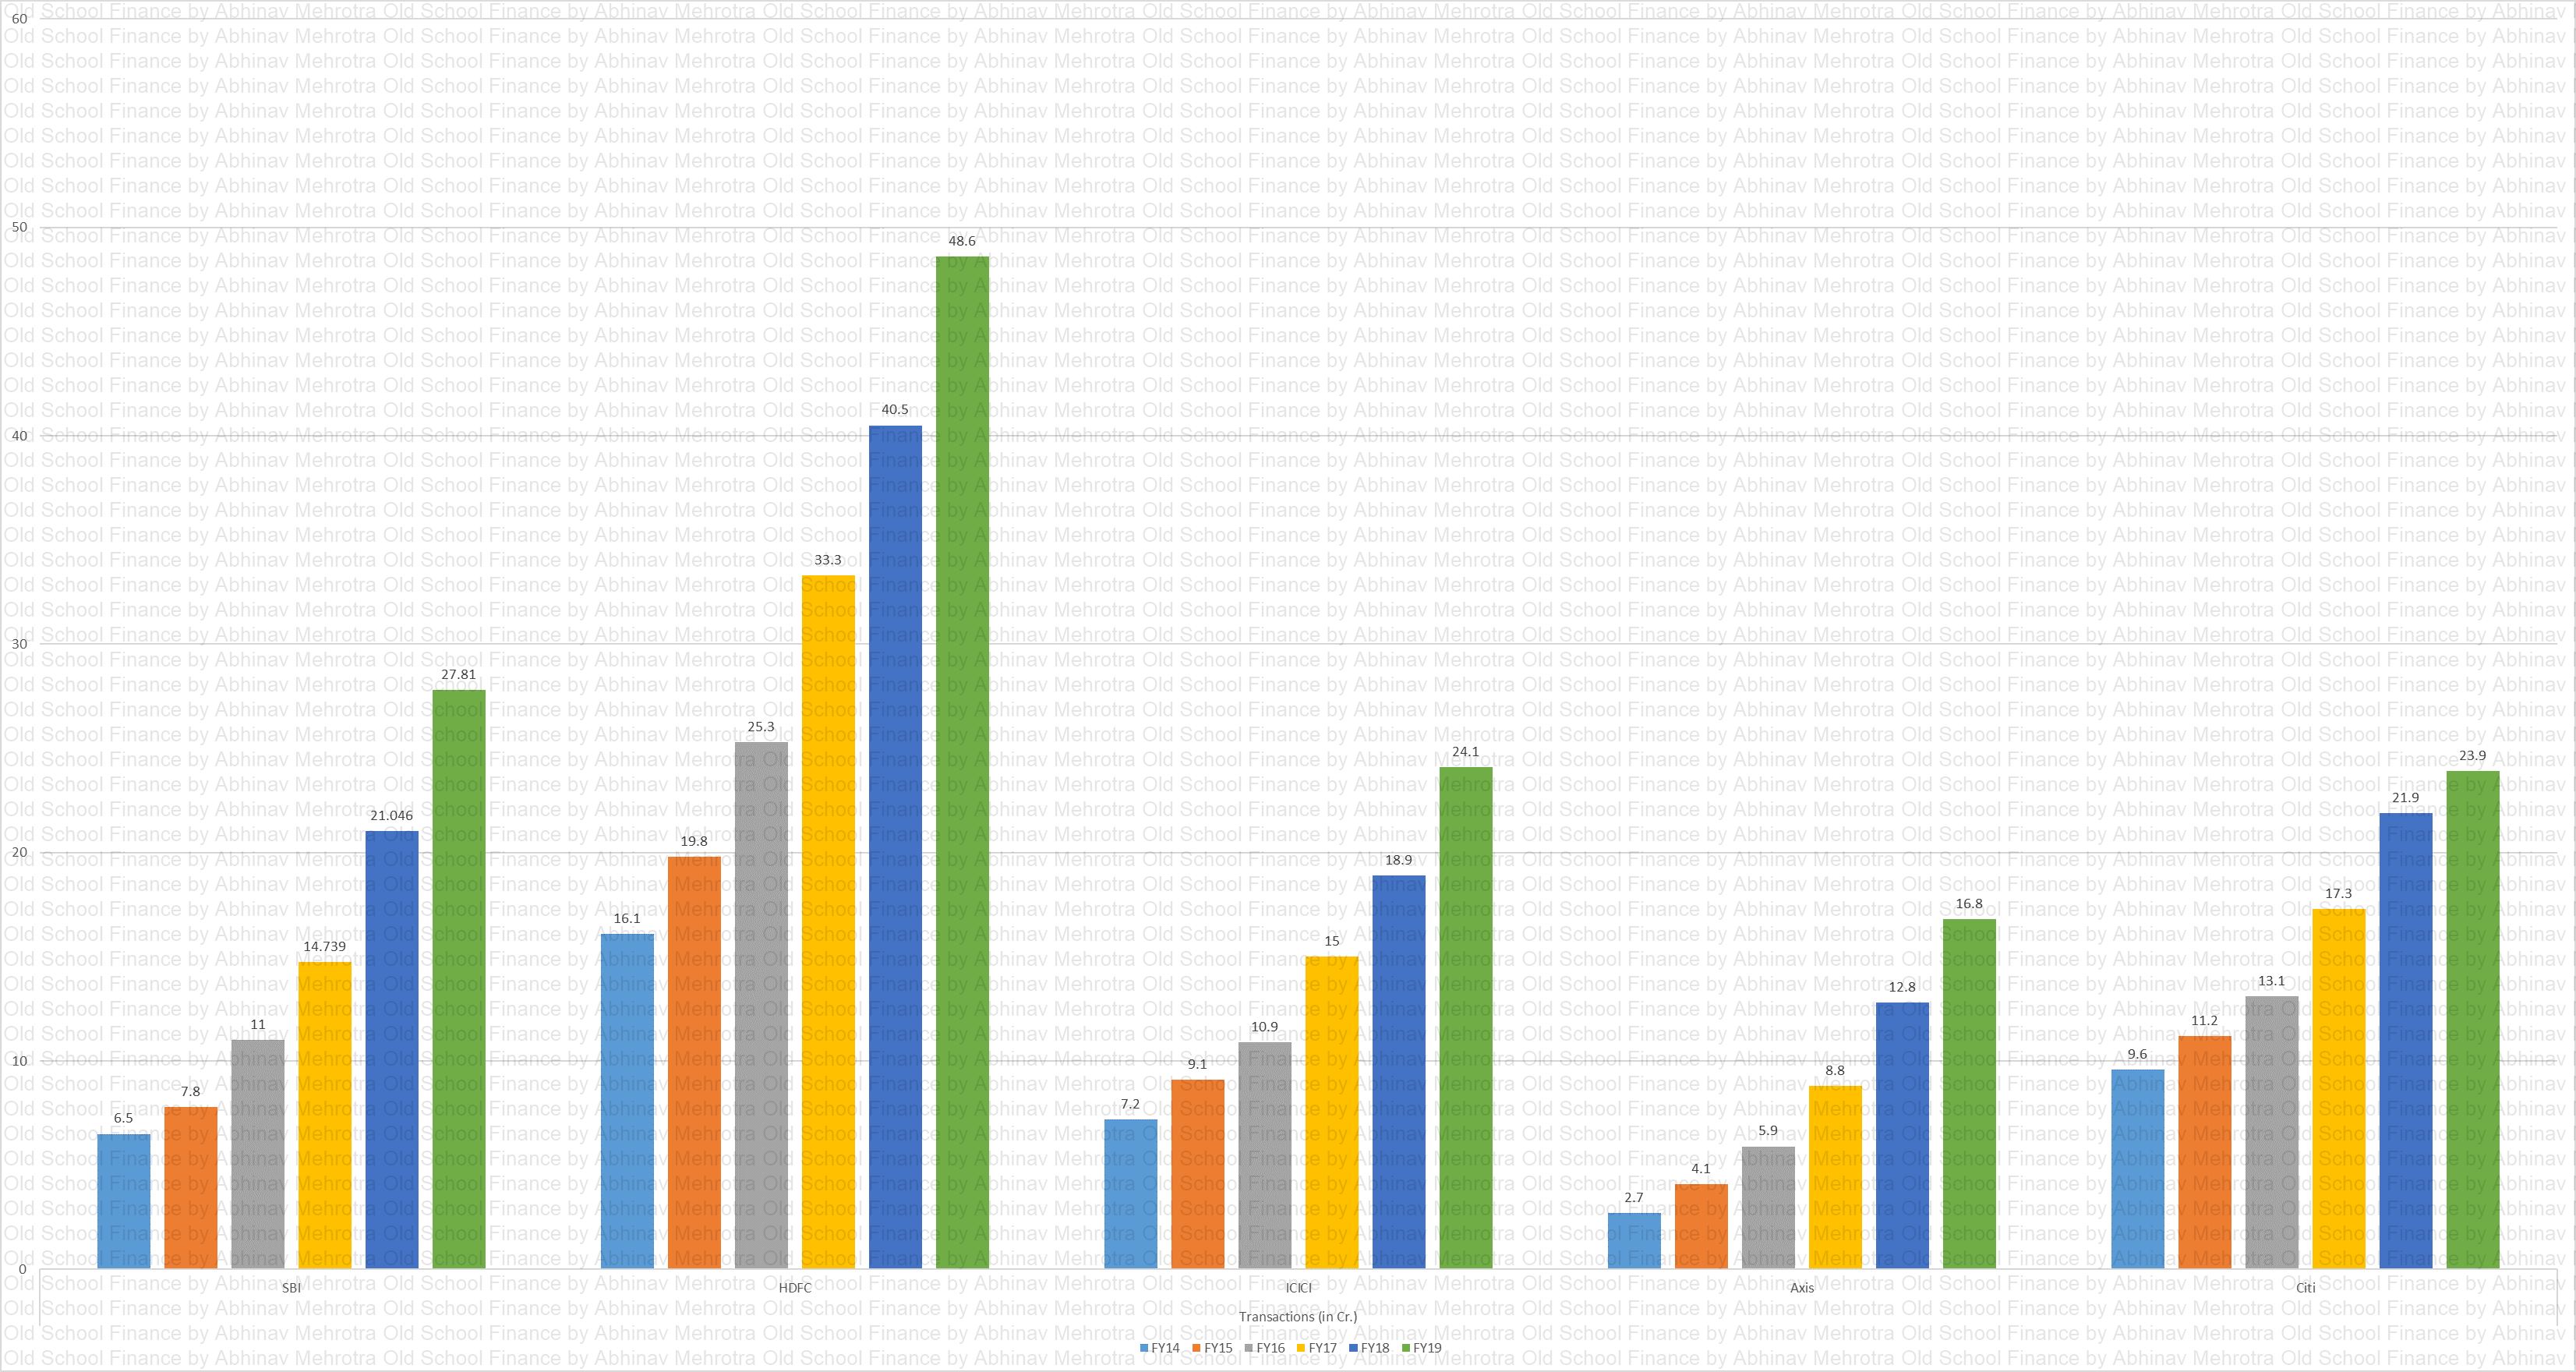
Transactions
Chart 54 – Number of transactions for the top issuers. Growth is systemic.
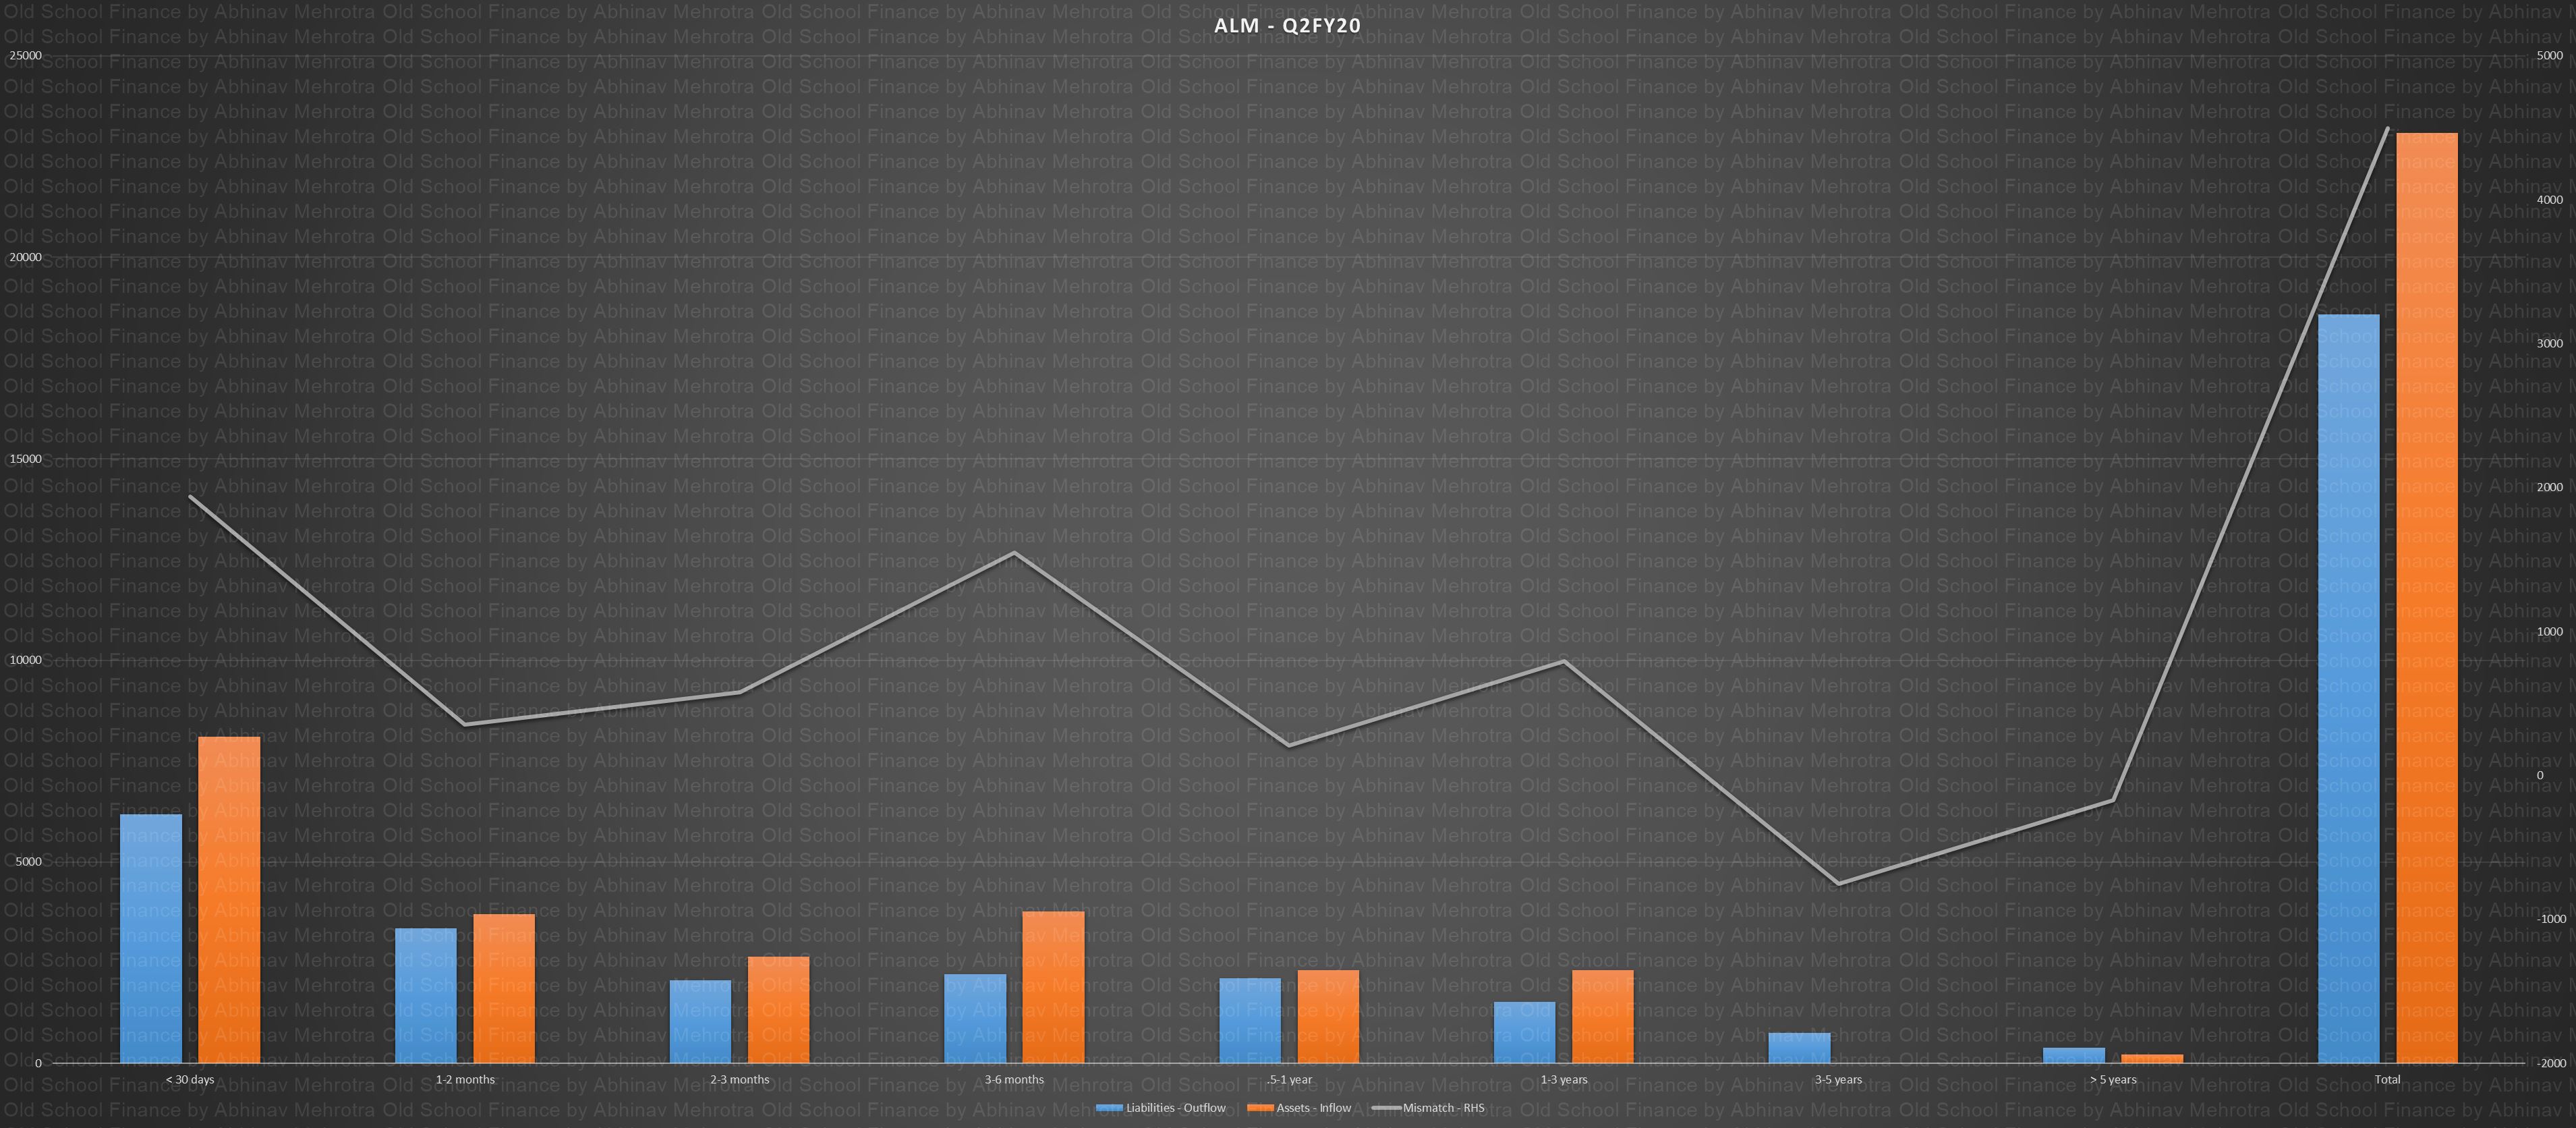
ALM
Chart 55 – Asset Liability Management (ALM) is not a concern since CC as a product has a maximum of 50 days as the interest-free period. Transactions which are converted to EMIs are also short term and are mostly paid off within 2 years. Such short tenures can be easily matched with short term capital sources.
Industry Dynamics
One can pair Chart 3 with CC penetration metrics in India, EMs and DMs to paint a story of structural growth. However, we need to account for the following developments as well, in China, the average spends per capita per year via CC was $2000 a few years back and has dropped to $1300. In the USA it is $ 3000. In India, it is already $ 2000. Comparing the spends it seems like the card issuers have captured the premium market till now, this metric will go down if we grow by acquiring more mass-market customers.
First China regulated the market by not allowing MasterCard, VISA to enter the market. Then Alibaba disrupted the market with QR payments. They are offering credit through QR for anything that you pay for. Alibaba is in India also, Google, FB, were restricted from the Chinese market, will they stay dormant on a market the size of India?
We have 2 contrasting market cases where USA is difficult to disrupt as the CC culture is well entrenched. New forms of payments are not widely or easily adopted there. China, on the other hand, came up with a completely new platform with homegrown companies. India is somewhere in the middle, most of our population is yet to adopt the new techs. The ones who have adopted the old ones have some inertia in changing their platforms.
Whether India will follow the trend of skipping landlines for mobiles in the payments space is the greatest question in the investment thesis for this company? The adoption of UPI is a great case study. India with its young population found it easy to adopt a new platform and the fact that there were no transaction charges helped a lot.
So the risk of disruption from new platforms like wallets, EMI on DC, is real. India is quick to adopt new platforms if they offer convenience and save a few bucks. It is all about which platform the newly acquired customer is introduced to. Just as brands see their power weakening in the age of the internet, as younger generations replace the older ones the inertia for new adoption is much less.
That being said, card issuers are cognizant of the fact that platforms for credit distribution could easily jump from plastic to smartphones and thus are introducing CC that is stored digitally and has tap to pay capabilities. Essentially, what we need to remind ourself of is that the card issuers core business model is that of providing credit, rewards, and interest-free period. Plastic cards are just the platform on which this is facilitated. If the platform shifts to smartphones in the form of wallets or virtual cards the card issuer could change the delivery platform of their business.
The other question to ask is what is so special about providing credit with interest-free period to customers. Anyone with deep enough pockets and regulatory approval can do the same. Money lending by itself is a commodity business after all. Well, this is where banks who are also card issuers have the advantage. They sit on a gold mine of customer data, they can easily, efficiently and cheaply acquire customers. Cards business is just another vertical which is a value add to help deepen the relationship with the customer.
SBI Cards being separate from its parents does have limitations on the data it can use from its parent. The customer data cannot be transferred without their consent is what the management shared in an interview. But with data privacy and protection almost non-existent in India, I am not fully convinced whether SBI cards does or does not have full access to its parent’s customer data.
New entrants without customer data, could be limited to their niches. The wallet operators do have the wallet transaction behaviour but the customer relationships are relatively new, the spends are frequent but small. Whether that is enough to give them the edge in India, as Alibaba witnessed in China is what remains to be seen.
Regulations also play a key role here, the wallet operators have been limited to payments banks here in India. If RBI allows them to become full-fledged banks they could easily give good competition to other payment facilitators.
Key Monitorables:
- Growth – With aggressive growth for the IPO, we will need to monitor the steady-state growth rate of the business post-IPO. Growth in Revenue, PPOP, PAT, Loan Book, customers accounts etc. is a must-watch at current valuations.
- Underwriting – NPAs, PCR, Credit Costs can easily deteriorate with a fast-growing loan book and lax underwriting norms. Any deterioration in these figures is a cause for concern. Client concentration is another monitorable, I know this doesn’t make sense in a credit card issuer company which has loads of granularity in its loan book but as I have shared in one of the charts above client concentration has already appeared in the loan book. The management has internal controls limiting single borrower exposure to 200 cr and 15% of net worth, and group exposure to 25% of net worth. Both figures are not encouraging.
- Customer Profile – Average Spend per Transaction, Average Outstanding per Card, Income per Card, New to Credit, Corporate Cards, active cards/customers, Salaried vs self-employed etc. are a few metrics we can monitor to judge the changing customer profile. A share of premium customers is better as they will spend more, might also have a propensity to let go of rewards due to time constraints.
- Efficiency – OPEX, Employee Expense, Promotion Spend, Rewards Expense, Cost to Income, NIMs etc. need to be watched to ensure that the management is not facing stiff competition. In a tough competitive market, these spends would go up to acquire customers. CAC (customer acquisition costs) are real in this industry.
- Market Share – While the management has been charging ahead gaining market share for the past few years, which is easy to do in the lending business, the real test is performing well across a full business cycle without deteriorating the quality of the loan book.
- Business Cycle – The last downturn of 2008 was not kind to the company, with the retained earning going negative until FY14.
Red Flags:
- Royalty – The company pays its parent 2% of PAT or 0.22% of revenue, whichever is higher, as royalty. As Mr Kiran D points out in a twitter thread, the parent SBI has a similar royalty structure with its subsidiary SBI Life Insurance, however, there is an annual limit of 30 cr on the royalty payments. No such limit exists here. Why the step-brotherly treatment despite Carlyle being on the board?
- “Effective from April 1, 2018, SBIBPMSL, amalgamated into our Company. Our Restated Financial Statements for Fiscal 2018 have been restated as if that merger had occurred on December 15, 2017”. SBIBPMSL was providing back end payment processing and services to SBI Cards. What is interesting is the date of amalgamation. “The Scheme of Amalgamation was approved by the NCLT, Delhi pursuant to its order dated June 4, 2019. The Scheme of Amalgamation became effective on June 14, 2019, which is the date on which it was filed with the RoC.” Share exchange ratio for this entity was quite strange 1:4.04 and 9.5 cr equity shares got added to SBI Cards entity. Of course, the management will call this unit as ‘strategic’ to the company & hence the merger. But this entity is usually like any other 3rd party processor.
- The DRHP was filed on Nov 26,2019. However, very strangely, there is this line “Bank Distribution Agreement dated November 20,2019 between SBI and the Company”. I mean, a new agreement just 6 days before DRHP. This is for SBI cards to use some part of SBI branch facilities “Pursuant to the Bank Distribution Agreement, the Company is required to pay a commission to SBI at rates mutually agreed between the Company and SBI.” No percentage rates are given, but hope standard rates will apply. Just very strange that they had to sign on Nov 20 and not earlier.
- The spend-based fees (interchange) increased by 40% between H1 2018 (712 cr) to H1 2019 (997 cr). Why such a drastic increase, apart from increase in no. of cards? Well, “total credit card spends and changes in industry-level interchange fee billing arrangements among the payment networks, acquirers & credit card issuers in India, which resulted in a more favourable interchange fee structure”. I can’t find any public info around this. So, a 35% increase in the number of credit cards (not of all which might be active) and a 40% increase in revenue. That’s a pretty steep favourable interchange fee structure. Would be good to probe the mgmt on this when they have their Analyst meets & see on what basis is this so favourable.
- Other income bumped up by 161 cr (which works to 120 cr PAT) in FY19. What constituted such huge other income? “primarily due to a revision in our actuarial valuations for reward point redemptions and expiry rates estimates”. Discount by 120 cr PAT as one-time Impairment & bad debt losses moved from 525 cr to 725 cr, a 40% jump. But why? “921.4 million accelerated write-off in H1 FY20 as a result of financial difficulties faced by one of our corporate customers”. Whoa. Back up, back up. What ‘corporate customers’? We thought it was retail.
- A 54 cr business development incentive income. And what’s that? “which resulted in us meeting our incentive targets under our business development incentive agreements with the payment networks.” Just to be aware of different levers and one-times and recurring of revenue segment.
- On bad debts “3,361.35 million, or 56.2%, increase in bad debts written off resulting from higher credit stress in certain portfolio segments observed in fiscal 2018”. Just the start, do you think?
Chart Repository –
Sources:
- IPO Document.
- Various Research Reports.
- Investor Presentations.
- https://twitter.com/_kirand/status/1201828124129775622?s=03
Blogpost: SBI Cards & Payment Services – Charting through History | oldschoolfinance