I am initiating a thread on SBI Cards. The company has filed a DRHP with SEBI and is expected to come out with its IPO. This is an attempt to simplify the DRHP to better understand the details of the business. Since SBI Cards is a pure play on credit cards business the DRHP has interesting insights on unsecured lending business in India and growth going forward. I have tried to put some of this forward through this note.
SBI Cards
Company Background
SBI Cards was launched in October 1998 by the State Bank of India & GE Capital. It is incorporated as SBI Cards and Payment Services Limited when it turned from a Private Limited Company to a Public Limited Company in August 2019.
In December 2017, State Bank of India and the Carlyle Group acquired GE Capital’s stake in the company.
SBI Cards has over 9 million credit card customers and it aims to offer customers access to value added payment products and services. As on Sep 2019, the company had 9.46 million credit cards outstanding with total spends of Rs 1.03 trillion.
The company has an outsourced workforce of 33,086 sales personnel deployed out of 133 cities engaging with customers across multiple channels. In addition to this the company uses SBI’s network of 22,007 branches to market its cards to its customer base of 436.4 million.
Business Model
The company primarily earns revenue from two ways
- Interest charged on credit card receivables
- Fee income including interchange fees, annual fees, late fees and service fees
Let’s first understand how a credit card transaction works…
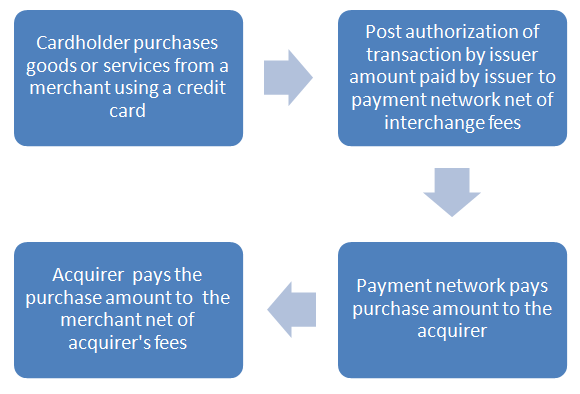
Revenue Model
Interest Income
Interest income is earned on revolving balances as well as equated monthly instalment balance. The total interest income earned is a function of both volume of receivable and yield earned on the outstanding balance. The aggregate amount of credit card receivable is a function of:
- Size of customer base
- Customer spending on credit card
- Customer repayment rates &
- Charge offs on the balance
The credit card receivable portfolio is viewed under three categories :
- Revolver receivables : Balances carried off from one month to the next and consequently accrue interest charges. Higher revolver receivable lead to higher interest income
- Transactor receivables : Balances which are paid off in full at the end of every month and don’t incur any interest charges. Also higher transactor receivables lead to lower interest income and positively affects NPA rates and charge offs
- Term loan receivables : Comprise of equated monthly instalment balance which has an interest component but lower than revolver receivables
Non-interest income
Non-interest income is earned primarily through fee income which includes
- Interchange fee: Primarily a function of credit card spends and earned when transactions are carried out by cardholders
- Subscription fees: Function of annual fees charged to cardholder
Instance based fee: Primarily a function of number of cardholders outstanding and charged via late fees, over limit fees, etc
Service charges
Service charges broadly comprise commission from selling third party products, share of accelerated rewards point cost recovered from partners, brand association fees charged to partners and transaction revenue from aggregators
Business development incentive income
This comprises of contractual business development incentives that the company earns from payment networks under long term contracts
Insurance commission income
This is comprised of the commissions/incentives earned as a corporate insurance agent in selling insurance products to cardholders
Here is a breakup of the operating income for the year 2019 & 2018 to understand which segment contributes how much to the total operating income of the company.
Operating income breakup
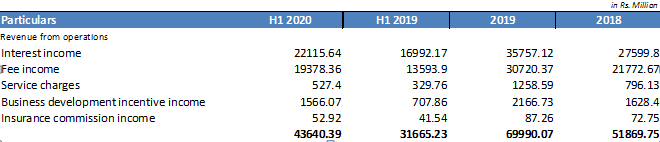
As we can see as on FY19, 51% of total revenues were interest income while 43% of revenues were via fee income.
Operational Overview
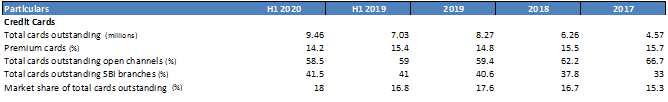
The company is the second largest credit card issuer in India with 18% market share in terms of number of credit cards outstanding as on September 2019 and 17.9% market share in terms of credit card spends as on September 2019.
Credit cards outstanding
In the illustration below we can see how the company has grown over the last three years in terms of number of cards outstanding and the market share. As we can see the role of SBI in the sourcing of new cards have been increasing over the years
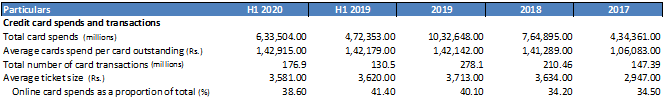
Credit card spends
The total credit card spends is a function of number of cards outstanding as well as spends per card. As we can see in the illustration below the average spends per card has remained stagnant at a similar level while the increase in total spends have been entirely driven by increase in number of cards outstanding. Of the total spends online transactions continue to be less than 40% currently
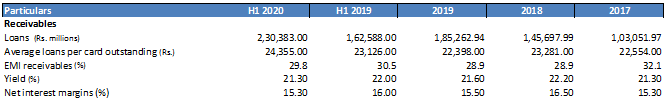
Loan matrix
The loan book as on H1 2020 stands at approximately Rs 23,000 crores.
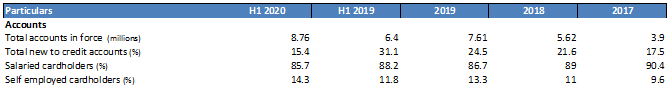
Borrower profile
As we can see in the illustration below the proportion of salaried cardholders has been declining sequentially over the last three years. This explains that a major proportion of the new accounts of credit card holders are being sourced from self employed people. Though this might seem a riskier strategy firsthand card companies also ask for a fixed deposit in its parent bank against which a credit limit is provided to the cardholders. Since SBI Cards is a NBFC this must not be a case with the company.
Co branding
Co branding in credit cards is a meaningful share of total business for any credit card issuer. Let’s understand how a typical co branding agreement works.
- Credit card issuers enter into fixed (3-5 years) agreement with different brands
- Agreements terminate upon expiry if not renewed
- Brands provide rewards or loyalty points for customers with a specific credit card
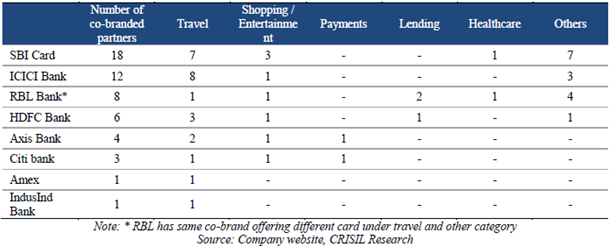
For SBI Cards, co branding business for year ended March 2019 represented 19.3% of total credit card spends. Also newly sourced co brand accounts represented 29.6% of total credit card accounts sourced as on March 2019.
Here is an overview of the offerings of credit card issuers in terms of various offers and co branding partnerships
Capital Adequacy
As a non deposit taking NBFC SBI Cards is required to maintain capital adequacy as per prescribed norms. As per norms of RBI, capital to risk ratio (comprising of Tier 1 & 2 capital) should not be less than 15% of aggregate risk weighted assets on balance sheet. The tier 1 capital at any point of time should not be less than 10%.
As on September 2019 the Tier 1 Capital stood at 14.8% and capital to risk ratio stood at 19%
IPO Summary
The company is jointly owned by SBI & Carlyle Group (through CA Rover Holdings). The holdings of Carlyle Group were earlier held by GE Capital. However GE Capital had sold its entire shareholding in the company to Carlyle Group on December 15th 2017
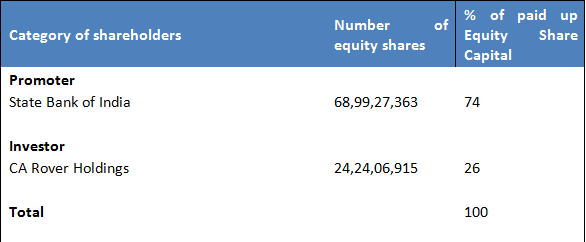
The company is coming out with an IPO comprising:
- Fresh issue: Rs 500 crores
- Offer for sale:
- SBI: 37,293,371 shares
- CA Rover Holdings: 93,233,427 shares
Promoters
Agreement with promoters
The company currently uses the SBI Logo as a part of a licensing agreement between the company and its promoter under which the promoter has allowed non exclusive right to the company to use the brand name “SBI” on its cards portfolio pursuant to payment of royalty fees. Also under this agreement the promoter has the right to terminate the agreement on occurrence of certain events which include promoter share falling below 26% or if the company fails to pay royalty fees to the promoters.
Under the bank distribution agreement, the company provides branch relationship executives at select branches of SBI. Also, SBI has agreed to provide referrals of customer via business analytics for a commission to be paid to SBI
Risks
The business faces two risks in its operations which can derail the operations significantly:
- Credit Risk
- Regulatory risk
Credit Risk
Since the company is into unsecured lending there is no recourse in case of customer non payment. Though the company uses data from agencies like CIBIL which maintain credit history to analyse repayment capacity of borrowers in case of a system wide repayment issues the company doesn’t has any asset for recourse.
Regulatory risk
Interchange fees, which in India are set by payment networks like Mastercard & Visa if are subject to a regulatory cap by the RBI could in future reduce the income that credit card companies could earn through this fee.
In India interchange fees on debit card transactions have already been set to a limit by the RBI and any further action on credit card transactions could affect the revenues of the company in the future
The company charges interest rates on revolving loans and EMI payments. In case of any regulatory cap on these interest rates the interest income that it earns can be significantly affected
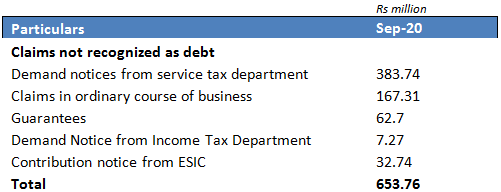
Contingent Liabilities
The contingent liabilities against the company are not a very big amount considering the scale of operations of the company. A summary of the contingent liabilities against the company is presented below
Conflict of interest
- SBI & other banks have started offering EMI payments on debit card transactions as well. This will affect the business of credit card companies as a similar line of service is available in a competing product
- SBI CAP Securities which is a group company of SBI is also registered as a corporate agent and would be in similar line of business as SBI Cards
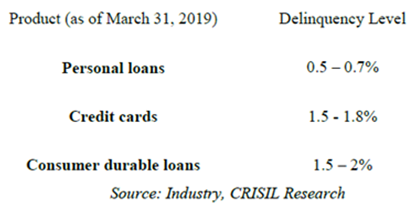
Delinquency levels
Unsecured credit card receivables present a greater credit risk than a portfolio of secured credit card receivables as they are not supported by realizable collateral. Thus there always remains a risk of delinquency of the portfolio in case of non payment by customers. However data over the last three years have presented a stable picture of delinquency levels in the unsecured loan market.
Competitors
Competitive landscape
Credit card is primarily a payment solution which provides users the ability to purchase on credit and then repay the amount either during the interest free period or after that with interest. Since it is a payment solution the industry faces threat from payment solutions offered by other parties including:
- Banks
- Payment Banks
- NBFC’s
- Fintech Companies
- E wallet
- Mobile payments
- Unified Payment Interface (UPI)
Amongst credit card industry in particular the company faces competition from other banks providing credit card services. Credit card services usually compete on the following
- Reward programs
- Loyalty programmes
- Offers
Concentrated market
There are a total of 74 players offering credit cards in India but the top four players including HDFC Bank, SBI Cards, ICICI Bank and Axis Bank have a total market share of 72% in terms of number of outstanding cards and 66% by credit card spends as on March 2019.
Market share of top four players
- HDFC Bank: 27%
- SBI Cards: 18%
- ICICI Bank: 14%
- Axis Bank: 13%
SBI Cards and BOB Cards are the only two companies that are NBFC’s while all other credit card issuers are banks.
Payments landscape
A strong payments infrastructure is one of the most vital points to building an ecommerce ecosystem. There are many companies competing to become the most widely accepted payment solution across the ecommerce basket. Competition is coming from the following sources:
- Amazon Pay & Phone pe (Payment solutions by incumbent ecommerce companies)
- Credit Card companies (All companies are focusing on the ecommerce payments and providing offers to lure customers)
- Wallets (Paytm)
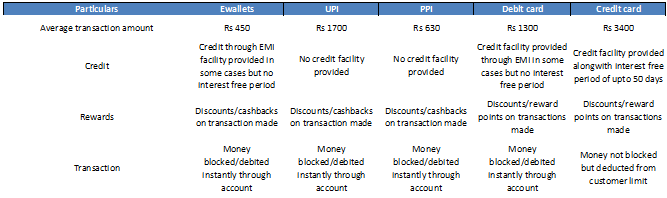
How credit cards stack up against other payment systems
As we can see the one differentiating factor which makes credit card unique against all other payment systems is the credit free period which is not provided by any other payment solution as of now. While UPI has emerged as an alternative to wallets and debit cards due to the credit free period offered and other value added services around a credit card payment system the offering still remains unique.
How technology is helping companies
In FY 2019, 45% of the credit card applications were decisioned by credit decision engines without the involvement of any human intervention. In future measures like these could lead to a big advantage for credit card issuers in terms of saving on personnel costs.
Industry
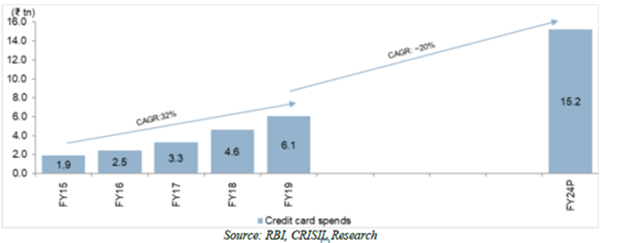
Credit Card spends
The credit card spends have grown at a rate of over 32% over the last five years. The overall market has tripled from Rs 2 trillion to Rs 6 trillion over last four years. This market is expected to grow at a much slower rate of 20% over next five years reaching to a market size of Rs 15.2 trillion.
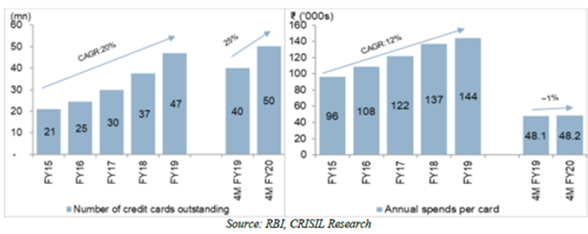
Of the total growth in spends a higher proportion has been driven by increase in number of cards outstanding while annual spends per card has grown at a much slower rate as shown below. The factor that is driving volume growth in number of cards outstanding can be seen in the figure below
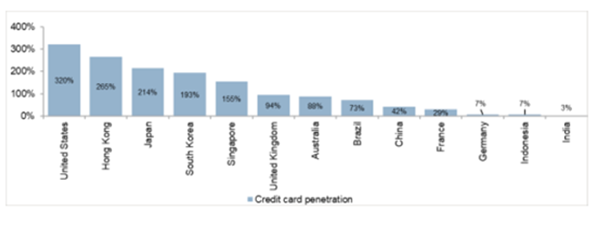
Penetration levels
As we can see the penetration level of credit cards when compared to other economies both developed and developing is very less.
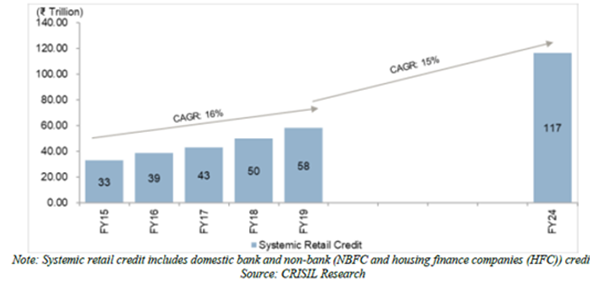
Retail credit
The retail credit market has grown at a CAGR of 16% over 2015-2019. The size of retail credit market as on FY19 stands at Rs 58 trillion and is expected to grow at a CAGR of 15% over the next five years to reach a size of Rs 117 trillion.
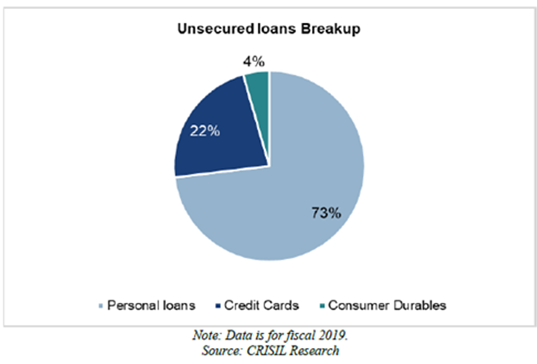
Unsecured loan market
Of the retail credit market the unsecured loan market in FY19 stood at Rs 5.3 trillion (10% of the total). This is expected to grow at a rate of 22% over next five years to reach Rs 14.4 trillion (12% of total).
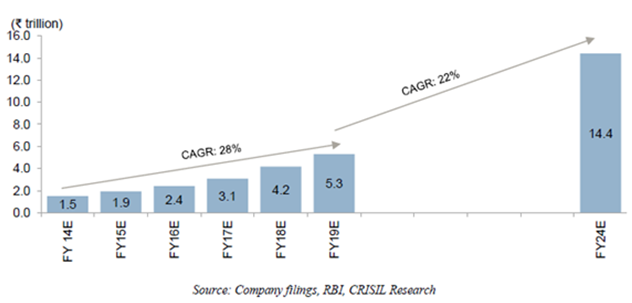
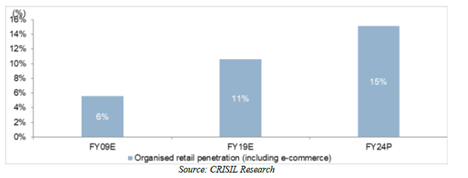
While personal loans form a majority part of the unsecured loan book outstanding, credit cards outstanding is expected to grow at 23% CAGR over the next five years driven by increased issuance in smaller cities, increased organised retail penetration and growth in payments infrastructure.
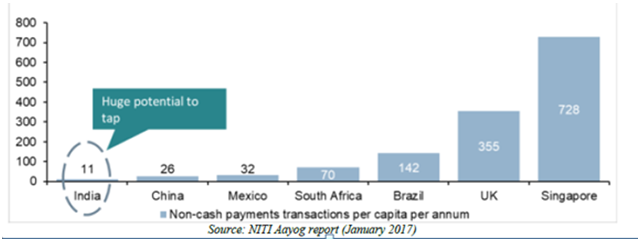
Per capita digital payments penetration
According to a NITI Aayog report(2017), per capita digital transactions are amongst the lowest when compared to peer and developed nations
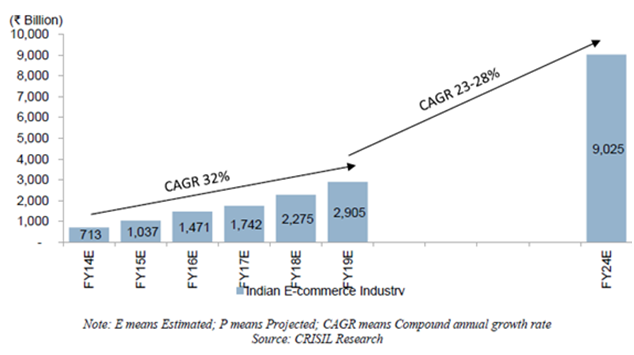
Ecommerce spends
Another interesting thing to look at is the size of ecommerce industry in India and the growth going forward. Digital payments are a direct beneficiary of rising ecommerce transactions. Increasing internet penetration, online shopping and lucrative deals have led to ecommerce industry growing at a CAGR of 32% since FY14 to reach Rs 2.9 trillion in 2019. This is expected to Rs 9 trillion in 2024, growing at a CAGR of 25%.
Growth opportunities
Cash on delivery shifting towards card on delivery
Cash on delivery still accounts for a majority of ecommerce players transaction spends. This presents a problem for ecommerce players for multiple reasons. Companies have introduced card on delivery options to reduce the usage of cash where the customer can pay by swiping their cards on delivery. Since cash payments currently account for over 60% of ecommerce transactions as this market shifts towards card on delivery it could present a huge opportunity for credit card companies
Leveraging the branch network of SBI
The company intends to deepen its partnership with its promoter SBI as the customer base of 436.4 million presents a vast pool of untapped customers. On these lines in October 2017 the company had launched an initiative “Project Shikhar” to market its products directly to SBI customers as a result of which proportion of new accounts sourced from SBI’s existing customer base has increased from 35% in 2017 to 55% in 2019
Increasing penetration of organised retail
Peers
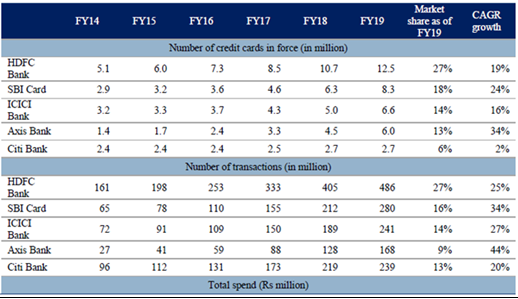
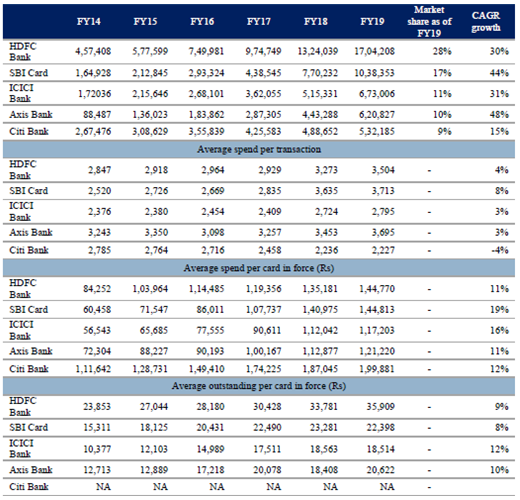
Operating metrics of the peers
The illustrations below show a comparative comparison of the top four companies in the credit card space in terms of market share and growth across various parameters across last five years
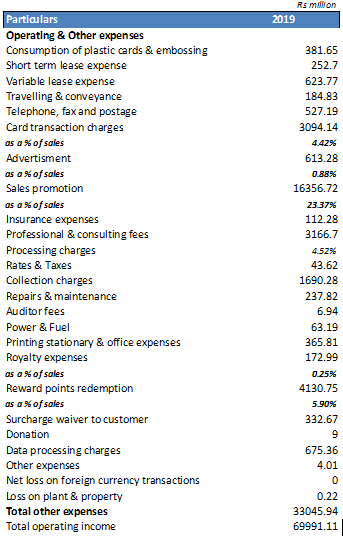
Financials
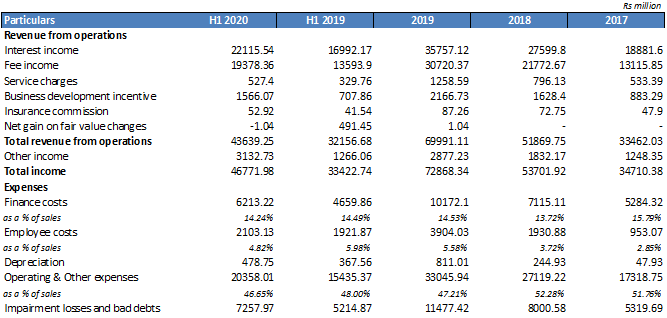
Major expense line schedule
Disclosures: The company shares are not listed and the company has filed DRHP with SEBI for IPO. I do not hold any shares currently.