Thank you for pointing that out @rcinvestor999
Will review the above and update the estimates.
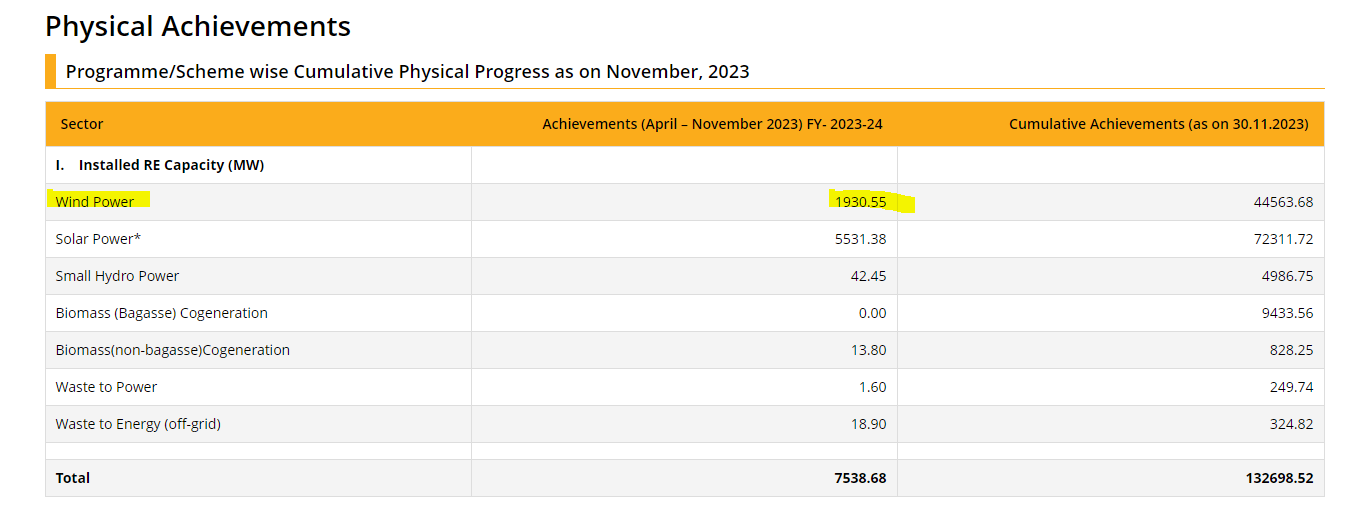
Wind installation picking up pace:
April- June : 1139;
April- July : 1306;
April- August : 1456;
April- September : 1551MW (monsoons)
April - October: 1659
April - November: 1930
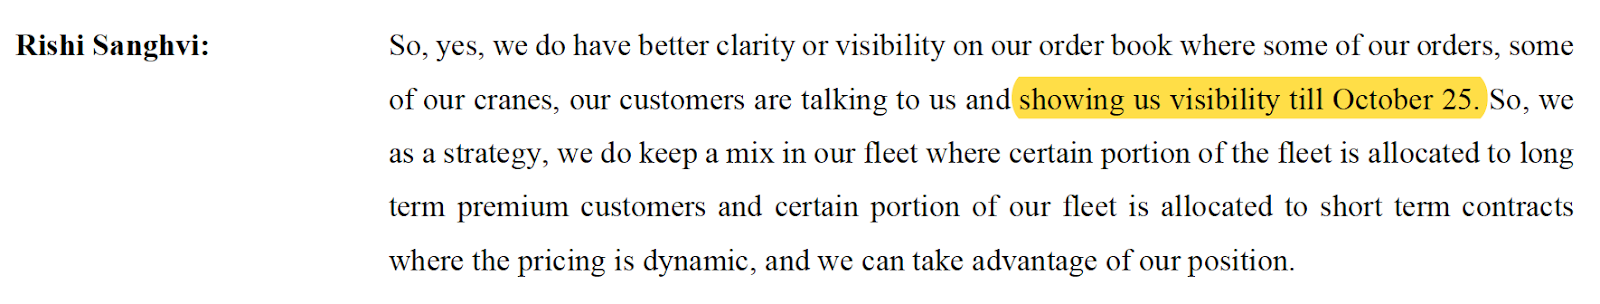
Sanghvi Movers is entering into EPC space, this will open large orders visibility, rightly placed with monopolistic Crane company with right fit into EPC space. Order visibility will be strong till next 5-6 years.
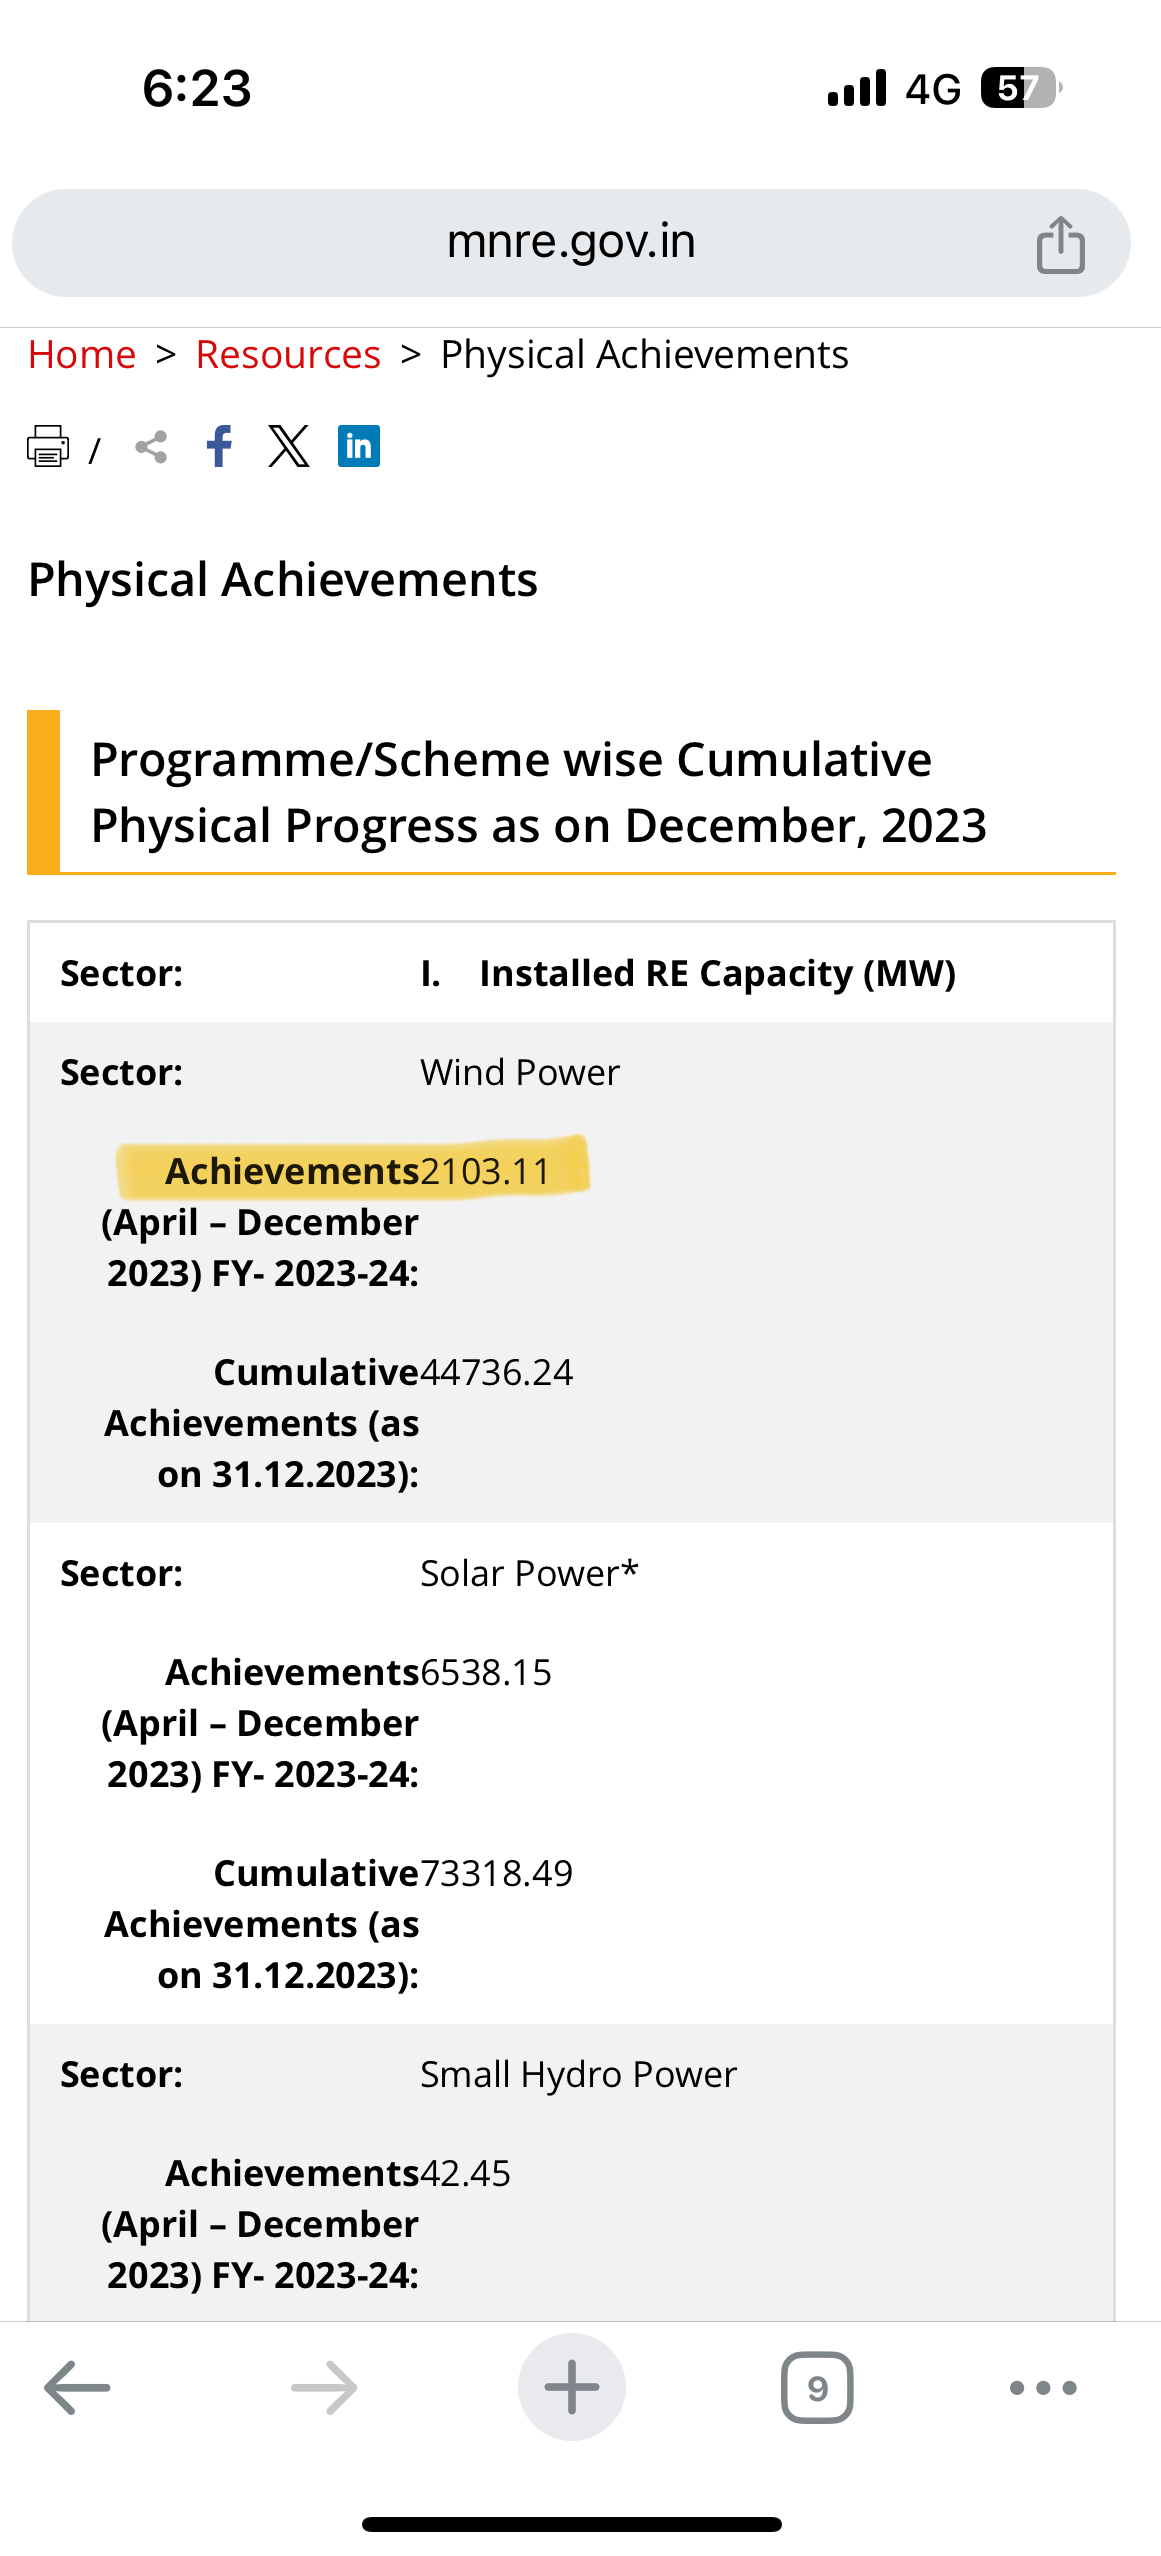
Wind installation picking up pace:
April- June : 1139;
April- July : 1306;
April- August : 1456;
April- September : 1551MW (monsoons)
April - October: 1659
April - November: 1930
April- December : 2103
Wind installation picking up pace:
April- June : 1139;
April- July : 1306;
April- August : 1456;
April- September : 1551MW (monsoons)
April - October: 1659
April - November: 1930
April- December : 2103
April- Jan : 2336
Valuation Note 3 [21st February 2024]
Current Valuations can only be judged from the vantage points of How the future turns out.
If 1 year Down the line PAT growth is 30% or higher, and there is visibility for Robust Orders even beyond that, Current Valuations are approx ~ 20X P/E
If 1 year Down the line PAT Growth is 30% or higher BUT the order book starts to dwindle, the stock will be punished. Fast & Hard.
Therefore, What is cheap or expensive is based on our understanding of the future.
The question then becomes: How confident are we that Order book will remain Robust?
Firstly, Tender Pipeline for Wind/Hybrid projects & Awarded Capacity give us confidence that this most likely will be the case (Thanks to @rcinvestor999 for updating us on the same)
Secondly, the Management Commentary is bullish (Disclaimer: Management has a strong incentive to paint a rosy picture, so this is not always the most reliable Signal)
Given a 75% Market Share in Wind Energy Sector, plus a high % of Cranes with 100 MT and above capacity (most suited for higher Hub heights), Sanghvi is well placed to milk this Wind Energy boom.
The second question then becomes: If Demand is well taken care of for the foreseeable future, what can limit Sanghvi’s Growth?
My 2 cents : Its own capacity.
Even after spending ~400 Cr this year, Sanghvi has an Soft upper limit of ~154 Cr per Quarter of Sales or 615 Cr per year.
In FY24, Its already hitting that number (Q4FY24 Sales should be ~155 Cr),
If despite a huge capex of 400 Cr in FY24, Sales have a limit of ~154 per Quarter, where’s the 30% Growth going to come from?
- Rental Yields will need to increase
- More investments in buying Cranes
| Rental Yield (%) | 2.3% | 2.5% |
|---|---|---|
| Sales (Cr) | 646 | 702 |
**Assuming Current Gross Block of 2600 with 90% Max utilisation. Sales = 0.9*Gross Block Rental Yield
If Rental yield increases to 2.5%, Sanghvi can eke out as much as ~700 Cr. Nearly 80 cr more.
So, the same Crane Capacity can accommodate at least up to ~11% Sales Growth without spending more on increasing crane capacity (i.e - buying more cranes)
But there’s the kicker, an increase in Rental Yields to 2.5% goes straight to the bottom line.
This 80 Cr, on a post-tax (25%) basis, has the potential to increase PAT from 180 to 240 Cr.
A 30% PAT Growth.
Although the probability of Sanghvi being able to hit a Rental yield of ~2.5% should be viewed with a healthy Skepticism, it is NOT entirely outside the realm of possibility.
Either way, in my view there are 3 Growth Drivers :
Personally, given my understanding as of today I am least worried about point 1. The Demand for once does not seem to be a problem. Capacity might be.
My Guesstimate is that a combination of Rental Yields and Capex is likely to drive growth.
An announcement of a sizeable capex program in the near future should be an important trigger because it would be akin to “putting your money where your mouth is”
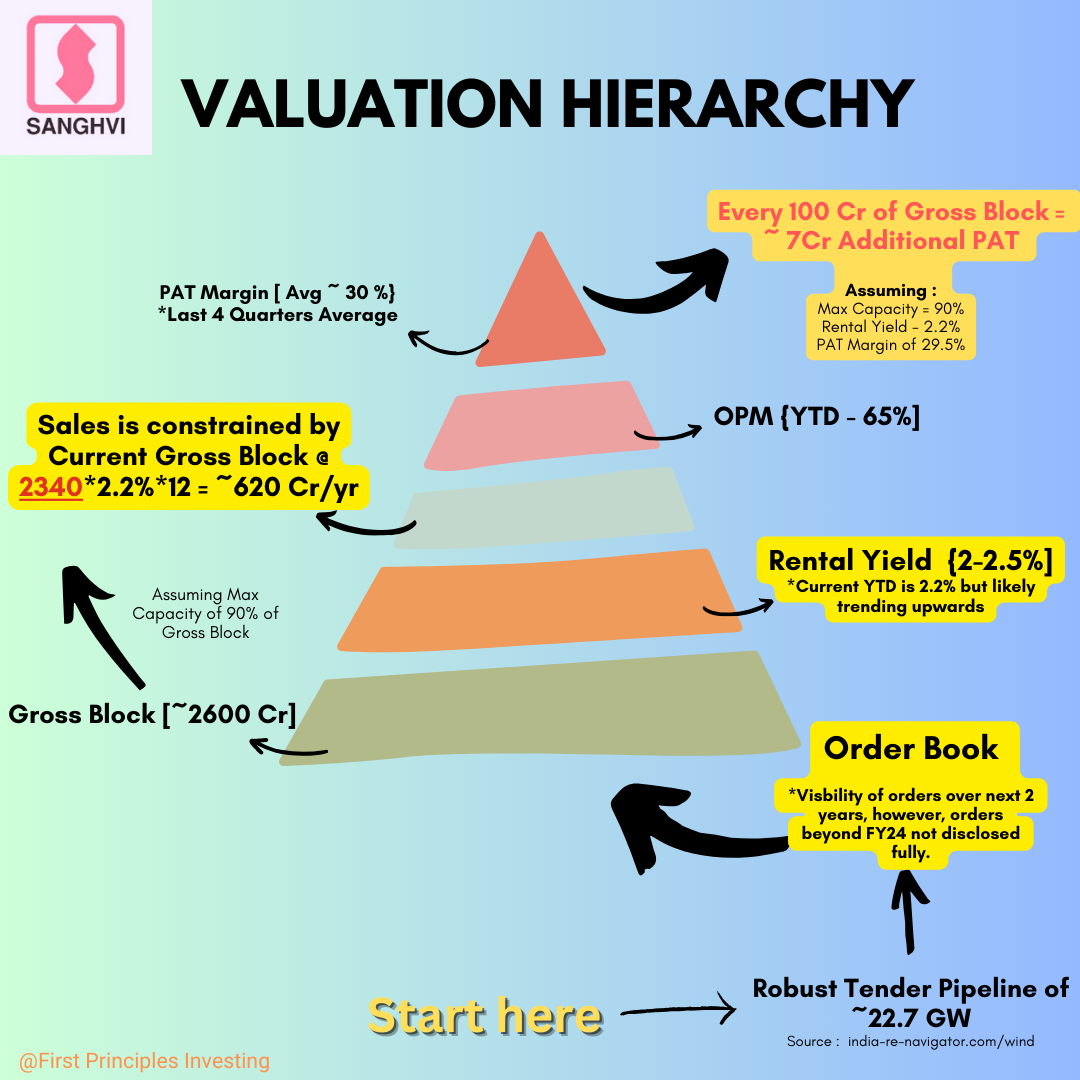
We’ve already got a sense of what Rental Yields can do for Sales and PAT, here’s a diagram that can help us understand the impact of Capacity on Sales and its limitations.
In short, Every 100 Cr spent on Capex can increase PAT by ~ 7 Cr. This means if the co’ spends another 400 Cr, PAT Growth is likely to be just about 15% (28/180 Cr)
Hardly inspiring.
This is why I believe, Rental Yields, Capex and Op. Lev Combined would be needed to hit a 30% or higher PAT growth, a minimum benchmark for us to conclude with confidence the Stock is Currently cheap or reasonably priced.
Look forward to hearing your views. Please Feel Free to point out any errors.
Forgot to factor in revenue and profitability of epc segment
I see large order book from EPC segment 500 cr crane rental will translate to 1500 cr total order book including 1000 cr EPC
They received 166cr EPC order, to be executed over 8 quarters, average of 20cr per quarter. Not sure of margins they’ll get there. It may need some investments, but even at 25% net margins, this one EPC order adds 4cr/qtr 16 cr/yr PAT. Equivalent of 200cr capex. Also, there are some articles that highlight that good quality EPC players is the bottleneck in wind capacity growth. So, growing EPC order book is the missing kicker. My guess is, market is also betting on EPC growth.
Nicely put!
Apart from the missing EPC piece, one other angle imho is cash profits.
(Disc: not a valuation or accounting expert, could be wrong, feel free to correct) -
Cranes have useful life of 35-40+ years. Depreciation in P&L is pretty aggressive. Therefore, if we don’t use cash to value this company, we will be undervaluing it.
Earnings power value
What is the static value of this business assuming no change (no growth, no cyclicality, persistent demand)?
Cash profit / WACC = 370/13% = ~2800cr
Enterprise value is around 5000cr…
The difference can be explained by growth expectations of market. However, we need to check if growth is value accretive or diminutive.
Value of growth
Someone in one of the above posts calculated Return on incremental CAPEX. Using similar method:
Yield on new cranes (more expensive): 1.7-1.8% (20% annually, payback period of 5 years w/out accounting for OPEX)
Revs to cash conversion: ~55% (based on latest PPT)
Post-tax return on incremental capex = 20% annual yield for new crane * 55% = ~11%
Cost of borrowing = ~9%
Assuming new capex will be funded by debt, growth looks marginally value accretive (11%>9%)
However, mgmt. indicated that they will be conservative wrt. Debt to Equity ratio (0.3) unlike past cycles that could set a ceiling for growth
Return on Invested Capital (proxy for ROE for such companies)
~370cr cash profit capability on current gross block; based on Q3 PPT
~2500cr gross block (Q2 transcript 2485 + some addition in Q3; 90% useful)
ROIC = cash profit / useful gross block = 370/2500 = ~15%
WACC could be close to 12-13%, marginally value accretive (15%>13%)
Yields
Mgmt. has indicated that 2.5-2.6 may not be achievable now, but they are confident of ~2. This may be a drag on valuation in long term
Tying it all
Since the value of growth is only marginally accretive, it cannot itself explain the huge gap between EV (~5000cr) and EPV (~2800cr). Looks like the rest of the growth baked in is EPC based (as per market).
On the surface, looks tightly valued or may be overvalued, especially if cyclicality of core biz is taken into consideration. However, the expectations around EPC biz could be providing some stability into valuations, not sure. Need some estimates around EPC valuation to put the final brick in the puzzle. Need help with that, thanks.
Disc: Tracking position, Evaluating
Valuation Note 3 - UPDATED [22nd February 2024]
Current Valuations can only be judged from the vantage points of How the future turns out.
If 1 year Down the line PAT growth is 30% or higher, and there is visibility for Robust Orders even beyond that, Current Valuations are approx ~ 20X P/E
If 1 year Down the line PAT Growth is 30% or higher BUT the order book starts to dwindle, the stock will be punished. Fast & Hard.
Therefore, What is cheap or expensive is based on our understanding of the future.
The question then becomes: How confident are we that Order book will remain Robust?
Firstly, Tender Pipeline for Wind/Hybrid projects & Awarded Capacity give us confidence that this most likely will be the case (Thanks to @rcinvestor999 for regularly updating us on the same)
Secondly, the Management Commentary is bullish (Disclaimer: Management has a strong incentive to paint a rosy picture, so this is not always the most reliable Signal)
Given a 75% Market Share in Wind Energy Sector, plus a high % of Cranes with 100 MT and above capacity (most suited for higher Hub heights), Sanghvi is well placed to milk this Wind Energy boom.
The second question then becomes: If Demand is well taken care of for the foreseeable future, what can limit Sanghvi’s Growth?
My 2 cents : Its own capacity.
Even after spending ~400 Cr this year, Sanghvi has an Soft upper limit of ~154 Cr per Quarter of Sales or 615 Cr per year.
In FY24, Its already hitting that number (Q4FY24 Sales should be ~155 Cr),
If despite a huge capex of 400 Cr in FY24, Sales have a limit of ~154 per Quarter, where’s the 30% Growth going to come from?
First Let’s Checkout Rental Yields :
| Rental Yield (%) | 2.3% | 2.5% |
|---|---|---|
| Sales (Cr) | 646 | 702 |
**Assuming Current Gross Block of 2600 with 90% Max utilisation. Sales = 0.9*Gross Block Rental Yield
If Rental yield increases to 2.5%, Sanghvi can eke out as much as ~700 Cr. Nearly 80 cr more.
So, the same Crane Capacity can accommodate at least up to ~11% Sales Growth without spending more on increasing crane capacity (i.e - buying more cranes)
But there’s the kicker, an increase in Rental Yields to 2.5% goes straight to the bottom line.
This 80 Cr, on a post-tax (25%) basis, has the potential to increase PAT from 180 to 240 Cr.
A 30% PAT Growth.
Although the probability of Sanghvi hitting a Rental yield of ~2.5% should be viewed with a healthy Skepticism, it is NOT entirely outside the realm of possibility.
The Second driver is capex.
From the Graphic below, we can see that Every 100 Cr spent on Capex can increase PAT by ~ 7 Cr assuming Rental Yields & Net Margins at 2.2% & 30% respectively.
This means if the co’ spends another 400 Cr, PAT Growth is likely to be just about 15% (28/180 Cr)
Hardly inspiring. If viewed in silos.
The 3rd Driver is is the outstanding EPC Order book of ~111 Cr to be executed ~ 71 cr in FY25 and remaining 40 Cr in FY26.
I have no clue what the PAT Margins for EPC book can look like (@rajdori, @Vaibhav_Temani - Any reliable sources?) but 25% PAT for EPC may seem a little too optimistic. I also have no clue as to the distribution of the EPC order book. Whether Co’ will recognise this 71 Cr equally per Quarter in FY25 or any other way.
A conservative 10-15% PAT Margin, would lead to a PAT of 7-11 Cr in FY25, which is a 4-7% Growth over FY24 full year PAT of ~180 Cr.
Bottomline is that there are 3 Growth Drivers, all of which rest on the foundation that Order book will NOT be an issue.
- Rental Yields increasing
- A Sizeable Capex Program to Increase Capacity
- EPC Book (111 Cr) & potentially Growing further.
If this basic premise fails for whatever reason, these 3 Key Drivers will be significantly weakened.
Growth (if) is likely to be a function of a combination of the 3, with Rental Yields being the most preferable (Increases ROE too) and Capex being the least preferable way to pursue growth.
In Conclusion, Current P/E of 28-29X are justifiable only if PAT Growth is strong. For me, a 30% growth in PAT is a minimum benchmark for valuations to make sense. Maybe for you its a different number.
Thanks again @aditya_kedia, @rajdori & @Vaibhav_Temani for your valuable inputs.
Look forward to hearing your views. Please Feel Free to point out any errors.
PPT JAN 24 SANGHVI.pdf (1.8 MB)
A good presentation on Sanghvi movers by accomplished old VPer Prabhakar Kudva presented in TIA Chennai.
discl invested since last 1 year
10 Sanghvi Movers PPT PRABHAKAR KUDVA TIA FEB 24.pptx (980.3 KB)
In case you’re wondering why Sanghvi took a beating today ~8-9%
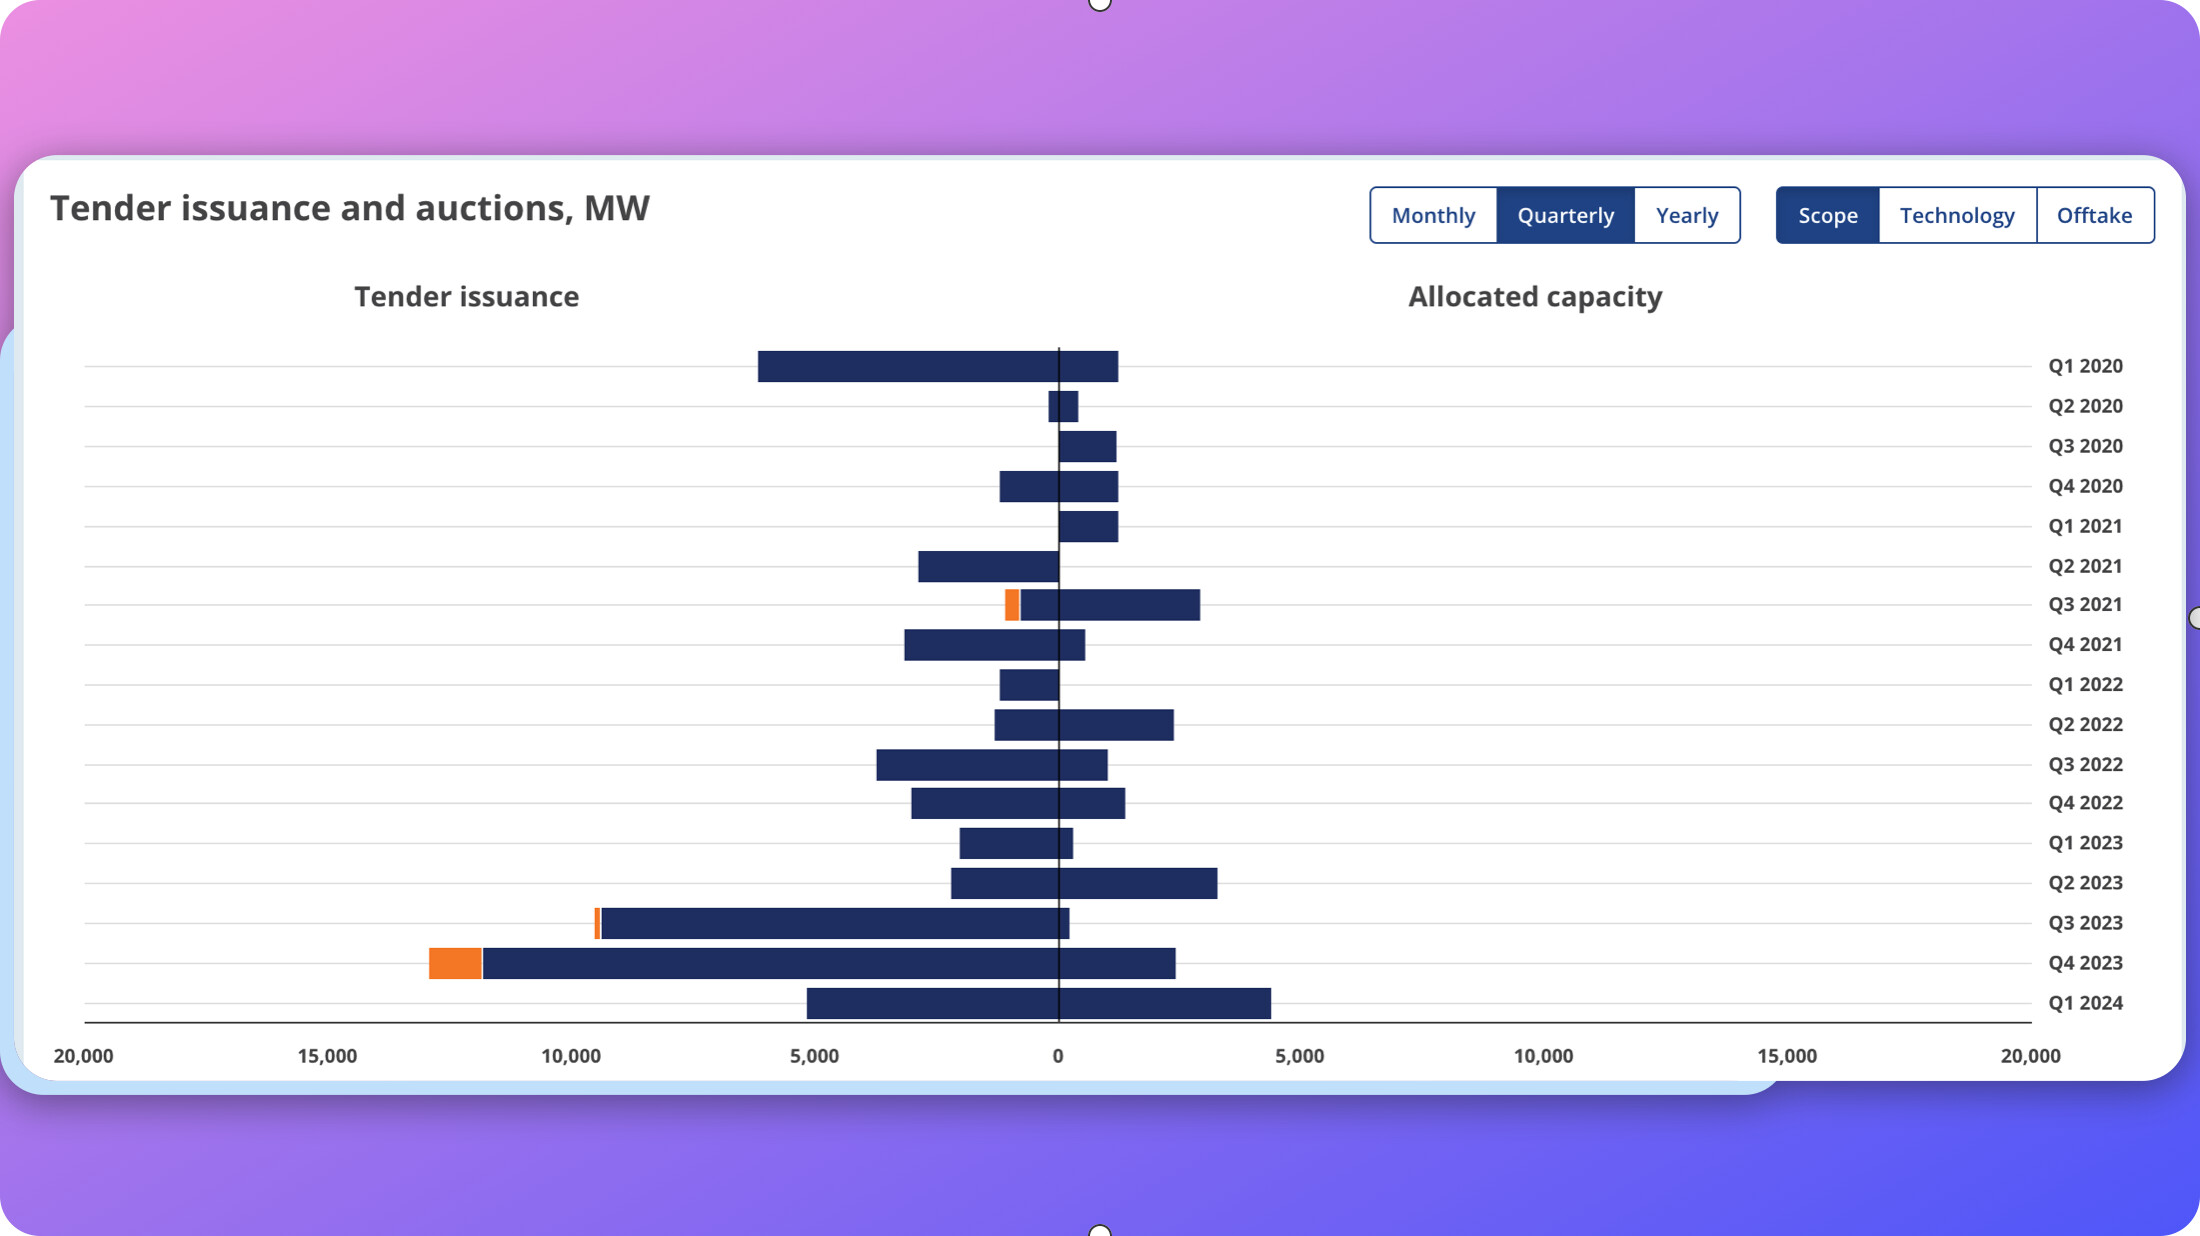
There is an article in the Hindu Businessline which mentioned the potential reinstatement of the Reverse bidding mechanism for Large projects (600MW+) since a lot of auctions were not being awarded because of increasing cost/KWHr for Wind Energy.
This is evident from the bars on the left being much higher than on the right. Allocated capacity is much lower than the Tenders issued.
So even though Auctioning and ‘awarded capacity’ has increased (look at the order books of Suzlon, Inox) but according to the Government it is NOT enough.
According to the article, a “Letter” sent by the Government to SECI, NHPC, SJVN etc to implement Reverse bidding for larger projects (600MW+).
However, I have neither found the letter nor found any other evidence that verifies the contents of the Article. I even wrote to the writer of the article to get more details and I’m awaiting his reply. Will update here when/if I do.
To give you a backdrop, the reason why many Investors are Shitting bricks right now (unless you’re blissfully unaware) on the back of this news is that Reverse Bidding was actually abolished in just January 2023 and was one of the most important requests of Wind Energy players. Too much competition during bids was killing the Industry.
That’s why there’s wisdom in being extra cautious while Investing wherever the Government exerts significant influence on the fortunes of the Industry. Flip Flop is a norm, not an exception. There is a reason why some of the best Investment Managers avoid overly regulated Industries but we’re beyond that point so ![]()
Reinstatement of Reverse bidding means that Auction Bidders - Energy Generation companies (NOT Suzlon, Inox and Sanghvi) would end up competing for tenders, which is likely to push the per KWH cost lower and likely their IRR.
Too low and Generation companies wouldn’t be motivated to execute the project, too high and the Government and eventually (You & I) the consumer would become unhappy.
In that sense, If the “letter” is what the article says…is an attempt to find a balance between the motivations of various stakeholders.
And that’s why In my view (and I could be completely wrong), the letter, is actually a positive signal instead of a negative one because an optimum pricing would actually ensure higher Awarded capacity, higher order books and likely higher execution and higher profitability in the long run.
If anyone has more details on the “letter” please share here. Anyone working in the Wind Energy Industry, kindly DM me ![]()
A good note to understand this new development. story seems intact for sanghvi n other players.
Suzlon-Energy-Flash-Update_2Mar24 (1).pdf (438.1 KB)
Thank you for putting across this write up. I’m sure this clears the confusion for a lot of investors.
Few reasons to think this maybe a ‘parked’ article and a classic case of shakeout are:
29th Feb article released, 5th march still no official announcement
bigger hands will only accumulate while and after shaking out weak hands and at DDs. this gives them liquidity for bigger buy quantities without raising the share price.
Price action shows a correction to 845-850 levels is pending, which might happen now. That would be an ~ 30-35% DD from the highs - A place when bigger hands, funds etc would want to keep accumulating - on the way down with panic selling and increased liquidty.
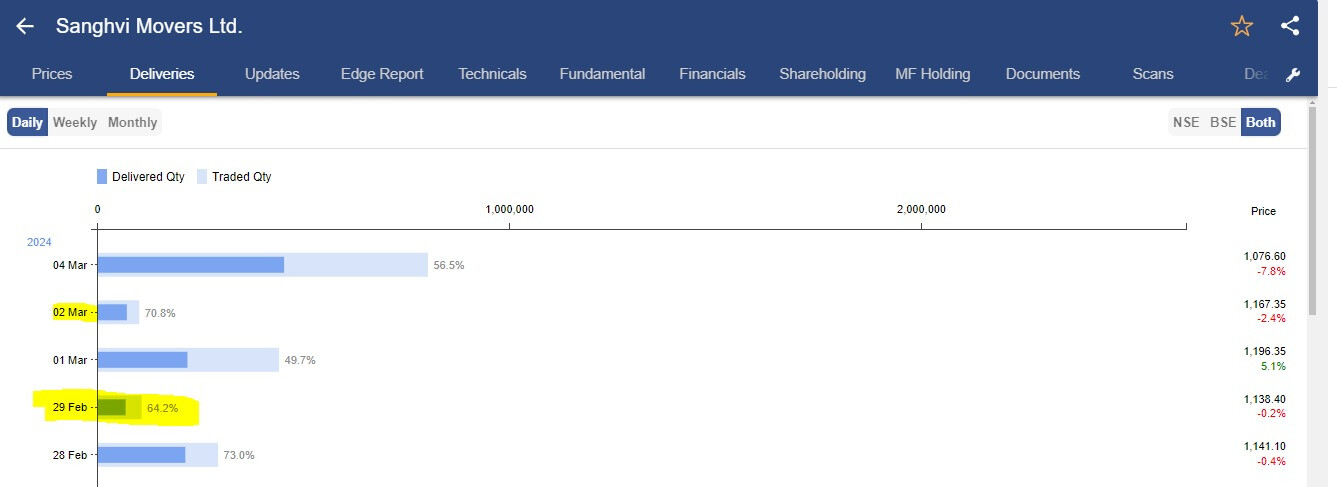
Image below clearly shows:
A big price fall with massive volumes with 57% deliveries doesn’t add up, clearly someone’s accumulating. Moving forward will be interesting to see delivery percentages.
Disc: could be completely wrong in my assessment. Biased and invested since 2018-19.
Wind installation picking up pace:
April- June : 1139;
April- July : 1306;
April- August : 1456;
April- September : 1551MW (monsoons)
April - October: 1659
April - November: 1930
April- December : 2103
April- Jan : 2336
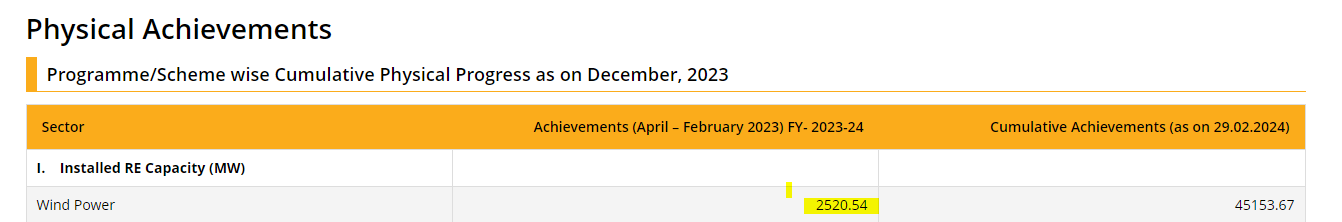
April-Feb : 2520
Thanks for providing your thoughts on one of most sought after share by the retailers. Brilliantly presented the financials.
Anyone have Q3 2024 Concall transcript?