Sanghvi Movers

As per Concal : Capacity utilisation is at 90% and average yeilds are at 2%. The next round of growth will come for CAPEX which will funded with Debt : Equity ratio of 70:30.

What is generally asset turnover ratio in this industry for new/old cranes ?? Kinldy also advise how the Yeilds are calculated in this industry.

Disclosure : Initiated tracking position.

1 Like

Very bullish commentary from management side…Very insightful comments by the management on the sector:
Concal highlights:

We are also strengthening our position by adding 12 new cranes and 68 ancillary equipments in our portfolio by incurring a capex of 163 crores for FY23.

So just to answer the question in FY23, the wind industry added about 2.3 gigawatts of capacity addition. Looking forward, we have order visibility and market pull for FY24 that the country may add 5 gigawatts of capacity addition in wind.

There is still about 25 to 40 gigawatts of additional potential which is totally untapped in the country at 140 meters. And at 160 meters, it is more than 100 gigawatts.

Looking forward in the refinery and petrochemical space, nearly 80 million tons per annum of capacity is being added either as an enhancement Brownfield or Greenfield project. In thermal power sector, almost 25 gigawatts of capacity are at various stages of construction. In steel sector, 13 million tons per annum of capacity addition is expected in this financial year. The cement industry plans to add about 80 million tons per annum by FY ‘24. Nearly every tier 1, tier 2, metro city has an elevated or underground metro under construction. There are more than 20 airports that are being constructed across the country, including but not limited to Noida, Guwahati and multiple such locations Wind is expected to add about five gigawatts of capacity addition in FY ‘24. So all around, all core sectors are firing on all cylinders and there is sufficient demand or increased demand for crane. Therefore, management has, of the company has started prudent to invest about INR 263 crores, which has been approved by the Board of Directors. And we will be investing in capacity addition to cater to this demand.

Board has approved the capex plan of INR 263 crores, because the pipeline is also a healthy pipeline we have, to cater to the needs of the customers.

Gross Block of Crane : Rs 2300 Cr

When we did a huge capex in the financial year ‘15 and ‘16 and ‘16 and ‘17, we did a huge capex of almost INR 800 crores, in those two years. After that, there was a downturn in the economy, more particularly with respect to the wind sector, where the government has changed the method of bidding for the wind sector from bidding tariff to reverse auction. And that’s why, you must have seen the wind installation in India has come down from 5.3 gigawatt to 1.7
gigawatt to 1.5 gigawatt on an average in last three years to four years. . In FY ‘23, India has already completed 2.3 gigawatt of wind installation. Now, Government has set an ambitious target of 8
gigawatt wind installation going forward. So there’s a good amount of business, we see from the wind sector.

Okay, that was the first thing.
Secondly, we have taken a huge amount of debt in financial year ‘15-‘16 and ‘16-‘17. We had a debt in excess of INR5 50 crores. You must have noticed that, we have substantially reduced the
debt and the debt level as on today is INR160 crores.

You must have noticed in the financial year, we did a capex of INR 111 crores. Last year, we did a capex of INR 161 crores. In spite of that, our debt has come to INR 160 crores only. So now, we have strengthened our balance sheet.

You must have seen company has earned the cash accruals in excess of INR 233 crores. So we are better off as compared to the previous cycle.

That was the first thing Secondly, not only from the wind sector, the capex is happening across all the sector, where the cranes are deployed. And that is being reflected in the yield as well as the utilization. And obviously, in the turnover of the company. So just to give some of the answers, we are better placed as compared to what we were in financial year ’15-‘16 and ’16-‘17

So we don’t believe that, the current sentiment is a short-term sentiment. At least, I don’t believe it. I cannot speak for my Board or the entire organization. And there is sufficient traction or
project planning from multiple private players that, have long-term plans upto 2030.

So crane is a very central aspect of any infrastructure project. And we have the benefit of working across several sectors. We are not limited to any one sector. Moreover, we have a brand name and a brand recognition along with a 33 year track record, which a lot of corporate houses and government agencies appreciate.

So I don’t comment on competition’s capex, but to put things in context, we are the only organized and listed player in this space. So you may draw your inference from there.

So it’s a good question. And I would like to share the following information with everyone
present. So there has been a transition in the wind industry in the last two years, where the OEM has now been focused on delivering the product to their customer and not undertaking the
execution of the project. On the other hand, the customer of the OEM is an IPP, who doesn’t have the project experience, to do a complete project execution in the wind industry. So we see
that, there is a scope for a player such as ourselves, where we can get involved in the providing turnkey EPC services for the wind industry.

Cranes is a majority of the portion of the construction of a wind farm. We have started developing in-house expertise to provide services other than cranes around various activities involved with the construction of a wind farm, surface logistics, inter-carting, foundations. So there are three categories of mechanical, electrical and civil BOP, which is balance of plant which are the services around which, we are offering to our customers.

And lastly on the capex, that we are doing. So, when do we expect this capacity to be available?

*h INR 200 crores of this capex has already been executed. So this capacity is already available?
Sham Kajale: Yes, in the first quarter itself. Most of the cranes have come in the fag end of the April end.
Some trains have come in the month of May also.
They take about a month to start generating revenue from docks to site. Most of, the majority portion of the capex has been backed by orders, yes.

Disclosure: Invested after the Concal

6 Likes

More fund buying

Sanghvi should get a lot of traction moving forward

5 Likes

Sanghvi Movers Limited: Long-term rating upgraded to [ICRA]A+ (Stable); short-term
rating reaffirmed

https://www.icra.in/Rationale/ShowRationaleReport/?Id=120735


2 Likes

Hello,

I wrote a short note to make sense of valuations for Sanghvi as they stand today.

I took a tracking position about 4 weeks back (Disclaimer : Invested) and was exploring whether valuations and the business potential justify further accumulation.

Even some basic research indicates that P/E may not be a great way of looking at Sanghvi simply because High depreciation lowers the optical earnings but cash conversion as seen from CFO/Sales is very respectable.

A better way to look at valuations might be EV/EBITDA (Even better Price / CFO but not discussed here)

EV/EBITDA

There are 2 ways we can look at the EV/EBITDA based valuations here :

Historically

Sanghvi Movers Went through 3 major cycles (including the current one) over the last 14 years.

From the chart given above, it is evident that :

Between 2011-2013, When the co’ hit a peak EBITDA of 300 Cr+, EV/EBITDA was ~ 3.3X

Similarly, in 2017 when TTM EBITDA hit ~ 325 Cr, EV/EBITDA was in the range of 4-5 X

And today, as we speak TTM EBITDA is at a recent high of Rs. 257 Cr with a higher EV/EBITDA of 9.45X (unlike in the previous 2 cycles, for many reasons this not a peak. yet.)

Now, there are a couple of things to take from this :

Firstly, we can see a general trend of higher EBITDA Peaks in every successive cycle, which correspond with higher EV/EBITDA multiples (3x to 4-5x to 9.5x)

No reason this should continue : It’s an observation.

Although, this observation seems to align with a standard pattern seen in some of the better players in a cyclical Industry (Check Sugar Industry, Maithan Alloys etc) where each successive peak is higher than the previous peak, and each successive bottom is usually higher than the previous bottom.

So, higher tops and higher bottoms.

And these higher tops and bottoms are observed in Earnings (or EBITDA), Stock prices & Valuation Multiples (E.g - EV/EBITDA)

Taking these observations from the past and applying On a Forward Basis, let’s see how numbers can pan out for Sanghvi.

Today, TTM EBITDA is at Rs. 257 Cr (March 23Q), which is nowhere close to the previous peak of ~ Rs. 325 Cr.

This is indicative of the fact that the co’ can sweat out Rs. 325 Cr of EBITDA at least (or more) from the existing Gross block.

But, What is the link between the Gross Block & EBITDA?

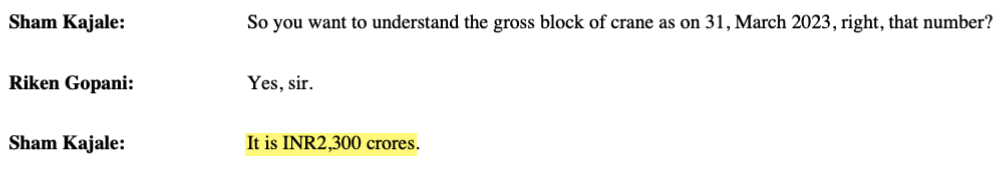
Well, Cranes form the Gross Block for Sanghvi and it reports (or communicates) its performance in terms of Yields it can earn on the Gross Block.

In 2023, the yield on Gross block of ~ 2300 Cr was ~ 1.65 % per month [(Revenue/Gross Block)/12] Where FY23 Revenue was Rs. 456 Cr.

Which means in FY23 it earned a yield of around 19.6% (on Gross Block) and it has guided that this can go up to 2%/month or 24%/year/

24% of Rs. 2300 Cr is Rs. Rs. 552 Cr.

That turns out to be a Y-O-Y Revenue growth of 21%

Bear in mind that this 21% Revenue Growth is assuming there is no additional creation of Gross Block (think : Cranes bought/leased) but since there is actually an expected capex of Rs. 260 Cr, Growth may be higher than 21% !

In the interest of conservativeness, assume 21% Y-O-Y Revenue Growth.

And since EBITDA margins are expected to be in the zone of 65% (3 year Avg - Check Graph below), this means EBITDA next year could be around Rs. 358 Cr.

That means for a Revenue Growth of 21%, we get an EBITDA growth of ~ 35% which is not surprising given Sanghvi exhibits high operating leverage.

This also means that PAT Growth is likely to be even higher.

Let’s say it’s 50% PAT growth. To get a more precise figure one can do a modelling exercise.

That means, on a forward basis - EV/EBITDA is around 7x and Leading P/E equals ~ 14x

If numbers turn out to be better than we assumed (most likely the case), on a forward basis EV/EBITDA and P/E do not seem as expensive as they do today.

They are definitely not anywhere in the ‘What a discount !!’ category

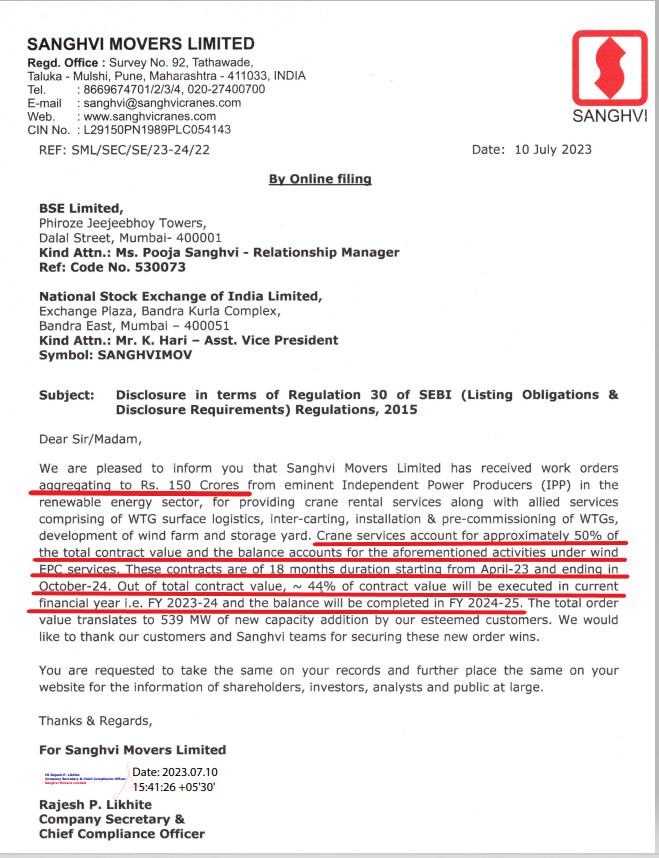
In fact, I wrote this note in the afternoon of 10th July and later that night Sanghvi updated the Stock Exchanges with this :

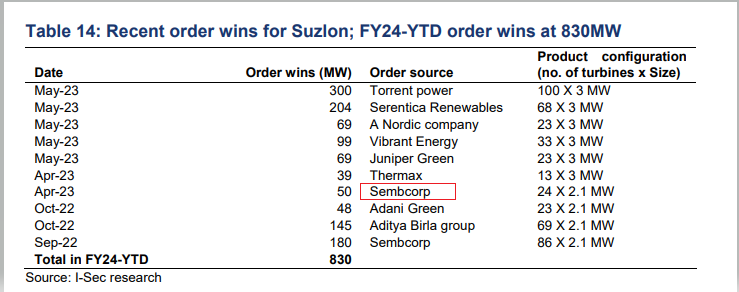
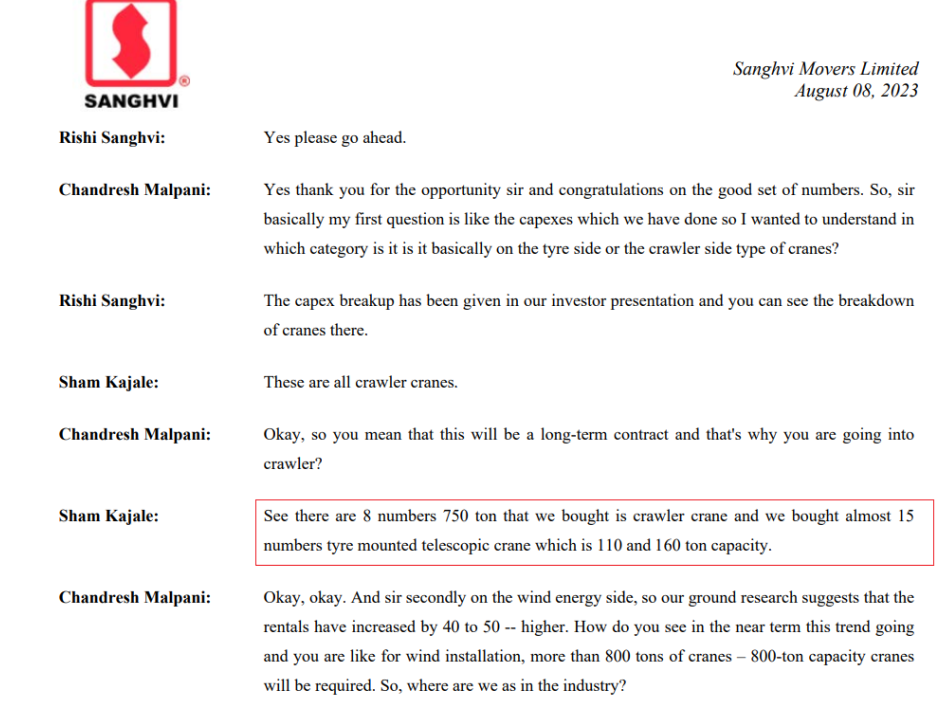
  • Additional orders of Rs. 150 Cr, out of which 44% will be executed in this year.

Here’s what this means :

As on March 23, Sanghvi had an outstanding order book of Rs. 299 Cr to be executed in the current FY, this was up 26% from the previous year.

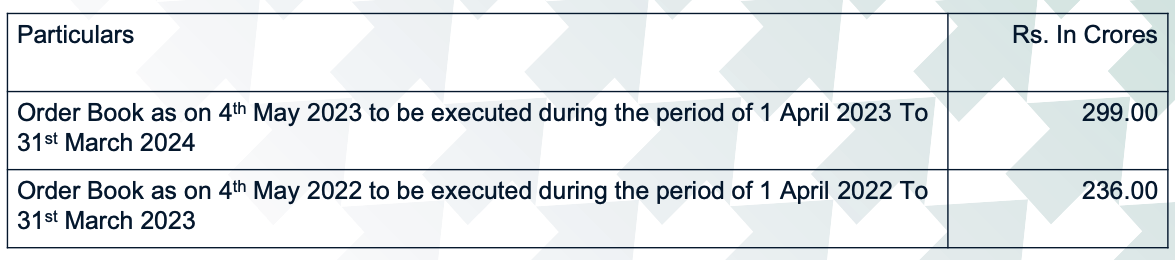
We’re just done with the first quarter of the year, and the company has added 66 Cr worth of orders to be executed during the year, bringing the Total Order book to be executed in FY24 to 365 Cr.

That’s a Revenue Growth potential of Rs. ~55% on a yoy basis.

For those who are wondering if the order book was only Rs. 236 Cr in FY23 why the reported Revenue for FY23 was Rs. 456 Cr, that’s because of older orders being executed + jobs taken on during the year on a short term basis.

The bigger point here is that there seems to be some linkage between order book growth and Revenue Growth.

So If for the 21% Revenue Growth assumption, which we estimated would bring in 35% EBITDA Growth and ~ 50% PAT Growth, a 50% Revenue Growth might bring in much higher EBITDA and even higher PAT Growth.

Even if EBITDA & PAT Grow by 50%, and bear in mind this is seriously conservative given that Sanghvi has high operating leverage built into its business model, we’re looking at :

EV/EBITDA = 6.33 x [ Median - 5.4 x] Vs. Current EV/EBITDA = 9.1x

Price / Earnings = 14 x [ Median - 9.6 x] Vs. Current P/E = 21.1 x

Which, again, are not exactly mouth-watering valuations but are not as optically expensive as they seem today.

As a cautionary note, let’s be clear there are a bunch of assumptions that have gone into these back of the envelope calculations and I strongly recommend you decide for yourself if they make sense or not.

Another way to Value the Co’ would be on a Cash Flow basis, such as Price to CFO.

Anyway, if the above numbers don’t make sense please feel free to share why not and why there’s a better way of looking at this situation.

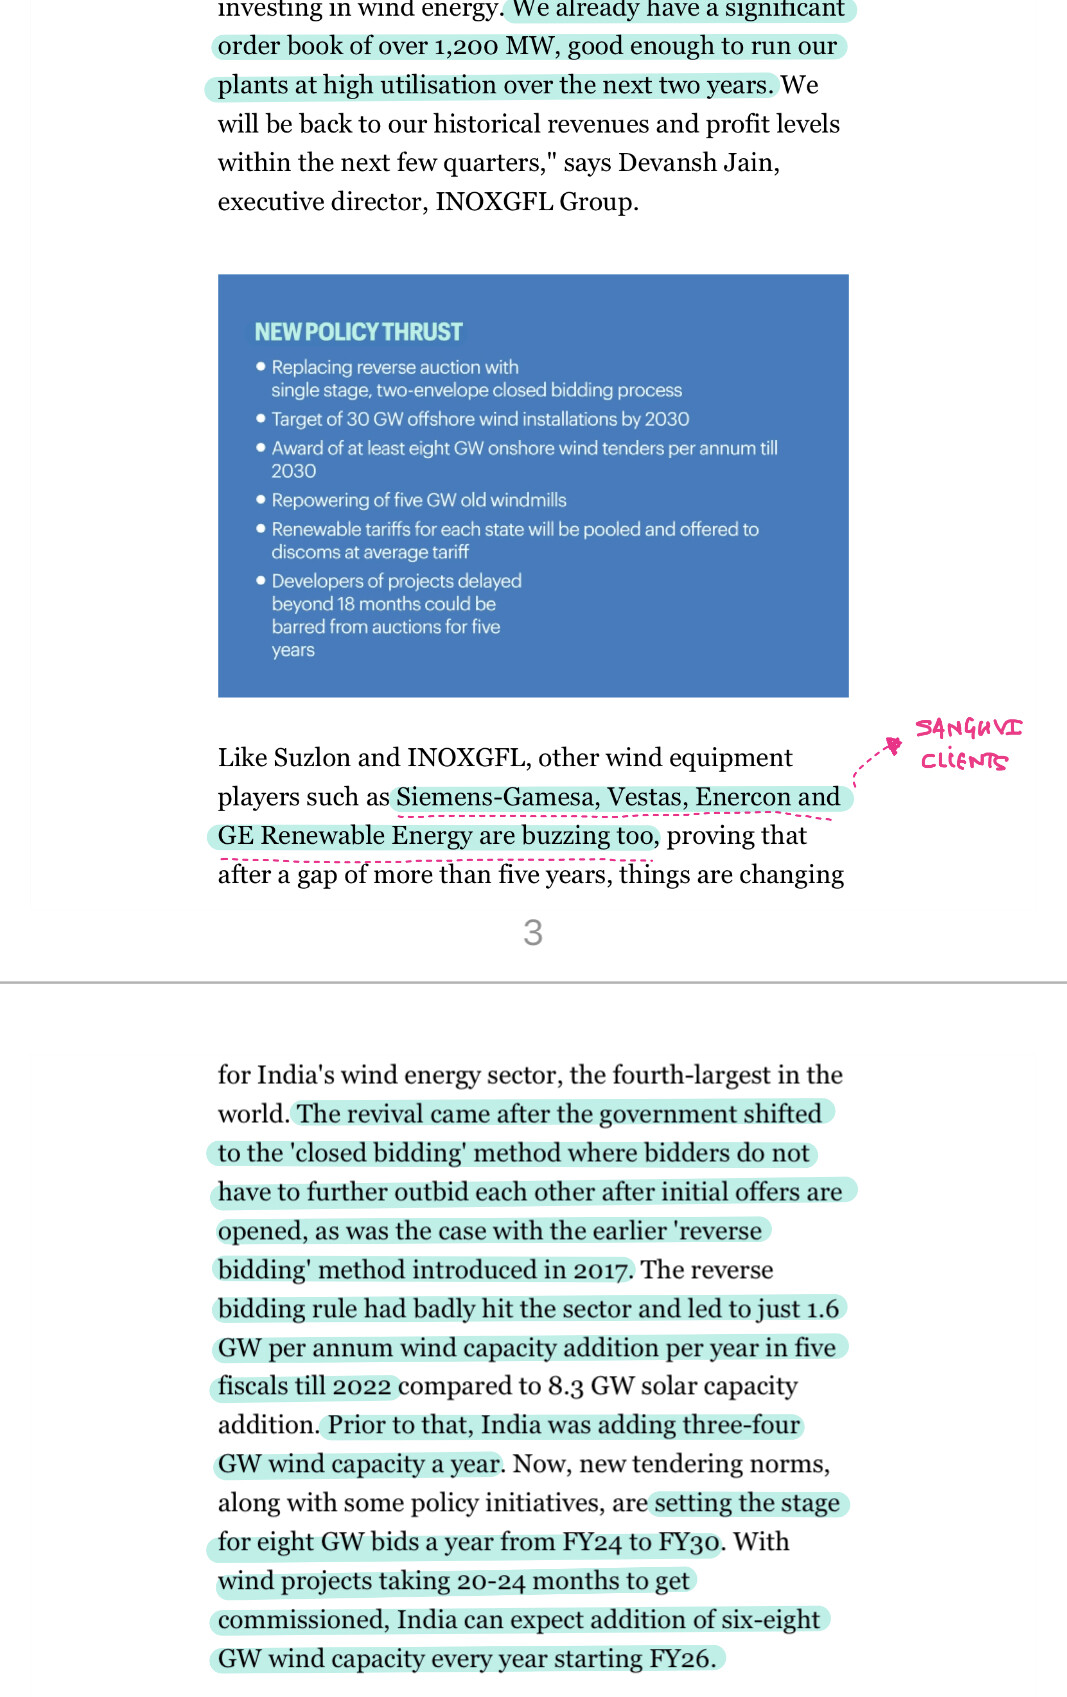
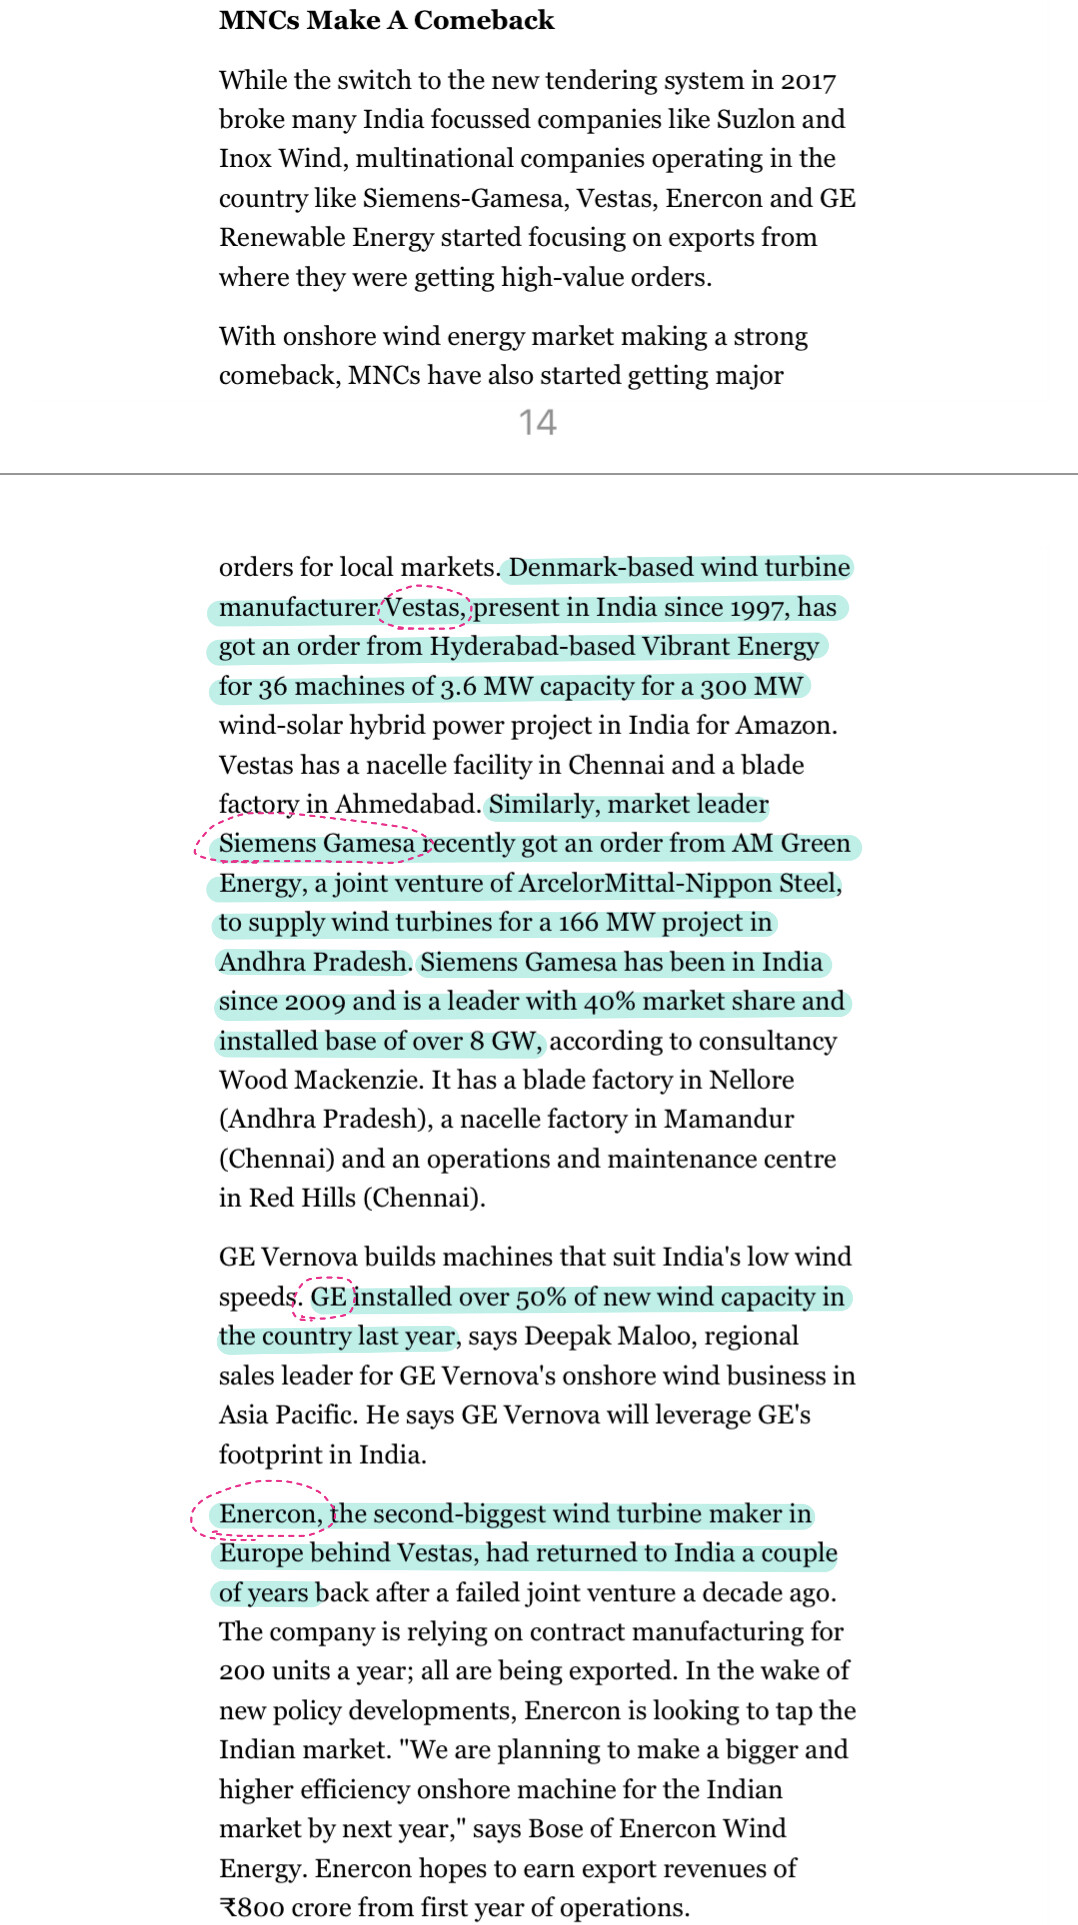
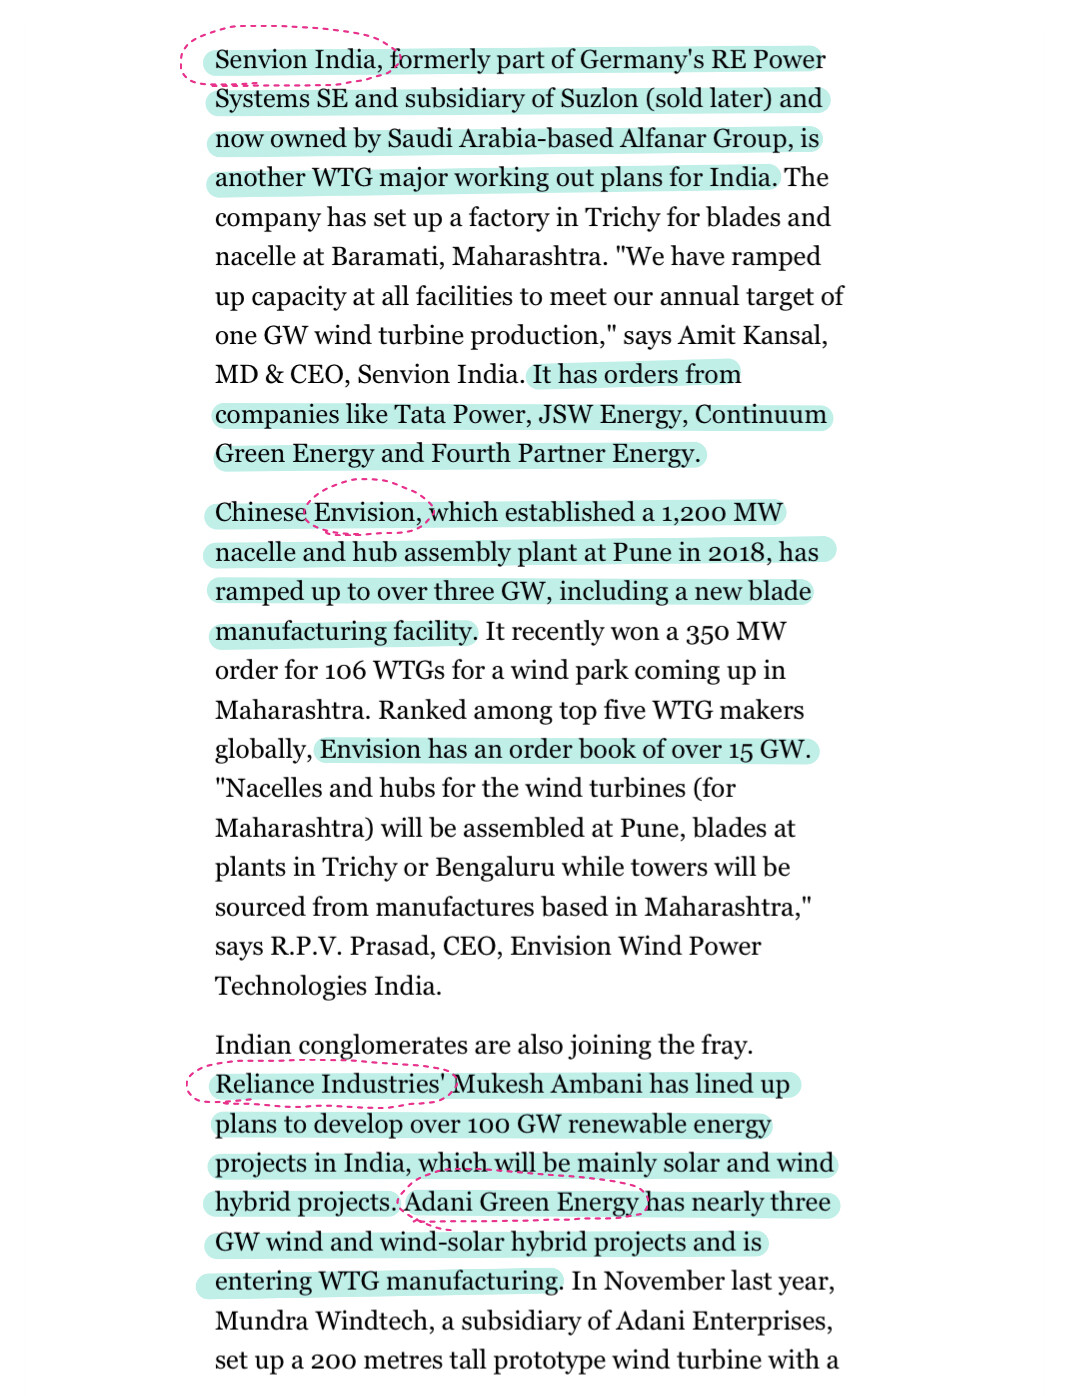
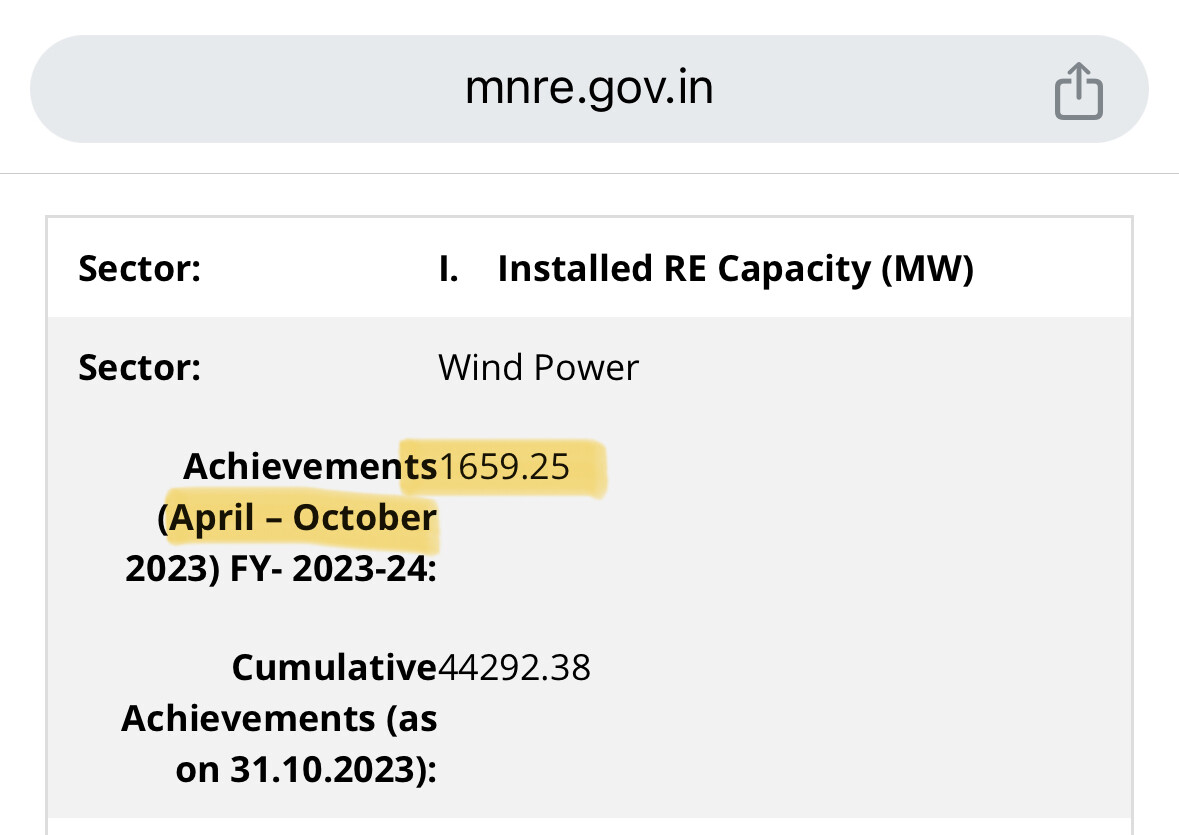
Lastly, I believe this up-cycle in Sanghvi (& Wind Power Sector) is entirely dependent on the extent to which this cycle could go on (Duh)

In the past, markets have been very efficient at pre-empting Sanghvi’s future performance and despite expected bullish numbers over the next year, if signs of slowing growth/order booking emerge the stock can be hammered down real fast.

On the other hand, if more wind projects are awarded AND execution of these projects keeps up as well, and as a consequence we see higher order booking by the co’, the current price may even seem reasonably cheap in retrospect.

It’s not a no brainer kind of buying price but probabilities are in favor of continuance of this up-cycle.

In my limited wisdom, this is how I see Sanghvi Movers valuation as of today. I could very well be wrong, Please don’t consider this as a recommendation.

Please feel free to add more on How to best value Sanghvi.

Thank you
Rahul
First Principles Investing

20 Likes

Very well explained from different point of views, when I bought this about a year or so back, it was trading at 180 odd levels, almost nil debt, 4 or 5 times CFO, added more when they bought more cranes, added up to 280, have not added after that

2 Likes

The gross block of sanghvi is ~1500 cr (as per screener). Please could you help us understand how you arrived at the gross block of ~2300 cr ?

Hello @Navin_J

I must’ve forgotten to include the screenshot from March 23’ CC. Here it is.

Although, I am just as curious to know why there is a difference between communicated in CC Vs. Screener.in. Will share as and when I do.

Thanks

1 Like

You can check this to understand why there is a difference in gross block numbers.

1 Like

Thanks for sharing @anujpansari06

The Actual Confusion is WHY Gross Block numbers on Screener.in (~1500 Cr) and those communicated by the management (Rs. 2300 Cr) are different?

This difference can partly be explained by the fact that the numbers in Screener.in are for FY Ending March 22, whereas Management figure of Rs. 2300 Cr is for FY ending March 23’.

So, those two numbers are not directly comparable.

Still, question remains how Gross Block has increased from Rs. 1563 Cr in FY22 to Rs. 2300 given that capex was only Rs. 125 Cr in FY23.

As I mentioned I have written to the management to get a clarification and will share here when I do.

Thanks

2 Likes

The numbers from screener.in are taken from the annual report which is reported as per accounting standards. So, nothing wrong with that.

As explained in my previous post too, the gross block was adjusted during the year FY16 and thus the accumulated depreciation figure.
The company did ~500cr capex in FY16, though the gross block as reported in FY16 AR and in screener.in is 1377cr vs 1717cr in FY15. (on account of adjustment)
Also, the accumulated depreciation as shown in BS for FY16 is 126cr which is the depreciation for the year FY16 itself.

In my opinion the answer to:

lies in FY16 annual report.
And gradually the difference in this number is decreasing as they keep on selling older machinery which were restated during FY16.

To clarify further:
If you want to compare the gross block number as told by the management, then check companies quarterly presentations. That would be like to like comparison.

Ex: As seen in Q4FY22 presentation, the gross block is 2159cr while reported in FY22 annual report is 1563cr.

Do update us here if you get clarification from management too.
Thanks.

6 Likes

PPT AUG 23 SANGHVI.pdf (1.8 MB)

SOLID NOS N GROWTH

1 Like

very nicely analysed. this year as per MNRE they are planning to add 5 GW of commissioning this year and i attended a MNRE meeting where they showed the Q1 growth or addition is cumulative of last 3 years Q1 which means, the addition of wind capacity is real. further the removal of e-auction from the bids shall auger well for the long term growth

5 Likes

New fund buying

1 Like

Q1 Concall Notes:

EPC

  • EPC section has begin to materialize contributed to 5% of revenue. (Secured Order for 150CRs for IPP(550 Mega Watts) : IPP who produce power and sell in the market) might expect EDITA margin of 30 to 35%, Only doing C in EPC
  • Margins are lesser than Cranes
  • In Here 50% of revenue will belong to cranes
  • They may achieve 50 Crs on revenue in the EPC this year will be 10% of revenue
  • Next year it mat be between 10% to 20% next year
  • Credit period of 30 to 45 days

Cranes:

  • Utilization is 84%. Historically they achieved 87% max will be 90%
  • Might expect dip in utilization in next Quarter due to heavy monsoon rains yield will be 2% in Q3 & Q4
  • Capex 242 Crs(23 Cranes and 6 multi axles) revised plan of 297Cr for this year
  • Orderbook at 450Crs
  • Sold 7 Cranes in Q1
  • Receivable days may stay in 90 to 110 days
  • Q4 will be the best quarter
  • Payment for wind is 30Days
  • Contracts are fixed price typically for 1 year. They are paid on number days in the contract even customer uses them or not. However they waive some amount in case non use due to monsoon rains
  • Cash accrual for last year 234Crs
  • For capex 70% from bank and 30% from internal accrual . No plans of fund raising

Others

  • Debt repayment is about 75Crs for next 4 to 5 years
  • Only 1.13GW wind energy is installed as for 8GW target as of June 2023

D: Invested

8 Likes

6 Likes

Wind installation picking up pace:

April- June : 1139;
April- July : 1306;
April- August : 1456;
April- September : 1551MW (monsoons)

Pace should pick up further moving forward

Bodes well for Sanghvi.

7 Likes

April - October: 1659

5 Likes

The 522cr order book figure given also includes the executed orders, as clarified by the management in the call last week. Unexecuted OB would be the balance

4 Likes