
I tried searching for this info. but could not find any article supporting this claim. yes there are discussions here and there, but not any concrete ones. I found an article where it was written generic drugs are way more cheaper than they should be. don’t know what it means exactly. but I don’t think they can increase prices because health system is already expensive in US. so only way companies can earn more profits is by doing backward integration and decreasing raw material prices.
1 Like
Which quarter should show Teva unit revenue numbers contribution any idea ? Also anywhere we can check their USFDA observations response status ?
2 Likes
Should reflect in Q1
3 Likes
it will reflect from q1 onwards.
iam very bullish for FY26 as company said they will double US revenue from 800CR to 1600CR. so even if UK revenue grows @15% for next 2 years and adding up TEVA’s revenue target of 1000CR for FY26 then company may acheive upwards of 4000CR for FY26.
6 Likes
HURRAY ![]() MARKSANS IS A BILLION $ COMPANY. RESILLEINCE OF PROMOTORS IS REALLY COMMENDABLE. FROM GOING TO NEAR BANKRUPTCY, THIS IS QUITE A JOURNEY.
MARKSANS IS A BILLION $ COMPANY. RESILLEINCE OF PROMOTORS IS REALLY COMMENDABLE. FROM GOING TO NEAR BANKRUPTCY, THIS IS QUITE A JOURNEY.
WHAT DO YOU GUYS THINK IS THE NEXT MILESTONE FOR THIS CO.?
9 Likes
Received marketing auth
- Q1FY25 to be EBITDA level break even for Teva
- The product mix from Teva can expect better margin profiles.
- very bullish on the U.S. market. It is our growth driver for the next 2 years. In 1-2 years, aiming to double revenue here. 100 million to 200 million
- we are investing into the next phase for Teva , which will take us to 5-plus billion units. That 5-plus billion units will probably come after September – in the second half of the year – financial year. But hopefully, by the end of this year, we will have a decent run rate of revenue coming out from the Teva
plant
4 Likes
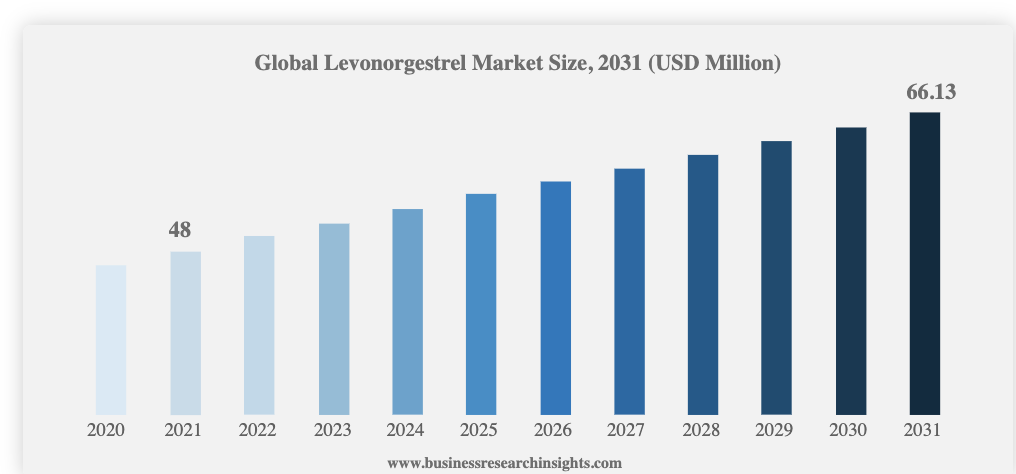
What is the market size for this drug?
1 Like
Global levonorgestrel market size was USD 48 million in 2021 and market is projected to touch USD 66.13 Million By 2031, exhibiting a CAGR of 3.3% during the forecast period.
3 Likes
this looks too good. where did you find this ?
1 Like
@jayeshjabuvani
Hi Jayesh,
Thank you for the appreciation. I am manually going through earnings call transcripts to figure out each company’s monitorables.
4 Likes
Well done @aadhar.aggarwal bhai. truly appreciate your efforts. It seems you have some conviction in Marksans Pharma just like me. ![]()
3 Likes

4 Likes
Q4FY25 another Blockbuster quarter.
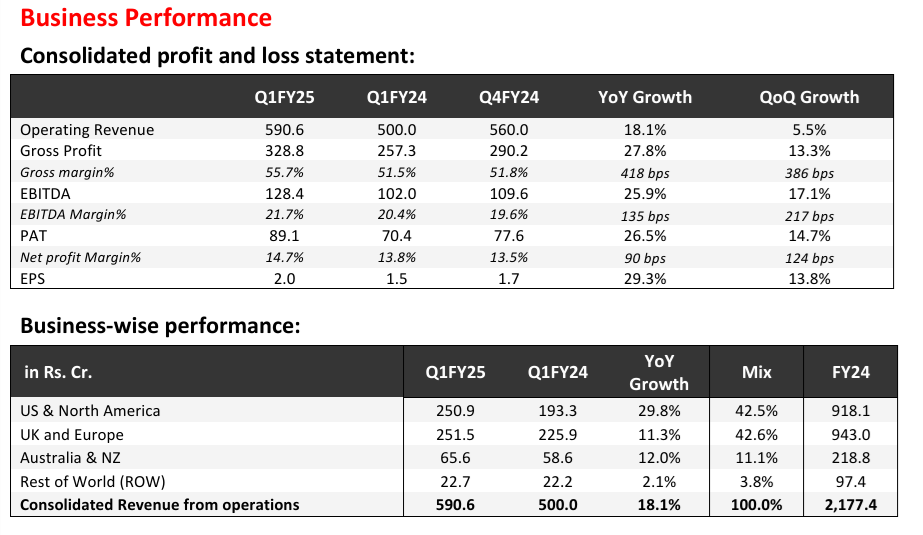
Strong Start for the year: Revenue up by 18% YoY, Gross Margin Expands by 418 bps and over 25% YoY increase in EBITDA and PAT.
Q1FY25 Financial Highlights
![]() Operating revenue was Rs. 590.6 cr., up by 18.1% YoY driven by new launches and increase in share with existing customers in the key markets.
Operating revenue was Rs. 590.6 cr., up by 18.1% YoY driven by new launches and increase in share with existing customers in the key markets.
![]() Gross profit was Rs. 328.8 cr., up by 27.8% YoY with a Gross margin expansion of 418 bps to 55.7%.
Gross profit was Rs. 328.8 cr., up by 27.8% YoY with a Gross margin expansion of 418 bps to 55.7%.
Growth is attributed to softening of raw material prices and a better product mix.
![]() EBITDA was Rs. 128.4 cr. grew by 25.9% with a margin of 21.7%.
EBITDA was Rs. 128.4 cr. grew by 25.9% with a margin of 21.7%.
![]() EPS grew by 29.3% YoY to Rs. 2.0
EPS grew by 29.3% YoY to Rs. 2.0
Business Highlights
US Market
![]() US & North America Formulation business reported growth of 29.8% YoY to Rs. 250.9 cr. in Q1FY25, on account of incremental revenue from new product launches, and increase in the share of existing customers .
US & North America Formulation business reported growth of 29.8% YoY to Rs. 250.9 cr. in Q1FY25, on account of incremental revenue from new product launches, and increase in the share of existing customers .
![]() 32 products are in the pipeline, of which 20 are oral solids and 12 are ointments and creams. Within
32 products are in the pipeline, of which 20 are oral solids and 12 are ointments and creams. Within
oral solids, 4 are Softgels
UK and Europe Market
![]() Revenue of Rs. 251.5 cr. from the UK and Europe Formulation business in Q1FY25, registering a growth of 11.3%.
Revenue of Rs. 251.5 cr. from the UK and Europe Formulation business in Q1FY25, registering a growth of 11.3%.
![]() Planning for 34 new filings over next three years. In addition, 16 products are already filed and awaiting approval.
Planning for 34 new filings over next three years. In addition, 16 products are already filed and awaiting approval.
Australia and New Zealand Market
![]() Australia and New Zealand business reported revenues of Rs. 65.6 cr. in Q1FY25, which grew by 12.0% YoY, due to incremental market share.
Australia and New Zealand business reported revenues of Rs. 65.6 cr. in Q1FY25, which grew by 12.0% YoY, due to incremental market share.
![]() 10 products are in the pipeline and expected to be launched over two years.
10 products are in the pipeline and expected to be launched over two years.
RoW Market
![]() RoW business reported Rs. 22.7 cr. revenues in Q1FY25
RoW business reported Rs. 22.7 cr. revenues in Q1FY25
Other Highlights
![]() In Q1FY25, the capex incurred was Rs 31.0 cr. Capex investment is in line with our plan for scaling the acquired manufacturing unit from Teva Pharma in Goa which will drive our future growth.
In Q1FY25, the capex incurred was Rs 31.0 cr. Capex investment is in line with our plan for scaling the acquired manufacturing unit from Teva Pharma in Goa which will drive our future growth.
![]() Cash Balance at the end of 30th June 2024 is at Rs 691 cr.
Cash Balance at the end of 30th June 2024 is at Rs 691 cr.
![]() In Q1FY25, Cash from Operations was at Rs 45.3 cr. and Free Cash Flow was at 14.3 cr.
In Q1FY25, Cash from Operations was at Rs 45.3 cr. and Free Cash Flow was at 14.3 cr.
![]() Research & Development (R&D) spend at Rs.12.0 Cr., 2.0% of consolidated revenue.
Research & Development (R&D) spend at Rs.12.0 Cr., 2.0% of consolidated revenue.
![]() Received Market Authorization from UKMHRA for products Levonorgestrel 1.5mg Tablets, Rasagiline
Received Market Authorization from UKMHRA for products Levonorgestrel 1.5mg Tablets, Rasagiline
1mg Tablets and Olmesartan 10, 20, 40mg Tablets during the quarter.
7 Likes
YOY quite satisfactory results. But topline could have been better takings into account TEVA.
will have to ask how much is TEVA’s contribution for this quarter.
3 Likes
USFDA issues Establishment Inspection Report for observation made on April inspection and issues VAD- voluntary action indicated, which is good news for company. No further action needed and issue has been closed.
4 Likes
Marksans Pharma Ltd
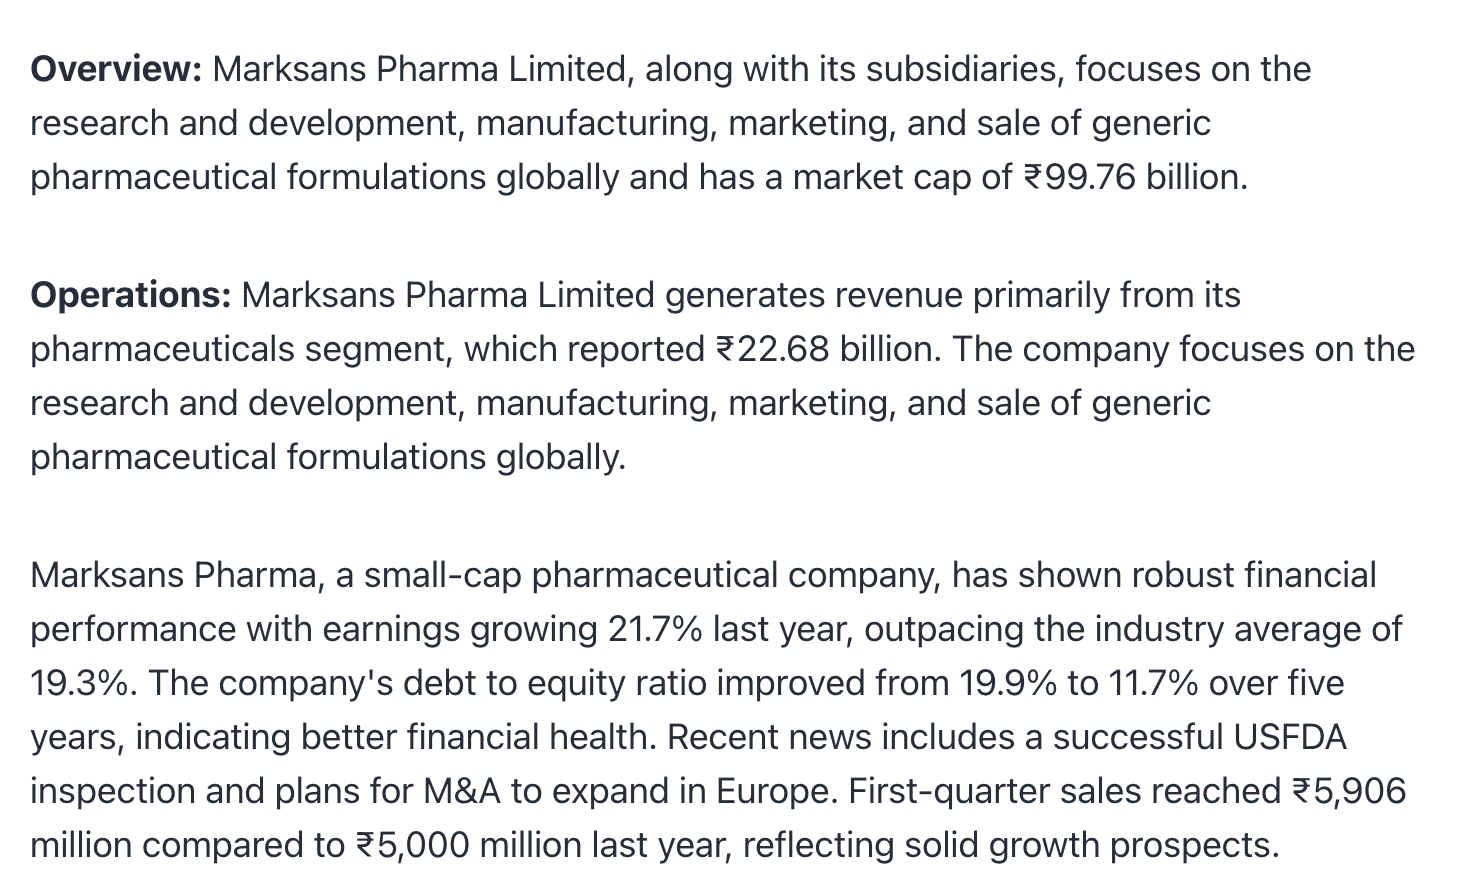
Marksans Pharma (established in 2003) is into OTC and prescription based pharma co having presence in USA, UK, Australia and New Zealand and ROW. It manufactures tablets, gels and ointments for pain management, cough and cold and cardio-vascular therapeutic segments via its 4 manufacturing plants.
| Date of report: | 03-09-2024 | Industry PE | 32.14 | Sector | Pharma Industry |
|---|---|---|---|---|---|
| CMP: | 246 | Current PE | 33.54 | No of Years | 21 |
| Market Cap: | 11164Cr | Highest PE | 94.6 (2017) | Key Products | Pain Management |
| ROCE / ROE | 20.6% / 16.5% | Lowest PE | 6 (2020) | Key Competitor | Dr. Reddy Laboratory |
Business Model and Industry Analysis
Overview:
Geography: Companies 94% revenue comes from regulated markets of US, UK, Australia and Canada. It has also started to expand itself in Middle East and thus increasing revenue from RoW. Co generates higher margin in UK compared to US. In UK it sells majorly OTC products along with few high end prescription drugs. In US, sales is driven through OTC by forming partnership with large wholesalers like Walmart and Target.
Product: Co deals in 2 segments namely OTC (over the counter) and prescription drugs. OTC contributes around 74% of revenue. In OTC segment, pain management and cough and cold segments contributes majority of revenue. Marksans’ OTC segment is 80% revenue from store brands and 20% from own labels. Prescription segment comprises of Cardiovascular system, oncology, anti diabetic and anti biotic segment
Industry Growth:
Industry is poised to grow at 4.5% CAGR till 2029 for OTC and prescription drugs in USA and UK
Capacity Utilisation:
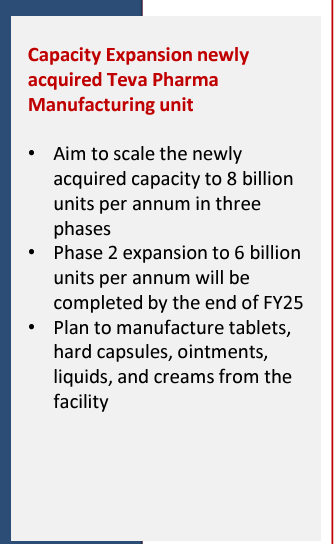
Marksans has 4 manufacturing plant. 2 in Goa one in UK and one in USA. In goa, Teva is a recently acquired plant which has breakeven in Q1 FY25. Teva plant will contribute to revenue and this contribution will continue to increase Q on Q. Teva plant can manufacture tablet, ointment liquid and creams with scalable capacity to 8Bn units. It is currently 40% utilised. Other goa plant can manufacture 2.4 Bn capsules and 6bn tablets. USA plant can manufacture 6bn tablets and capsules. UK facility can manufacture 2Bn bottles, 1Bn tubes and 1Bn sachet. All plants are at 65% utilisation
Opportunities:
- Expanding OTC Business : Marksans still have a lot of scope to capture multi billion dollar OTC business. It is the most preferred and growing store brand low – cost manufacturing partner
- New Product Launches: Co has maintained 2% of sales expenditure to R&D which has enabled new product launches. Co has healthy pipeline of more than 76 products.
- Backward Integration: The co is in the process of Backward Integration and API manufacturing for captive consumption for its top 4 molecules
- Forward Integration: Co is focusing on inorganic growth by acquiring established marketing and distribution companies in growing markets to improve profit margins
Risk:
- Competitive Industry: Stiff competition as there is pressure from new as well as existing players. The co offsets this risk by strong R&D expenses and launching new products
- Regulatory Risk: As 94% revenue is from regulated markets, any adverse govt policy in US and UK will impact the revenue of company. Further increasing prices in such markets is difficult
- Currency Fluctuations: As the co revenue is from export markets, it faces huge currency risk.
Future Expansion:
- Teva Expansion: The co is set to expand its Teva Facility to 8 bn units to help achieve 3000 cr sales target. Plan is to manufacture tablets, hard capsules, ointments, liquid and cream from the facility
- Inorganic Expansion: With its healthy cash reserve, Marksans is aggressively evaluating inorganic growth opportunities. The focus is to acquire distribution channels in Europe region or in regions where co can expand its market reach.
Management:
Management is forward looking and has achieved all its commitment given to shareholders. Promoters hold 43.9% unpledged shareholding in NHL.
Institutional Investor:
FII and DII continue to hold around 22.3% in the company
Historical Data and Financials
Profit N Loss Account:
* Sales have grown at CAGR of 17% for last 3 years
* Margins have continuously improved and stands at around **21%** currently
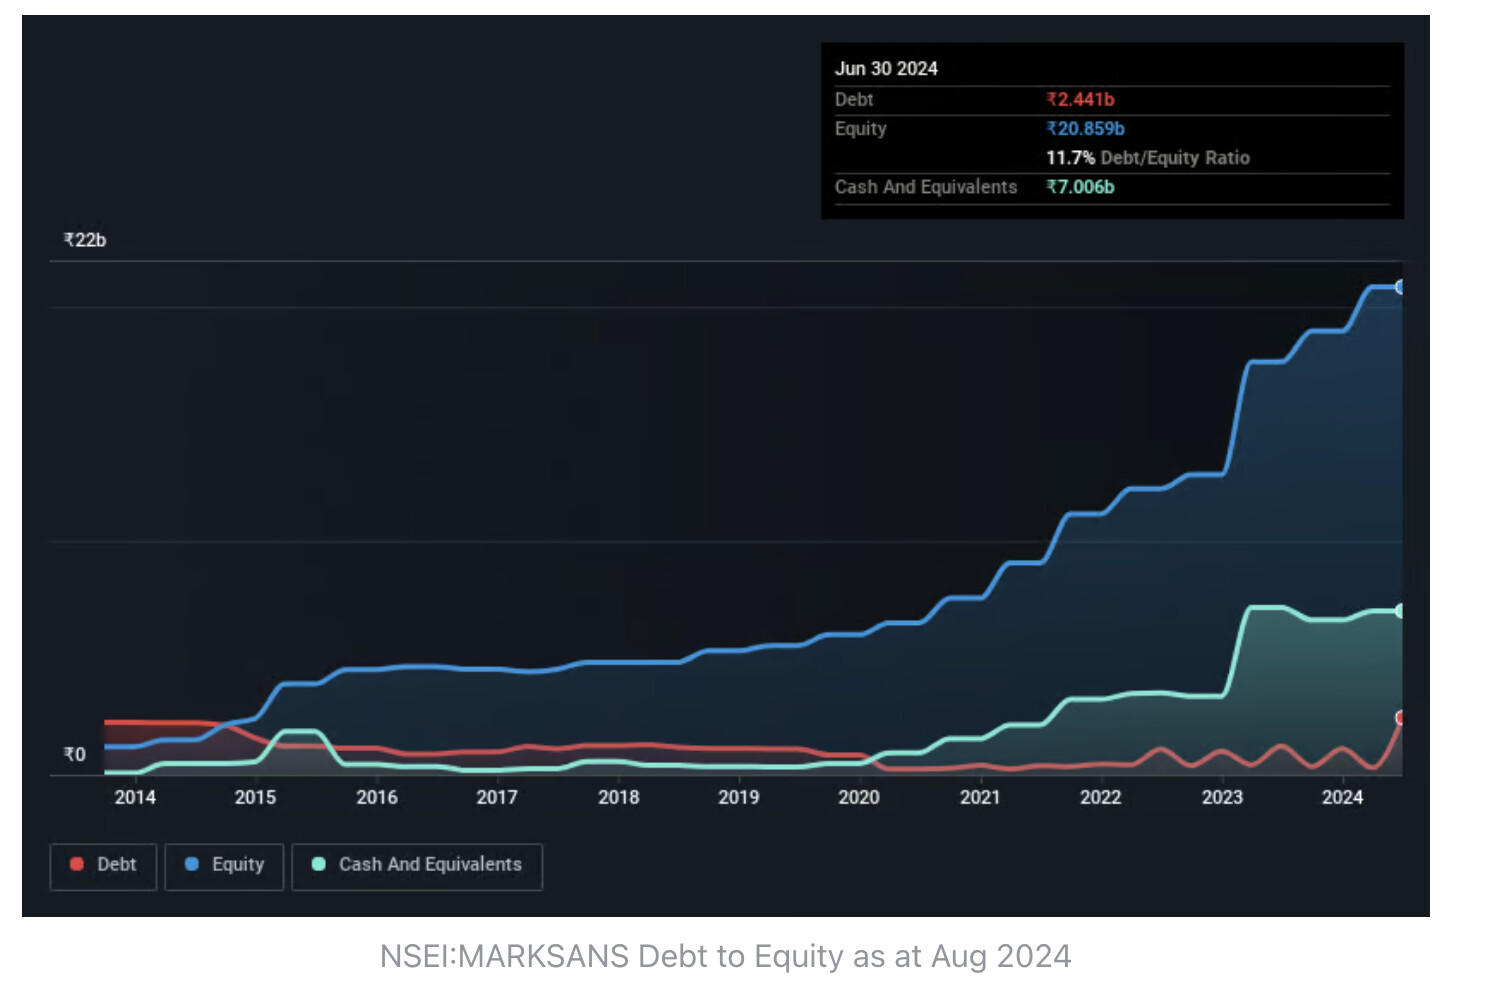
Balance Sheet:
* Interest coverage ratio is **41times**
* Debtor days and Inventory days have improved
* Working Cycle and Cash conversion cycle have improved YoY
* Current ratio stands at 7 times.
Cash Flow:
* Co has a positive CFO always
* Co has sufficient cash reserve to do inorganic acquisition
Valuation:
| Particular | Current | 52W High | 52W Low | Historical High | Historical Low | Industry Median |
|---|---|---|---|---|---|---|
| Price | 246 | 246 | 101 | 246 | 1.72 | - |
| PE Ratio | 33.54 | 33.54 | 15.9 | 94.6 | 6 | 32.14 |
| EPS | 7.37 | 7.37 | 6.71 | 7.35 | 0.27 | - |
| Price/Book | 5.3 | 5.3 | 2.4 | 32 | 0.8 | 3.67 |
| EV/EBITDA | 19.7 | 19.7 | 3.4 | 40.2 | -4.3 | 19.98 |
| Particular | FY24 | FY25E | FY26E | Comments |
|---|---|---|---|---|
| Sales | 2177 | 2500 | 3000 | Management has guided to reach 3000 cr revenue in 2 years |
| PAT Margin | 14.5% | 15.4% | 15.4% | Expanded margin are sustainable as per mgmt. |
| PAT | 315 | 384 | 461 | |
| EPS | 6.9 | 8.4 | 10.1 | |
| PE Ratio | 33.22 | 33.22 | 33.22 | Current PE ratio |
| Share price | 230 | 280 | 336 |
Disclaimer: This is a study report, not for any decision making or investment advisory.
Made by: Nidhi Devidan
Date:3rd September 2024
12 Likes
Please do it for Websol Energy and Kaynes Technology.
1 Like
This sheet is very helpful for me. Thank you so much