
I have been collecting one number from every listed bank’s own results material for a while now: the CASA ratio, quarter by quarter, back to June 2022 where the bank’s deck or press release has it. There is no thread here that looks at deposits across banks, only inside individual bank threads, so starting one. Liability side first; the asset side can come later.
Every figure below is from the bank’s own investor presentation or press release. Where a bank reports average CASA instead of period-end (ICICI), I have marked it.
1. Sector Definition & Scope
Listed scheduled commercial banks in India: public sector, private, and small finance banks. The thread is about the liability franchise: how much of a bank’s deposits sit in current and savings accounts (CASA), what the rest costs, and what that does to margins.
Out of scope: NBFCs, payments banks, and asset quality (that belongs in the bank threads).
2. Why This Sector, Why Now
Two things happened in four years.
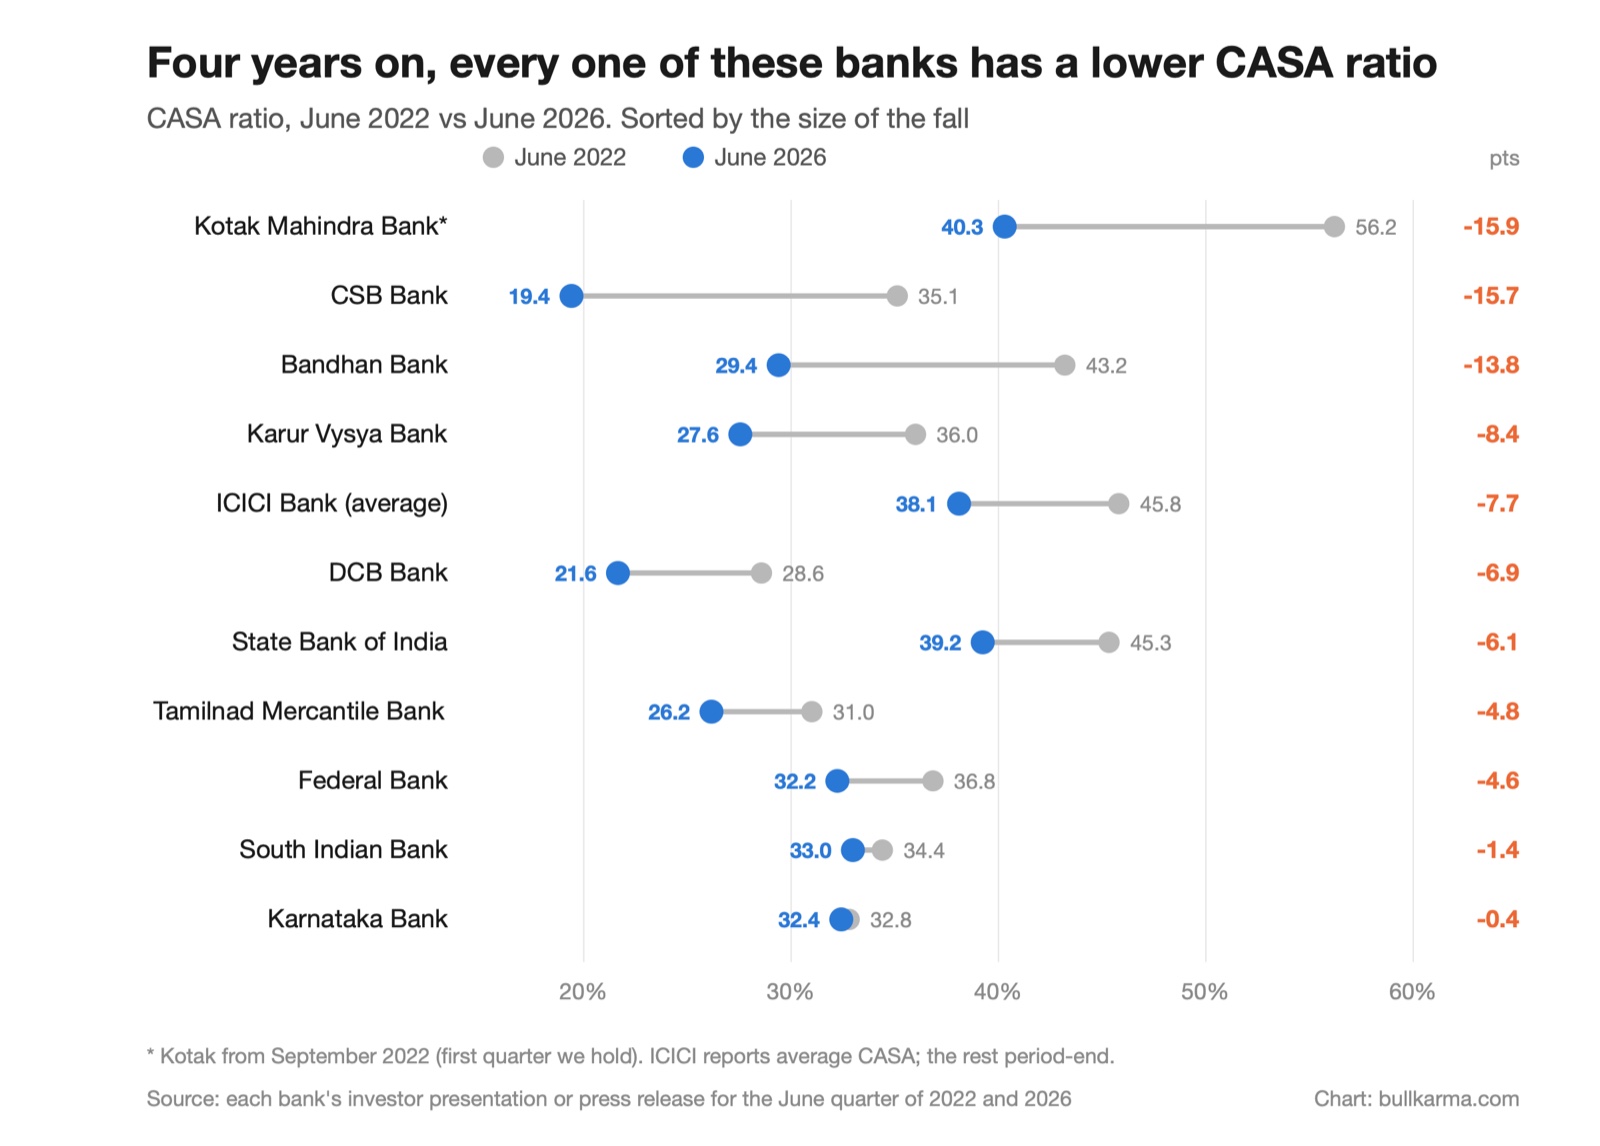
- The great migration out of CASA. After RBI took the repo rate from 4.0% (May 2022) to 6.5% (Feb 2023), savings money moved to fixed deposits. Every one of the 11 banks I have June 2022 and June 2026 numbers for has a lower CASA ratio now. Kotak lost about 16 points (from September 2022), CSB about 16, Bandhan about 14. Even SBI is 6 points lower.
- In the last year the slide mostly stopped. Across 24 banks, June 2025 to June 2026, the median change is −0.2 points. Fourteen are lower and ten are higher, and the range is −4.1 to +3.3. So it is no longer a cycle story where everyone goes down together. It is bank by bank now.
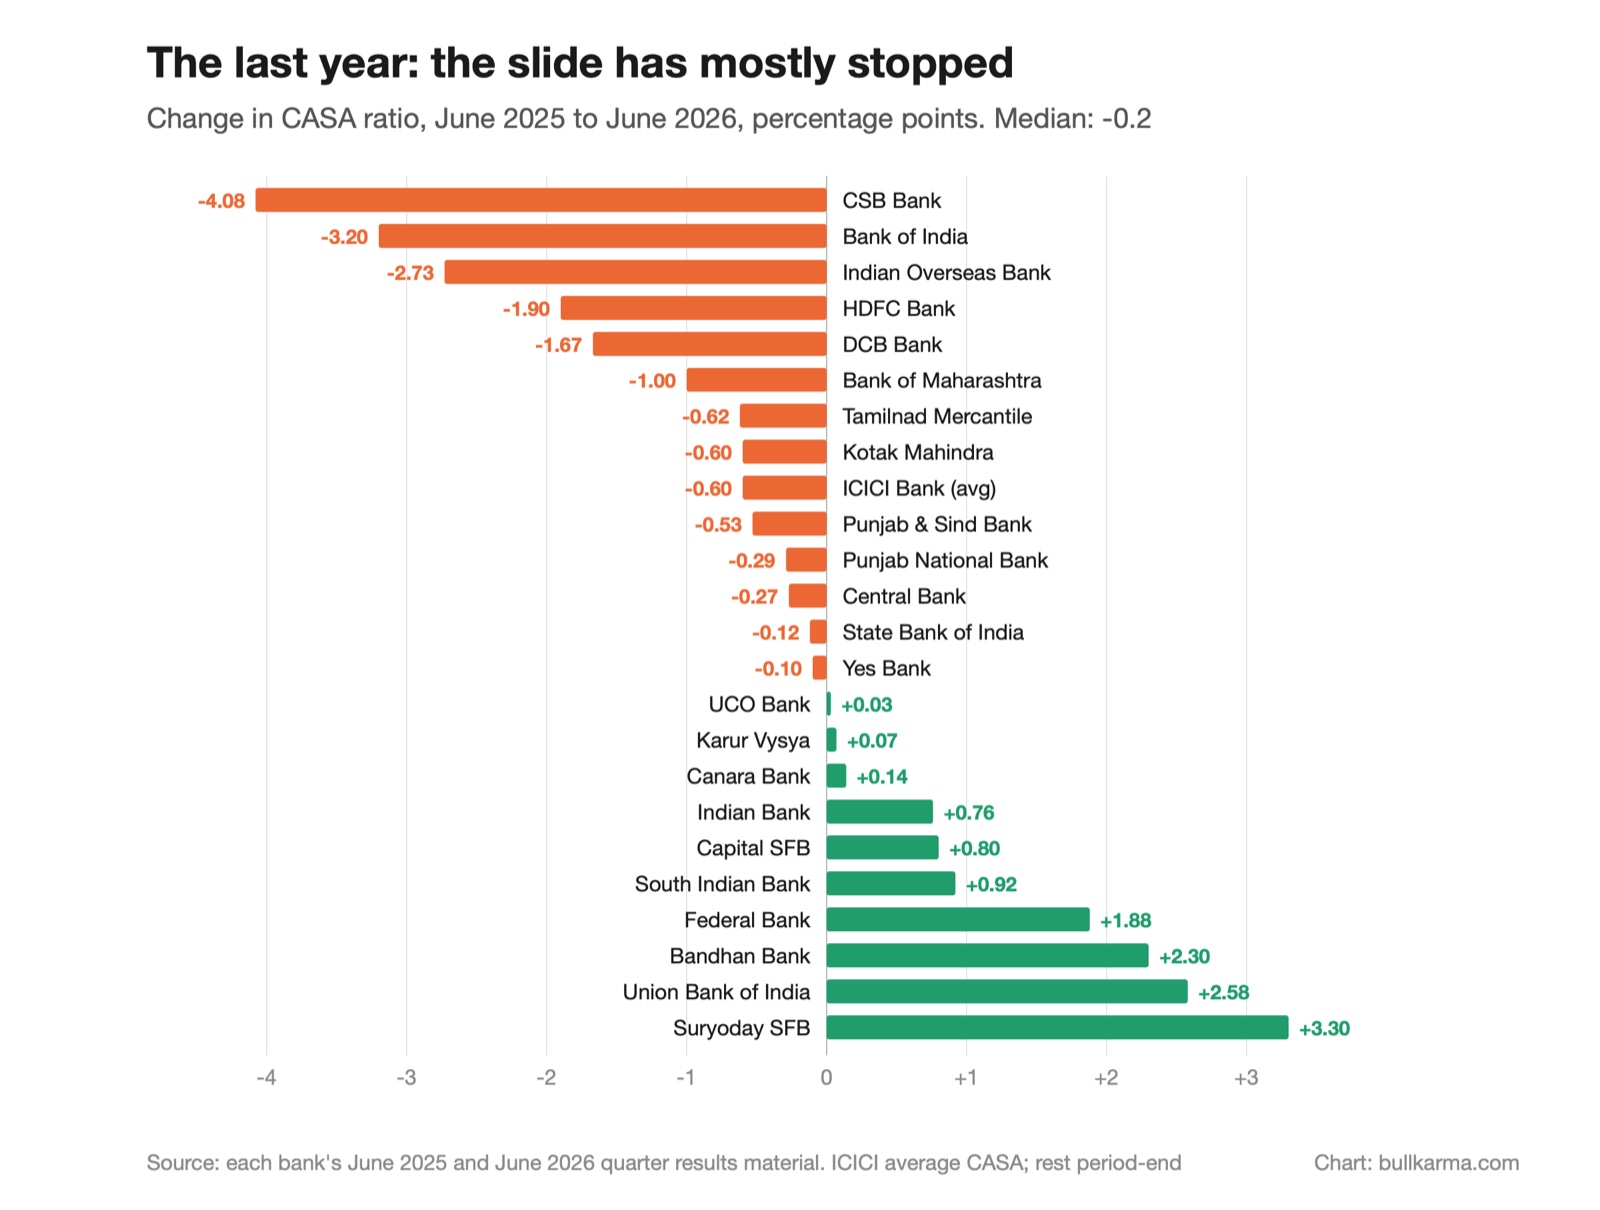
What I take from this: the 2022–24 fall was the rate cycle. Whatever a bank does from here is mostly its own doing: branches, the salary and current-account business, the product mix it lends to.
3. Value Chain Map
For a bank the “value chain” is the funding stack. It runs from cheapest to dearest:
| Source | What it is | Cost to the bank | Stickiness |
|---|---|---|---|
| Current accounts | Business float, zero interest | Lowest | High, but tied to transaction banking |
| Savings accounts | Household balances | Low | High for salary/primary accounts |
| Retail term deposits | FDs below the bulk limit | Market rate | Medium; reprices on renewal |
| Bulk deposits | ₹3 Cr and above per deposit | Market rate, often higher | Low; first to leave |
| Certificates of deposit / borrowings | Wholesale market | Highest | Lowest |
Who holds pricing power: the bank with a big salary/current-account base and a large branch network. That is why the older PSUs and the big retail franchises (SBI, ICICI, Kotak) sit at 37–50% CASA, while the younger and smaller banks sit at 19–30%.
5. Demand Drivers (what moves CASA)
- Interest rates. When FD rates rise, idle savings money moves to FDs. This was the 2022–24 story.
- Branch network and age of the franchise. PSUs with decades of branches (Central 46.6%, Bank of Maharashtra 49%, IOB 41%) keep high CASA without trying.
- Transaction banking. Current accounts follow payments, cash management and government business.
- Loan growth outrunning deposit growth. A bank that grows loans faster than its CASA has to fill the gap with term and bulk money. CSB is the clearest case: in the year to June 2026, deposits grew 26% (₹35,935 Cr → ₹45,415 Cr) but CASA deposits grew 4%.
7. Unit Economics
This is the part I found most interesting. A high CASA ratio is one way to a good margin, not the only one.
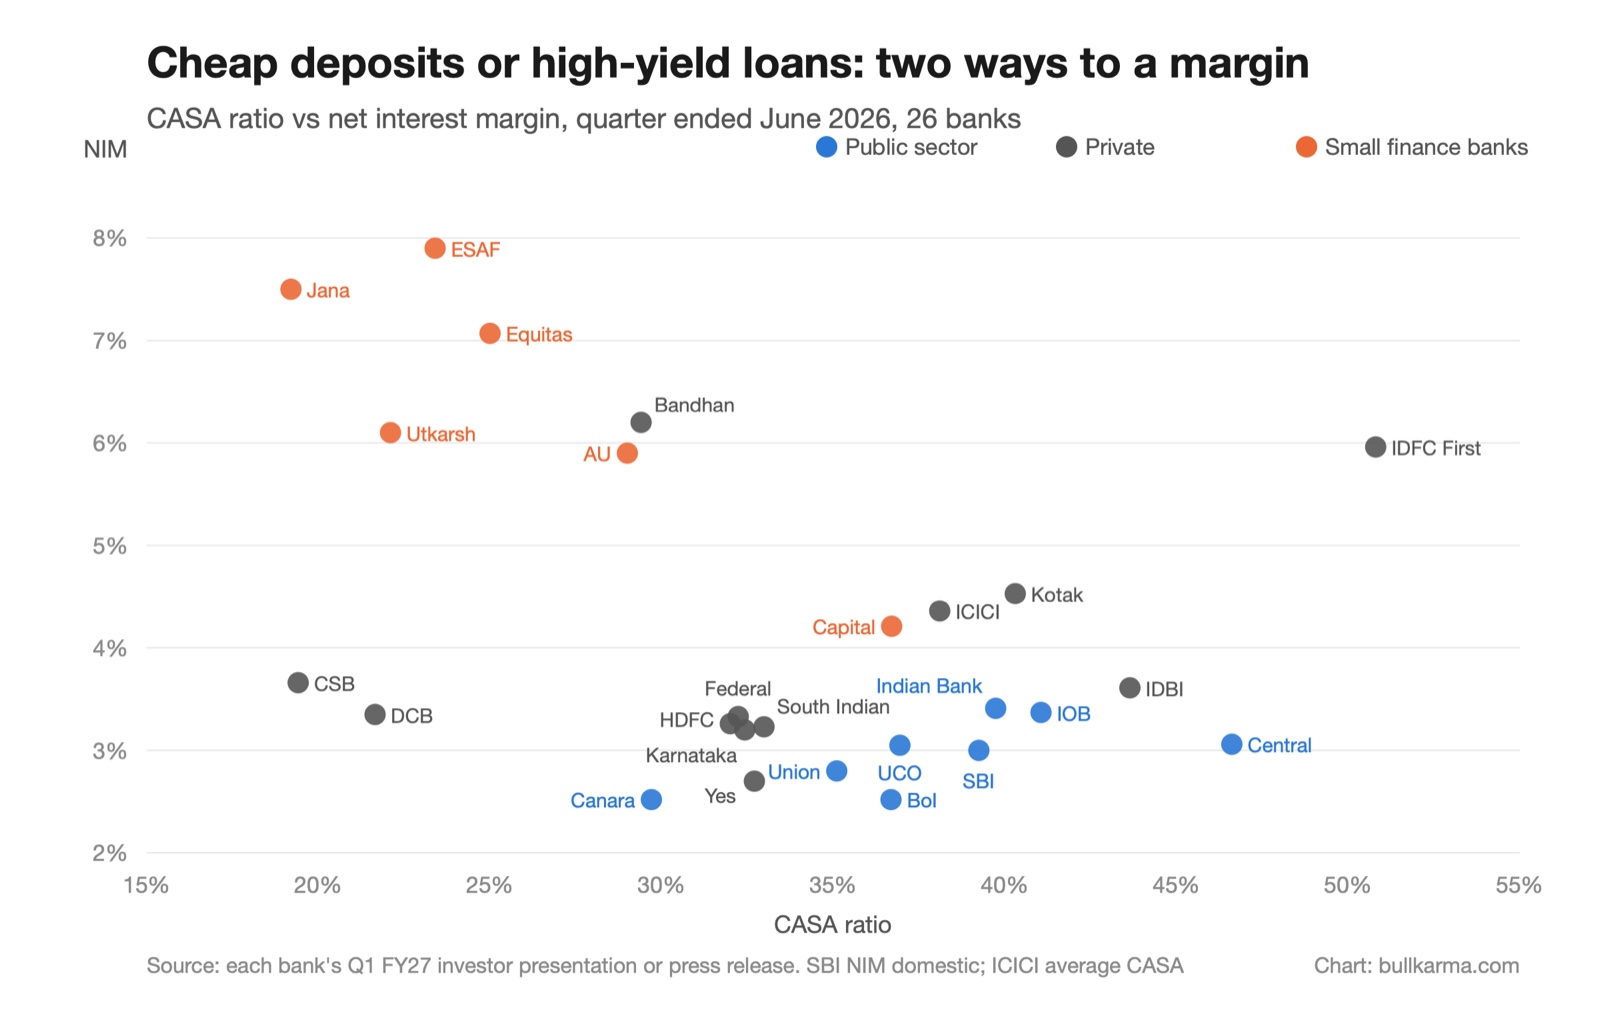
- Top right (cheap money, good margin): Kotak (40.3% CASA, 4.53% NIM), ICICI (38.1% average, 4.36%), IDFC First (50.8%, 5.96%).
- Bottom right (cheap money, thin margin): most PSUs. SBI 39.2% CASA but 3.00% domestic NIM; Bank of India 36.7% and 2.52%; Central 46.6% and 3.06%. Cheap deposits, but lent at low yields.
- Top left (costly money, fat margin): the small finance banks. Jana 19.2% CASA and 7.5% NIM, ESAF 23.4% and 7.9%, Equitas 25.0% and 7.07%. Expensive deposits, but loans at microfinance and small-business yields.
- Bottom left (costly money, ordinary margin): CSB (19.4%, 3.66%) and DCB (21.7%, 3.35%). This is the uncomfortable corner.
An example of the mechanism: CSB’s cost of deposits went from 4.14% to 6.45% between H1 FY23 and H1 FY27, and its half-year NIM from 5.38% to 3.73% (Q2 FY27 deck, slides 23–24). It held there only because the gold-loan book (12.33% yield) kept growing. Details in the CSB thread.
So a falling CASA ratio matters most for a bank that cannot lend at high yields. For a microfinance or gold lender it is a cost of doing business. For a bank lending to corporates and home buyers it goes straight to the margin.
8. Regulation & Policy
- Repo rate cycle: 4.0% → 6.5% (May 2022 – Feb 2023), then cut by 100 bps to 5.5% between Feb and Jun 2025 (RBI MPC statements). Deposit rates follow with a lag, and term deposits reprice only on renewal, so the cost of deposits moves slower than the repo.
- Bulk deposit definition: single rupee term deposits of ₹3 Cr and above for scheduled commercial banks. Banks can price these freely, which is why they are the swing source of funding.
- Anything on liquidity coverage rules that changes how deposits are treated is relevant here. Will add as people point it out.
9. Listed Universe
Sorted by market cap (23 Oct 2026). CASA for June 2022 and June 2026, and NIM for the quarter ended June 2026, each from the bank’s own results material for that quarter. “–” means I do not have a verified figure yet.
| Bank | Type | Mcap (Rs. Cr) | CASA Jun-22 | CASA Jun-26 | Change (pts) | NIM Jun-26 | VP Thread |
|---|---|---|---|---|---|---|---|
| HDFC Bank | Private | 10,68,201 | 45.8%¹ | 32.0% | −13.8 | 3.26% | link |
| ICICI Bank | Private | 10,01,008 | 45.8% (avg) | 38.1% (avg) | −7.7 | 4.36% | link |
| State Bank of India | PSU | 8,84,943 | 45.3% | 39.2% | −6.1 | 3.00% (dom.) | – |
| Kotak Mahindra Bank | Private | 4,28,257 | 58.1% | 40.3% | −17.8 | 4.53% | link |
| Axis Bank | Private | 3,79,093 | 43% (avg) | – | – | 3.46% | link |
| Punjab National Bank | PSU | 1,38,341 | 46.3% | 36.7% | −9.6 | – | link |
| Union Bank of India | PSU | 1,36,565 | 36.2% | 35.1% | −1.1 | 2.80% | – |
| Bank of Baroda | PSU | 1,19,351 | 44.2% | – | – | 2.93% | – |
| Indian Bank | PSU | 1,12,761 | 41.3% | 39.7% | −1.6 | 3.41% | link |
| Canara Bank | PSU | 1,05,365 | 34.3% | 29.7% | −4.6 | 2.52% | – |
| Federal Bank | Private | 84,294 | 36.8% | 32.2% | −4.6 | 3.33% | link |
| IDBI Bank | Private | 82,191 | 55.7% | 43.6% | −12.1 | 3.61% | – |
| AU Small Finance Bank | SFB | 69,854 | 39% | 29.0% | −10.0 | 5.90% | link |
| IndusInd Bank | Private | 65,058 | 43.1% | – | – | 3.57% | link |
| IDFC First Bank | Private | 62,343 | 50.0% | 50.8% | +0.8 | 5.96% | link |
| Bank of India | PSU | 59,650 | 44.7% | 36.7% | −8.0 | 2.52% | – |
| Bank of Maharashtra | PSU | 57,945 | 56.1% | 49.0% | −7.1 | – | – |
| Indian Overseas Bank | PSU | 55,307 | 43.1% | 41.1% | −2.0 | 3.37% | link |
| RBL Bank | Private | 53,632 | 36.0% | – | – | 4.13% | link |
| Yes Bank | Private | 49,595 | 30.8% | 32.7% | +1.9 | 2.70% | link |
| Karur Vysya Bank | Private | 32,510 | 36.0% | 27.6% | −8.4 | – | link |
| UCO Bank | PSU | 27,123 | 39.3% | 36.9% | −2.4 | 3.05% | – |
| Central Bank of India | PSU | 26,095 | 51.2% | 46.6% | −4.6 | 3.06% | – |
| Bandhan Bank | Private | 24,178 | 43.2% | 29.4% | −13.8 | 6.20% | link |
| South Indian Bank | Private | 13,771 | 34.4% | 33.0% | −1.4 | 3.23% | link |
| Punjab & Sind Bank | PSU | 12,921 | 34.0% | 30.1% | −3.9 | – | – |
| Tamilnad Mercantile Bank | Private | 12,677 | 31.0% | 26.2% | −4.8 | – | link |
| Karnataka Bank | Private | 11,369 | 32.8% | 32.4% | −0.4 | 3.20% | link |
| Equitas SFB | SFB | 7,502 | 51.7% | 25.0% | −26.7 | 7.07% | link |
| DCB Bank | Private | 6,434 | 28.6% | 21.7% | −6.9 | 3.35% | link |
| CSB Bank | Private | 5,411 | 35.1% | 19.4% | −15.7 | 3.66% | link |
| Jana SFB | SFB | 4,054 | –² | 19.2% | – | 7.50% | link |
| Utkarsh SFB | SFB | 2,130 | –² | 22.1% | – | 6.10% | – |
| ESAF SFB | SFB | 2,006 | –² | 23.4% | – | 7.90% | – |
| Suryoday SFB | SFB | 1,409 | 20.9% | 21.0% | +0.1 | – | link |
| Capital SFB | SFB | 1,177 | –² | 36.7% | – | 4.21% | link |
Each bank is on its own reported basis: ICICI and Axis report quarterly-average CASA; PNB, Indian Bank, Canara and UCO report domestic CASA to domestic deposits in both years (Bank of Baroda’s and Bank of India’s June 2022 figures are domestic too); Suryoday excludes certificates of deposit; the rest are period-end. Kotak’s June 2022 figure is from its Q1 FY23 deck (the four-year chart above starts from September 2022, the first quarter I had then).
¹ HDFC Bank before its merger with HDFC Ltd (July 2023), which brought in a large non-CASA balance sheet, so the two years are not like for like.
² Listed after June 2022.
10. Key Monitorables
| What to track | Why | Latest |
|---|---|---|
| CASA ratio, every quarter | The cheap-money share | Table above |
| CASA growth vs total deposit growth | Tells you if the ratio is falling because CASA shrank or because term money grew faster | CSB: deposits +26%, CASA +4% (Jun-26 YoY) |
| Bulk share of term deposits | The least sticky money | CSB: 46% → 52% (Sep-25 → Sep-26) |
| Cost of deposits vs NIM | Whether the funding cost is reaching the margin | CSB: CoD 6.43%, NIM 3.81% (Q2 FY27) |
| Repo rate and FD rates | The tide under all of it | RBI |
12. Where Are We in the Cycle
The first September-quarter numbers are in for a few banks, Sep-25 → Sep-26:
- HDFC Bank 34.0% → 31.6%
- RBL Bank 31.9% → 27.2%
- CSB Bank 21.2% → 19.0%
- Federal Bank 31.0% → 32.0%
- South Indian Bank 31.9% → 31.6%
- Karur Vysya Bank 27.7% → 27.5%
Mixed again, the same as June. I will add the rest as banks report and keep the tables in this post current.
Questions for the thread:
- With rates cut in 2025, should CASA have started coming back by now? The June and September numbers do not show a broad recovery yet. Is the lag just term deposits running off, or has the household habit changed for good?
- For the PSUs, high CASA but low NIM. Is that tightly priced corporate lending, or the large low-yield investment book, or both?
- Anyone tracking the current-account side separately from savings? Most decks give only the combined ratio.