Thank you for your valuable analysis. However, if we look at that slide, it is also mentioned that variable costs are growing at 16% and fixed costs at 9%. Right now, the bank does need to spend some money to bring in business, which is why channel sourcing expenses are higher.
But if a bank wants to grow at a normal pace, why would it spend so aggressively?
The point is—because the loan book is growing at 20–21%. If costs grow only at 12–13%, then logically, why shouldn’t the bank achieve a 15% ROE?
Earlier, Opex was growing at ~29.4% annually, and now it has already come down to 12–13% annual growth.
So if the loan book grows at 21–22% and Opex grows at just 12–13%, why wouldn’t profits increase? And why wouldn’t ROE cross 15%?
In my view, we should give this bank another 1–2 years, because the real impact of 22% growth with 12–13% Opex growth will become clearly visible over the next 1–2 years. At that point, even Vineet ji may have to reconsider his POV on IDFC First Bank.
This quarter, QoQ NII growth is 7.4% and YoY is 12%. The next 3–4 quarters are going to be very interesting. When the real NII growth of nearly 30–32% starts showing up, the profit “blast” will be far more exciting to watch.
Disclaimer : I am try to paint a broad top view picture of the efficiency of the bank. This is a very simplified version and as a Bank has many different business lines, my goal is only to highlight the operational inefficiencies.
Loan book as of the end of the September quarter: ₹2,66,579 crore
Loan book as of the end of the December quarter: ₹2,79,428 crore
Sequential increase in loan book: ₹12,849 crore (approximately ₹13,000 crore)
As there will be payment of EMIs and maturities of existing loans, the total new loan disbursements are unlikely to exceed ₹20,000 crore (this is a high end estimate, the actual figure is likely lower).
To achieve approximately ₹20,000 crore in new loan disbursements, the bank incurred operating expenses of ₹5,680 crore during the quarter.
Within this amount:
Channel sourcing expenses (19%) + volume-linked expenses (25%) = ₹2,500 crore
(This represents approximately 44% of the total operating expenses of ₹5,680 crore.)
Thus, the bank is incurring ₹2,500 crore in channel sourcing and volume-linked costs to generate around ₹20,000 crore in new loans. This is an exceptionally high figure and indicates significant inefficiencies in loan origination.
A well run bank typically generates a substantial portion of its loan book organically through its own employees and branch network, minimizing reliance on external channel partners and commissions.
I can understand these expenses in first 5 years of the bank, when they did not have a brand. It is just unacceptable anymore.
I also understand that a portion of these expenses may also support deposits , still the overall efficiency remains concerning. Spending ₹5,680 crore in operating expenses to achieve only ₹13,000 crore in net loan growth (with gross disbursements estimated at up to ₹20,000 crore) reflects poor cost discipline and operational leverage.
This reliance on external entities for loan origination is opposite to how banks like HDFC Bank grew in first 20 years of their journey. They built their portfolio largely through strong internal origination by its employees.
I have presented a very simplified and approximate calculation solely to illustrate the scale of the figures involved.
It is by no means precise and I do not claim full accuracy.
Just to provide more clarity , I have added a clarification to my previous post stating that these are rough estimates. My objective was to offer a broad, top level view of the apparent inefficiency rather than being perfectly accurate.
To elaborate further on the point:
Even assuming that roughly 50% of the new loans are still originated internally by the bank’s own employees and branches, this would imply that approximately ₹10,000 crore of the estimated ₹20,000 crore in disbursements came through external channel partners.
Roughly Rs 10,000 cr from external agencies, so the 2500 cr figure will show you the size of hole. Generally Loan origination fee for third parties is around 3-5 %. Here it is coming to 25 % of new loans.
So all the Fast tags, credit cards , wealth management fee all are tucked in here
The primary intent here is to highlight the unusually high dependence on external entities for loan origination and the outsized cost this appears to entail.
But please look at it this way, each era has different challenges. Most people had trouble trusting Private banks during that era. There were bank collapses like Global Trust Bank which made things worse. Moreover Banks have many more new business lines like Wealth management and Credit cards which were next to nothing back then.
My core point remains, when running a business Return on Equity (ROE) is one of the most critical metrics. I can appreciate a temporarily low ROE during a 3 or 4 year transition or growth phase.
However, sustaining subdued ROE for over a decade, with projections indicating it will still not reach 20% in the foreseeable future, is difficult to justify, regardless of the external context or headwinds.
I understand the context is much larger than the simplified way I am putting it.
But what disappoints me most is the same guy achieved 20 % ROE at Capital first and here even for next 3 years we wont hit that target.
Your estimate of disbursements is extremely low. For example, the run off from segments like 2 wheeler loans, microfinance, etc is as much as 20% of the loan book each quarter. For segments like consumer financing, the run off will be even higher. The actual disbursement in Q3 would be in the 50000 cr to 60000 cr range.
Channel sourcing costs is around 1060 crores (19% of operating expenses). That is the money spent on originating around 50000 cr to 60000 cr of loans + new deposits + half a million new credit cards + a million new fastag accounts.
Another 1400 crores (25% of opex) was spent on collection cost, Risk Containment Unit cost, credit administration cost, DICGC premium, credit card reward cost, UPI & RTGS charges etc.
Lets compare with Federal bank, which has 1600 branches doing 5.65 trillion business (loans + deposits). IDFC has 1100 branches doing 5.65 trillion business. So, average branch of IDFC is doing 45% more business than average branch of Federal Bank. That gets even more interesting when you take into account that average branch of IDFC may be 2.5 years old, while average branch of Federal may be 25 years old (Federal is 100+ year old bank). And it gets even more interesting wnen you realise that IDFC has much higher proportion of retail business (which is opex heavy), while Federal has a substantial portion of wholesale business (which is opex light). The granularity of both loans and deposits is much higher for IDFC than Federal. That’s a choice that IDFC has made - which comes with upfront costs, but long term benefits.
Naturally, IDFC will have to rely more on channel sourcing partners than Federal bank. But as IDFC branches mature, the reliance on channel sourcing partners will come down. In fact, this was explicitly discussed in the Q3 earnings call, where the management said that in most segments origination of loans by branches is growing at 35% to 40%, while the loan book is growing at 20%.
“Channel sourcing expenses” CORRECTION: These expenses are NOT amortised for Banks as they are still accounted for under Indian GAAP; while NBFCs amortize as they have moved to IND AS - which aligned with IFRS. Hence my earlier conclusion was wrong; and correcting for it.
If a Bank lends of Rs 20,000 crores then its “gross profit” is its NIM. At 5.7% annual** it should be (should be marginal NIM but can’t get too exact) 285 cr**. So all its expenses will fall well below that.
How much a bank has grown its quarterly loan book can be arrived at by looking at average loan maturity from its ALM table in the AR and some adjustments to the product mix disclosed quarterly. It is very unlikely to be 60,000 crores; meaning the loan book turns over every year - can’t happen if you just eye ball slide 25 of the current presentation.
Growth in Loan book does not translate into growth in Income and is a fallacious assumption. This can be seen in the numbers q-o-q Income is higher than q-o-q loan but 12.75% only vs 20.9% loan growth y-o-y. Corporate loans / other loans automatically reprice with changes in base rates; non-interest income can vary substantially. Typically fee income related to wealth is invariant at the first degree to changes in rate environment.
Should we also include trading gains while calculating the Cost to Income (C2I) ratio?
Trading gains are largely under the bank’s control. A bank can manipulate C2I by booking profits from its mutual fund portfolio or by doing profit booking.
For example, in Q1 FY26, trading gains were ₹495 crore, whereas in the last two quarters they were only ₹56 crore and ₹96 crore.
So the question is: should trading gains be added while calculating C2I?
If we exclude trading gains, even then the C2I ratio is still around 74%.
But if next year the bank shows inflated trading gains, then can’t the C2I ratio be manipulated, since trading gains are not consistent every quarter?
This aspect definitely needs to be thought through more carefully.
Out of topic question:
Can we mention our city names — like which city we all belong to?
I belong to Kanpur Nagar, Uttar Pradesh.
Banks do not hold mutual funds. trading gains come from treasury ops.
on the earlier comment - i would strongly recommend you to put numbers in spreadsheet and try to extrapolate, its fairly easy. RoE is not just a function of opex and revenue - its a function of many things - which includes interest margin, provisions, and size of equity. all of these can easily be done on spreadsheet. it will help you eventually if you do it at your end.
Dear RaghuG, these calculations are very wrong. the disbursements are much higher than what you are assuming.
also, you can easily find the DSA/channel sourcing cost by you tube - just type IDFC DSA comission - you will find it 1%. so for every loan they disburse - they pay 1% - hence real NIM is not whats being suggested in ppt - some part of NIM cost is parked in opex.
for all boarders - they can eaily find a quarter in history when loan growth was minimal - you will find C2I around 67-68% in that quarter. which further proves - that C2I is elevated only because of growth.
and this growth is a two edged sword - it comes with higher cost for IDFC plus it depleted Tier 1 capital because RoE is less - hence further fund raise.
this growth helps in posting good profit number in future - but will not help in creating higher RoE and higher EPS.
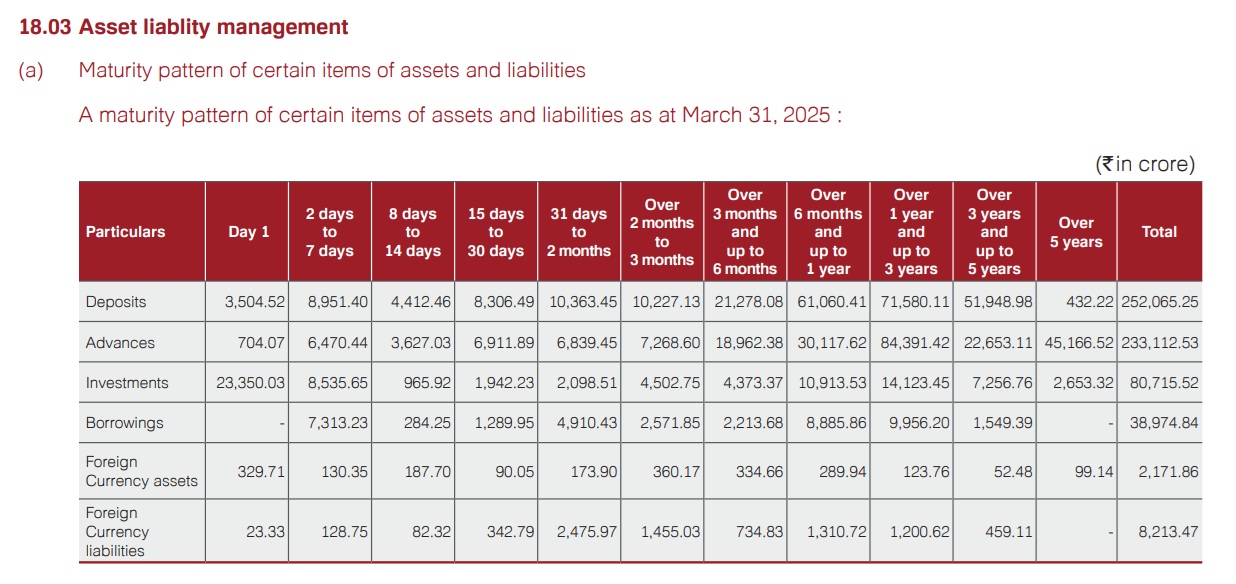
As of 31st March 2025, around 32000 crore of loans (advances) out of 2.33 trillion loan book would mature in the next quarter. Adjusting for current loan book size, the disbursements in Q3 FY26 would have been around 51000 crores.
NIM is calculated on total assets and not on funded assets (loans) alone. So, on loans, the gross margin would be slightly higher than 8% in Q3FY26. That is to say that the 51000 crore loans disbursed in Q3 will make a grosss margin of around 4100 crores.
In treasury operations, the income earned on funds deposited by banks with the RBI is referred to as treasury income or treasury profit. However, I am specifically talking about trading gains, such as gains from government bonds, forex trading, futures & options, equities, and corporate bonds.
These are activities where the bank itself decides when to buy and sell, and the resulting profit is not fixed. There can be both profits and losses. In some periods, the gain may be ₹500 crore, while in others it may be only ₹50 crore.
Given this volatility, how can such trading gains be added to C2I (Cost to Income ratio) while calculating it? In fact, depending on the trading gains or losses in a particular period, C2I can also be manipulated,
I have done financial modelling of IDFC numbers till FY29 ,with reasonably conservative estimates. You can find it attached with this post. It shows that C2I will be 66% by end FY27, 62% by end FY28, and 57% by end FY29.
RoE will be 10%, 13.5% and 17% by end FY27, FY28, FY29 respectively.
And there would be no need to infuse fresh equity capital - around 2000 cr tier-2 bonds could be raised in FY28 and FY29 each. So worries about further equity dilution are quite exaggerated.
These estimates are conservative because I have used the last 4 quarters as a base year for forecasting forwards. Note that the last 4 qauraters had the lowest NIM (5.7%) and highest credit cost (2.3%) in the last 5 years. If I had used a good year like FY24 for forecasting forwards, then the future numbers would look a lot lot better.
Of course, if there is some systemic shock like covid or demonatisation - then these projections may not pan out well. Otherwise these projections are reasonably east to meet.
The financial model Excel sheet is very easy to tinker with. Those who wish to try out their forecasts, can easily do so by using this excel sheet.
This is useful info. A rational assumption would be that the quantity of loan that matured in Q2 FY 26 would bear the same proportion to Total Advances that it bore end of FY 25. So that would be about 10.5% over Rs 32,000 cr; or around 36,000 cr.
True about NIM - thanks for correcting me. My calculations however show NIM to be around 6.65% (not 8%) for just the Loans and Advances portion.
Here’s how:
Total Interest Earned outside of Investments (incl IBPC) and Cash Balances = Rs 8,776 cr (Financial Statement)
Total Interest Expended: Rs 4,295 cr (Financial Statement)
Average Assets outside of Cash / Investments: 269,277.5 cr (slide 39 of Presentation)
NIM from Assets excl Funded Assets: ((8776-4295)/269277.5)*4=~ 6.65%.
My post above also made another mistake of not dividing the incremental NII by 4 as NIM is annualised