“We initiate coverage on Hariom Pipe Industries (Hariom) with a BUY and a target price of Rs785, offering 62% upside. Hariom is poised for an exceptional growth trajectory, fueled by a ramp-up in capacity, accelerated galvanized product sales via its established dealer network, and favorable industry dynamics. The company’s backward-integrated model stands as a testament to its strategic execution and is primed to scale effortlessly with rising capacities. The tandem mill further cements Hariom’s market edge of production of sub-2mm pipes, a true differentiator. With a turbocharged combo of improving cash conversion cycle, rising return ratios, debt-to-equity metrics, and resilient margins, Hariom is set for robust growth and a deserved re-rating.”
Hariom Pipes struggles with inventory management, with 124 inventory days compared to industry peers APL Apollo (38 days), JTL Industries (31 days), and Hi-Tech Pipes (48 days), based on the latest fiscal data. This trend has been consistent across previous years. Should this raise concerns?
Although high, it cant be compared to the mentioned businesses as Hariom has a lot of backward integration. Can be compared to someone like Shyam Metalics (~90 days)
Hariom’s business model will always have higher inventry days because of backward integration (they need to keep inventory at various stages such as Iron Ore, Sponge Iron, Billets/strips, MS Tubes etc. whereas APL Apollo, JTL, Hi-tech etc. only needs to keep inventory of Billets and MS Tubes as they are not backward integrated)
However, this higher inventory is compensated by higher EBITDA margin for Hariom. Hariom has 12% EBITDA marings vs 5-6% for other players.
Hence, this is not a concern but a basic element of business model.
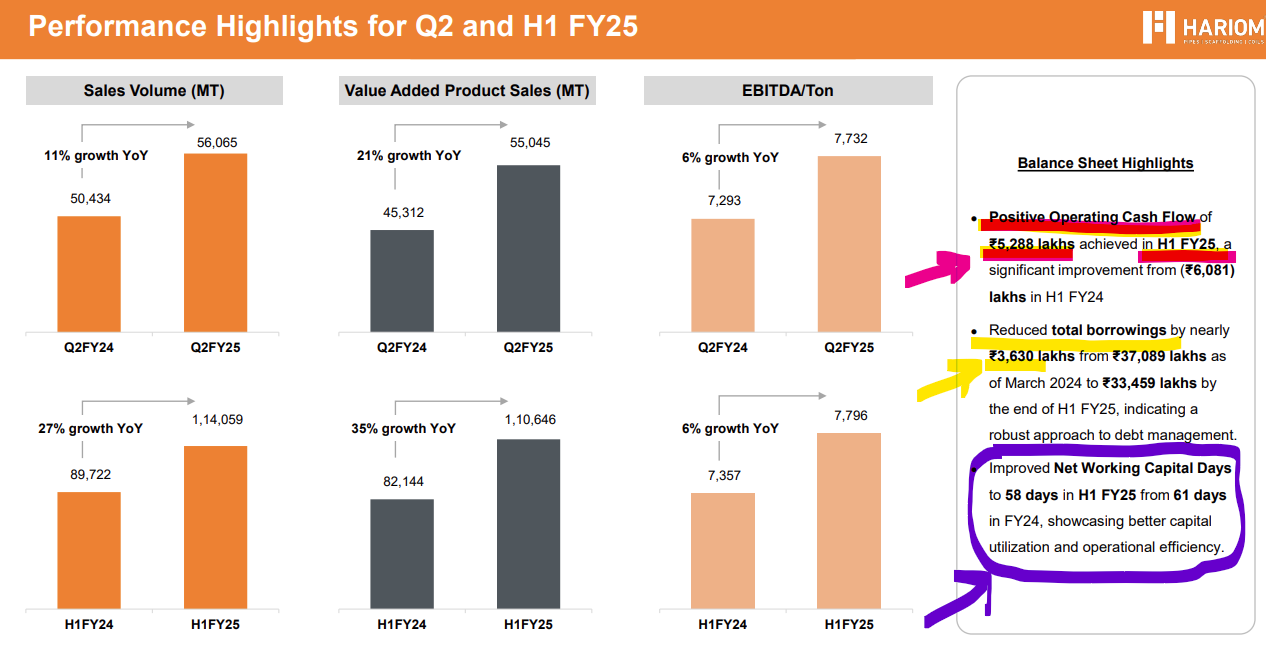
One needs to track CFO, which has turned positive of 53 crores in H1FY25
Also need to track improvement in net WC days from current levels
I had an opinion regarding the related party acquisition of Ultra Pipes.
As per the Crisil report (Rating Rationale)
FY23 revenue was ~ 105cr. Hariom paid 40cr to acquire its operating assets. This roughly implies GFA turn of 2.6x
Compared to this, Hariom generated 644 cr in revenue in FY23 and had GFA turn of 4.5x.
And the last fact to note is that Ultra Pipes revenue declined from 175cr in FY22 to 105cr in FY23 whereas Hariom’s revenue increased from 431cr to 644cr.
Keeping these in mind:
Did promoters overpay for Ultra Pipes’ asset? This can be a smart way to take money out of the listed entity.
Shouldn’t the asset turn of Ultra pipe be higher than that of Hariom’s because Ultra is involved in only value added products? This further strengthens the prior argument and raise the next argument.
Since Hariom sells its products (billets, coils) to promoters’ other unlisted entities, Hariom can optically show faster revenue growth by selling products at higher prices. This will deteriorate financials of unlisted entity but can optically show faster top line growth. If any one has looked into what are promoters other holding entities with which related party transactions happen, it’ll be great to get your views.
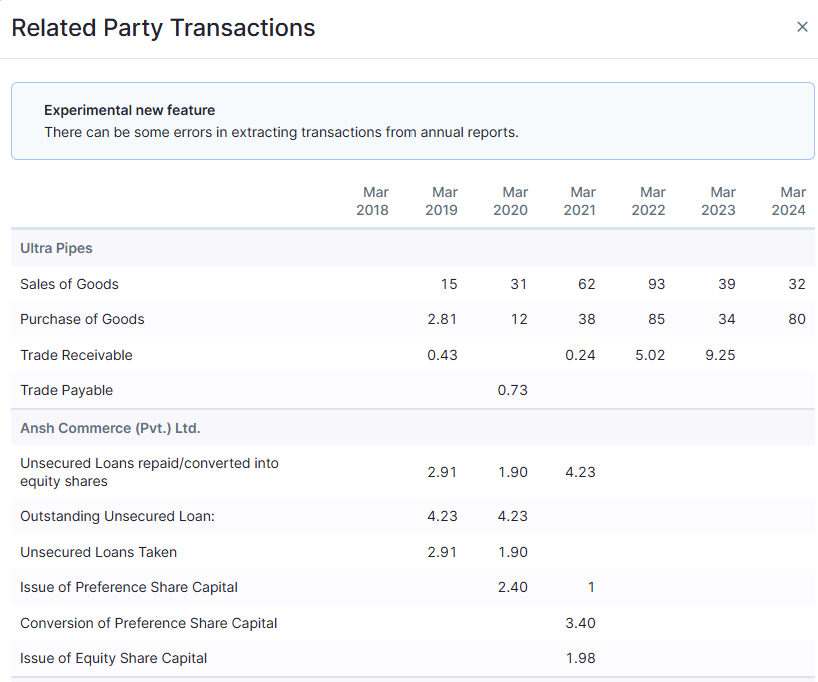
It seems that Ultra Pipes was the key related party with which Hariom had transactions in the past (see below extract). This has now been merged with listed co.
Aprt from this, doesnt seem to have any other RPTs. Others please highlight if you see any other related party tsransactions?
Good points, but I’ll counter:
1.) The FY22 number was 175 Cr in OI. Wouldn’t that mean that the GFA turn for Ultra Pipes will be >4x at better utilization?
2.) Hariom’s FY23 GFA turn wasn’t 4.5x, it was lower; unless you take FY22 closing as the GFA base. But then they recorded sales from GI/GP in FY23, so I’d rather average out the GFA base.
3.) Finally, they were net buyers from Ultra pipes in FY24 and only had 5.5Cr of net sales to Ultra in FY23 and ~7.5Cr in FY22. If you take those out, the impact on revenue growth is <200bps. So, it doesn’t seem like a case of artificially propping up numbers.
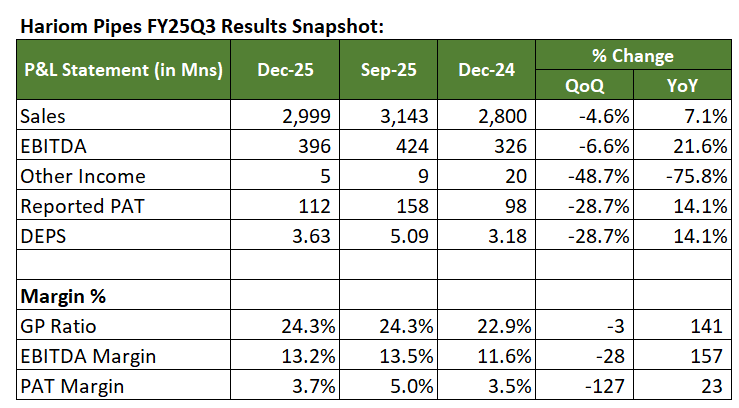
The Q3 results are not in line with management guidance and it seems extremely unlikely the management will be able to achieve their FY 26 guidance. They have expanded the capacity significantly and clearly the utilitsation has not matched up. Would love to hear on the management call tomorrow if they have a supply problem or a demand problem. Overall, disappointing results.
Does anyone have the transcript of the concall that happened this week? Not referring to audio recording but i need the transcript. Very difficult to hear / use audio recording to efficiently track the numbers etc mentioned in call.
Total volume target for FY25: 2,38,000 metric tonnes (20% volume growth)
Galv products: 86,934 metric tonnes till nine months FY '25 comparatively to 62,876 metric tonnes in nine months FY '24.
FY24 9M sales around 1,38,567 metric tonnes , FY25 9M almost 1,71,254 tonnes
Management is saying that the guidance of 4 lakh metric tonnes of volume and Rs. 2,500 crores of revenue will take 3-4 months more than earlier estimate.
Co has 9.5% market share in the 0.3 mm and to 2.5 mm Indian steel pipe segment as reported by CARE.
Steel price correction is expected to be at bottomline and Prices to improve slowly going forward, as per management.
Galvanized product expected to see 30% growth.
Operating cashflow expected to be same as Q2 i.e. 52CR.
Total debt: 409 CR. Long term: ~120CR (reduced from 133CR in Q2).
Geo expansion plan:
Actively working on expanding our dealer network, particularly in Gujarat and Maharashtra.
Focus is on increasing penetration in Tier-2 and Tier-3 cities, while also strengthening B2B partnership with construction, automotive and solar power industries, fan industries, some government enterprise also where we have already started to supply the material, automobile sector.
Recently introduced galvanize product segment will help us to cater in new industries and markets.
Pipes and Tubes segment: As per CARE, total pipe segment almost 96 lakh pipes demand, out of which almost 15% are below 0.5 mm to 2.5 mm requirement. Hariom has 9.5% market share in this segment. Expect to grow in this segment in Tier 2 and 3 cities.
VAP EBITDA Rs. 6,500 to Rs. 6,700 last year. Rs. 7000 this 9M.
Product EBITDA:
MS Tubes: 8600
Scaffolding: 11500
GP Pipes, coil: 6500
Backward integrated for MS Tubes but not for GP Pipes.
15% total volume sales to B2B
Management is working to reduce the working capital requirement. Expect the working capital days to reduce by 12-14 days by this year.
Getting the dealer finance from PSU banks and trying to get from private banks.
Trying to increase raw material credits.
Management targetting 3Lac MT (+/-10%) volume for FY26, which means 10% vol growth next year.
Comments:
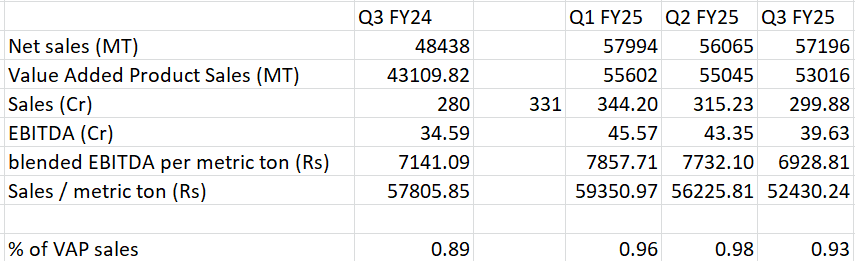
Blended EBITDA per ton reduced by 3% YOY and 10% QOQ. This is mainly because of reduced market value of steel.
Expecting a flat to 10% growth YOY Q4, given yearly target of 235Lac MT.
The reason management give now for (to be) missed sales target for this year is that the cost of steel is not in their control but volume is. I see even volume is not as per their guidance of revenue.
Earlier management had mentioned that the sales of 270 Lac tonnes to be done in FY25. The same they are targeting in FY26 now, which means they can achieve the sales of 1860Cr in FY26 even if we consider 62K realization per ton. Not sure how they can achieve 2500Cr in FY27 which they say now that they can achieve 3-4 months later.
Looks like management is consistently postponing their targets when they realise they cannot achieve their target that predicted.
Same is looking alike for working capital reduction, though they are making genuine efforts.
Seems management is doing good work to improve on OCF. We should expect to see some good result in this areas this year.
The above two points are inconsistent - Earlier guidance was 4 lac volume in FY26 with (2500 crore of rev). Now they are also saying they get to 3 lac volume in FY26. Then it is not possible to get to 4 lac in next 3-4 months.
Company and CFO is all over the place in guidance!
I am unable to get my head around as to how they reported 15% margin in FY20 since it seems they backward integrated in FY21.
(They started making their own sponge iron (through an acq) only in FY21. This is a raw material used to make billets, which in turn is used to make MS pipes)
Moreover, back in FY20, value added sales was sub 50% (90% now) — so again how come the high margin in FY20?
In the absence of backward integration and lower value added sales, one would expect higher margins due to higher commodity prices. But it does not seem to be the reason.
Hope they are not window dressing. If in case any one has looked, would love to understand your views.
Yes i know the ealier guidance was 4 L volume for FY26. I am talking about new guidance which is 4L vol for FY27 and 3L vol for FY26.
What i mean by ‘4L vol will take 3-4 months more than earlier estimate’ is that CFO is now saying that the 4L vol is going to take 3-4 months beyond FY27 which they estimated in Q1.
Seems their guidance is changing quite frequently as per the changing market condition which they are unable to predict beforehand, but at the same time it looks to me that they have not done any due diligence which guiding for revenue or vol.