So what I think is & tried to researcher deeper & found out:
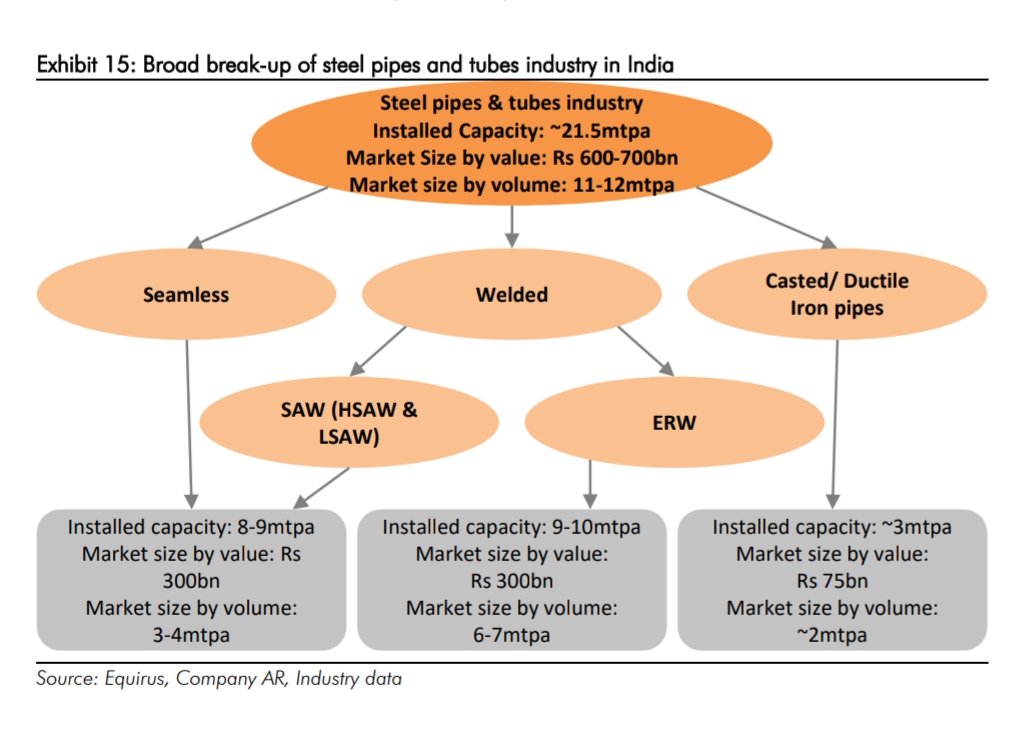
The report from where I took data is of Equirus initiative coverage report on APL Apollo tubes… I tried to go to many companies related to steel tubes company PPT & initiative coverage, but can’t able to verify the data about installed capacity higher than market size (might be it was just estimates & reality would be different as all companies have different estimates)
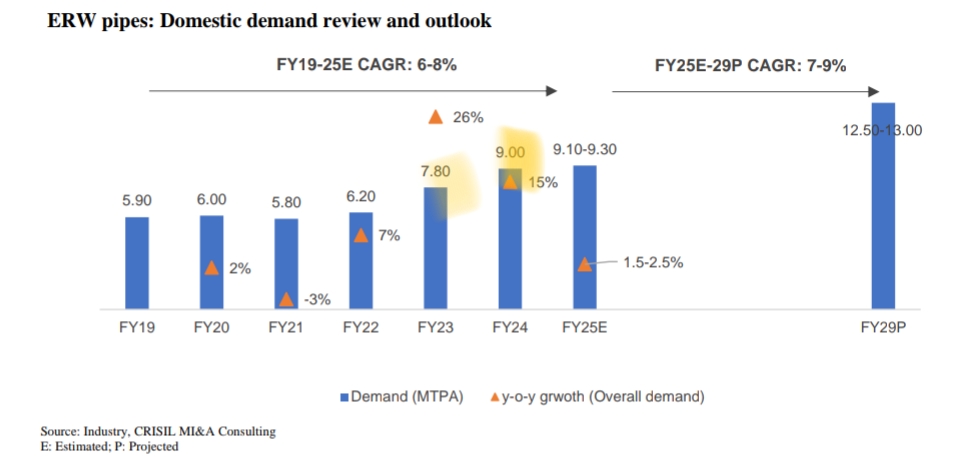
But I can verify data about ERW Pipes segment (where hariom has main focus)
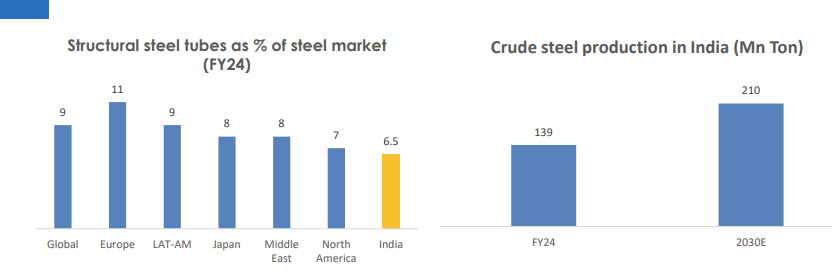
This is from DRHP of Vibhor steel tubes… here it stated as demand for ERW Pipes as of FY25 is 9 mtpa + their would be export market as well, so demand is almost maching installed capacity if Equirus is correct + industry is expected to grow at 7-9% CAGR for next few years (so feel not much over capacity issues in this segment)
So for asset turnover… their asset turnover is lower because they are running at just 35-40% capacity utilisation… from last 3-4 years they are doing Capex & increasing capacity at full pace thatwhy their Asset turnover are lower + their WC cycle was worsen cause of such huge capex
They can match asset turnover of peers once their capacity utilisation reaches above 60%; also they are now Focusing on normalising WC cycle this can lower total assets (lowering inventory & Receivables + paying debt from that) and Asset turnover can increase drastically due to this + Deleveraging can lead to ROE & ROCE inching upward (above 20% can easily possible if management walk the talk)
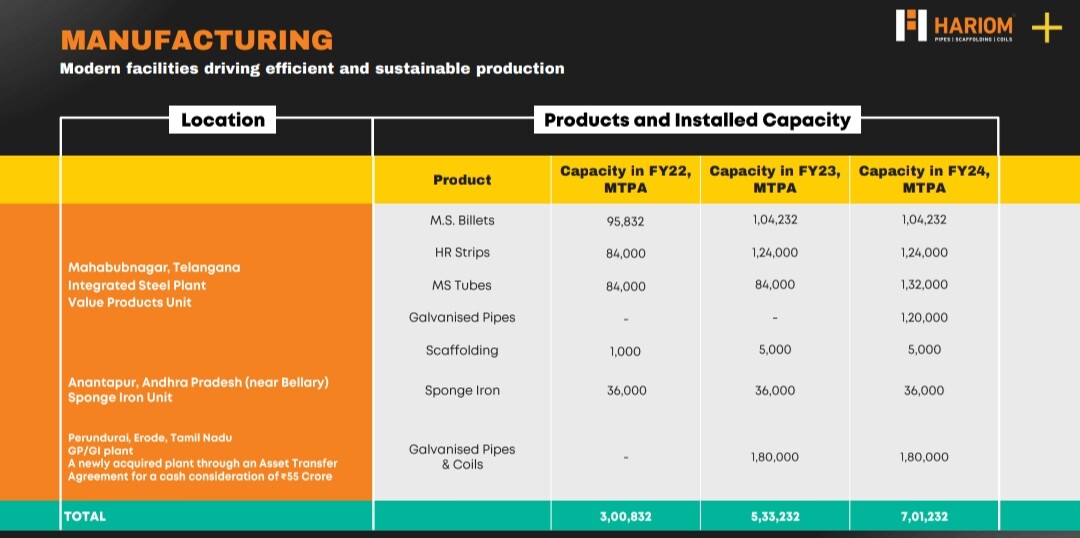
Last 3 yr capacity:
Makes sense for asset turn if the said capacity util is going to increase in future.
However i still fail to understand the dynamics of the market size vs the installed capacity in the space. For ERW, as per your explanation, if the Equirus reports has to be believed, does it not mean that the Hariom capacity alone is equal (if not exceeding) to the FY25 demand, and there are other players on top. So where is room for growth in general for all players, as they would need to compete with each other to gain each other’s market share?? Sorry if i am missing something but this area of supply demand dynamics is not clear yet for me.
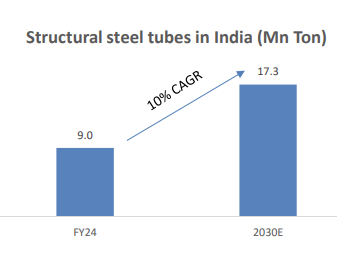
This calculations look incorrect (probably getting confused between “Metric ton” and “Million ton”)
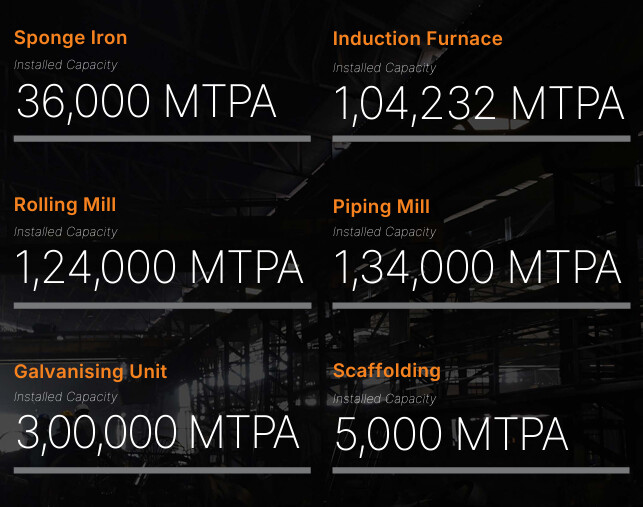
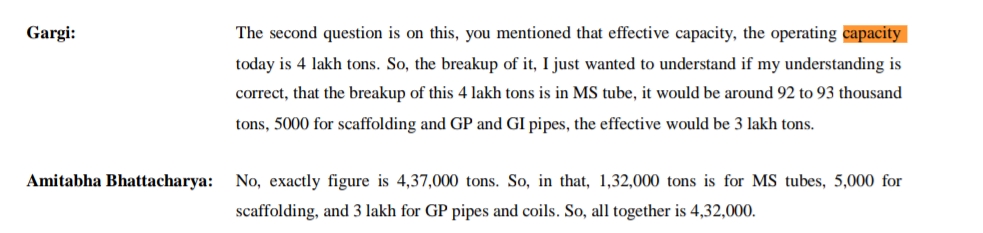
Hariom’s end product capacity is ~4,00,000 ton. Note that gross capacity is ~7,00,000 ton, but this includes intermediate products that are consumed in-house.
Assume 9 mn tons industry sales of structural steel tube (i.e. 90,00,000 tons market size), then market share of Hariom, at full utilisation,would be 4/90 = 4.4% market share
What it would mean would be that few of their products are further used by hariom to make more value added products. As a crude example, say a company manufactures coils that are used in transformers and transformers itself. So this company would use a part of the coils to make the transformers they sell alon with selling some coils to other companies. So while the gross capacity is the capacity of the coils and transformers, the net is less as some of the coils are utilised by the same company
Dear Bansal, as per the Financial report the company has declared capacity of the many stages.
As per best of my knowledge these are the capacity of the individual process and the output of the one process is input for the other process.
Can you clarify which are the revenue generating capacities of the company and what is the utilization capacity of these revenue generating capacities.
Also if you could share me what is the maximum production quantity that the company can produce that can be related to the sales/ revenue part of the business
Thanking you in advance
Disc: Invested in this company
Just Read the latest Concall… your every questions will get answered
But still u had asked me… so I would answer that
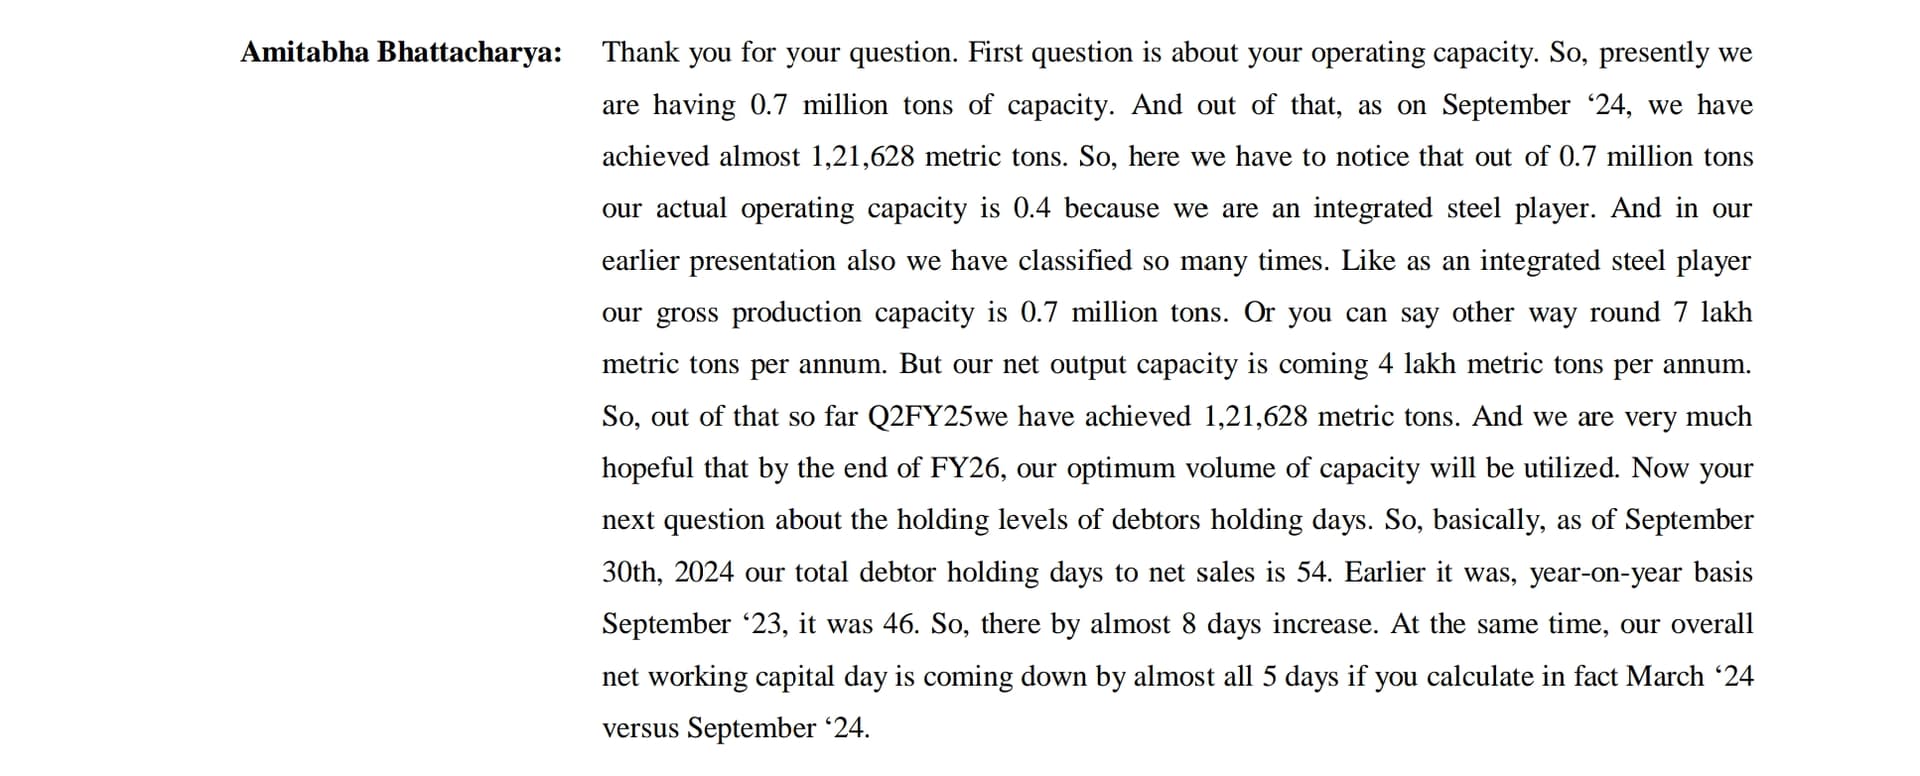
Their total Capacity is 7,01,000 million tonnes and their final capacity i.e. max capacity to produce Pipes is 4,37,000 tonnes… they are currently running at around 30% capacity Utilisation in H1
Their target is to achieve 0.4 million tonnes capacity by FY26 & generate 2500 Cr Revenue from this
One thing to point out as well, the effect of operating leverage will come into play. Interest and depreciation will not pick up the way revenues and gross profits will rise. So all that extra gross profits will go down to the bottom line. So at 13% EBITDA, we could potentially get 325 Cr EBITDA. While interest and depreciation added is 80 cr, lets assume 100 cr. So 225 cr PAT before tax and 175 crore PAT. With the fund raise they could even rest some of the debt, so PAT could come lower and some money for further expansion. So it is potentially trading at 9x FY26 PAT. Now this would change and go upwards with fund raising which is my worry since it is so much relative to the valuation with a lot of dilution. At the very least, I hope the price that they issue securities at is much higher than prevalent prices. Perhaps wait for 800 rs + once their increased revenues help bottom line.
If they hadn’t pay debt & fund raise also don’t happen then on FY26E basis they can clock PAT of 170-180 cr (EPS of around 56)
But let’s say Fund Raise happens, (Share O/S will rise to around 4.25 cr)
First scenario: Debt completely paid off & Rest money used for WC needs then interest saving would be around 40 cr per year, which means PAT addition of 30 cr i.e. 200 cr PAT (EPS of around 47)
Second Scenario: No Debt paired off & whole money used for acquisition to increase capacity further; then PAT would stay at 170 around cr (EPS of around 41)
If we assume market gives 28x PE then stock price would be around 1550 if QIP hadn’t happens and around 1150-1300 if QIP happens (at least 100% upside possibility in 1.5 years (not at all bad))
My understanding says QIP would not happen, but if happens would be used majority for Acquisition to increase capacity & partially for Debt repayment & WC
Institution interest will only drive price (Might be Q3, if would be well then things might get interesting)
No Reco; Invested just my assumptions can be totally wrong
For management to reach its target of 2500cr revenue in FY26, the big assumption is that the current ~30-40% utilisation of the revenue generating capacity will go to 90%+ by FY26. I am unsure if that’s that simple given every player is also increasing their capacity. Does someone have a strong view on their ability to create incremental sales?
If 2500cr topline is achieved, it’s hard to not make money in this stock irrespective of whether QIP is raised or not
Yeah I will closely monitor the growth in Q3 as they have been seriously underperforming the targets in H1 (on account of Monsoon and Elections). Doubling topline in 2 years in a slow overall macro could prove to be a challenge.
Management is confident of the growth but where does the incremental growth come from (more distributors, same distributor growth, etc) . Con call doesn’t have a lot of color on this so I am still skeptical.
When we see latest trend usually there has been Dip in Top line in Q3 in last 2 years. So the probability of achieve this target for FY25 seems very optimistic but I’m very confident that the management can achieve their FY26 target.
The management has been walking the talk since last 1-2 years and these hiccup are normal in business.
I do not agree that the management if walking the talk 100%.
Management had said in Nov 2023 that the depre and finance cost will improve in 2-3 Qs which was dampened by recent capex (due to which they are maintaining higher inventory and RM) and hence high WC cost hence also impacting the CFO. This is still not achieved as of Q2 25.
Doubling the revenue in 2 yrs looks extremely difficult in the given scenario as per my opinion. Though management can achieve some level of growth, quite likely they cannot achieve to double it in 2 yrs. Thats just my gut feeling and would be happy if i am proven wrong.
This happens when a company intended to switch it’s rating agency so one agency gives issuer not supported and other issue rating. Going forward you see only crisil reporting