Hariom Pipes Ltd: A Capex Play!

Detailed Analysis of Hariom Pipe Industries Ltd.

Market Cap: 1600 Cr.

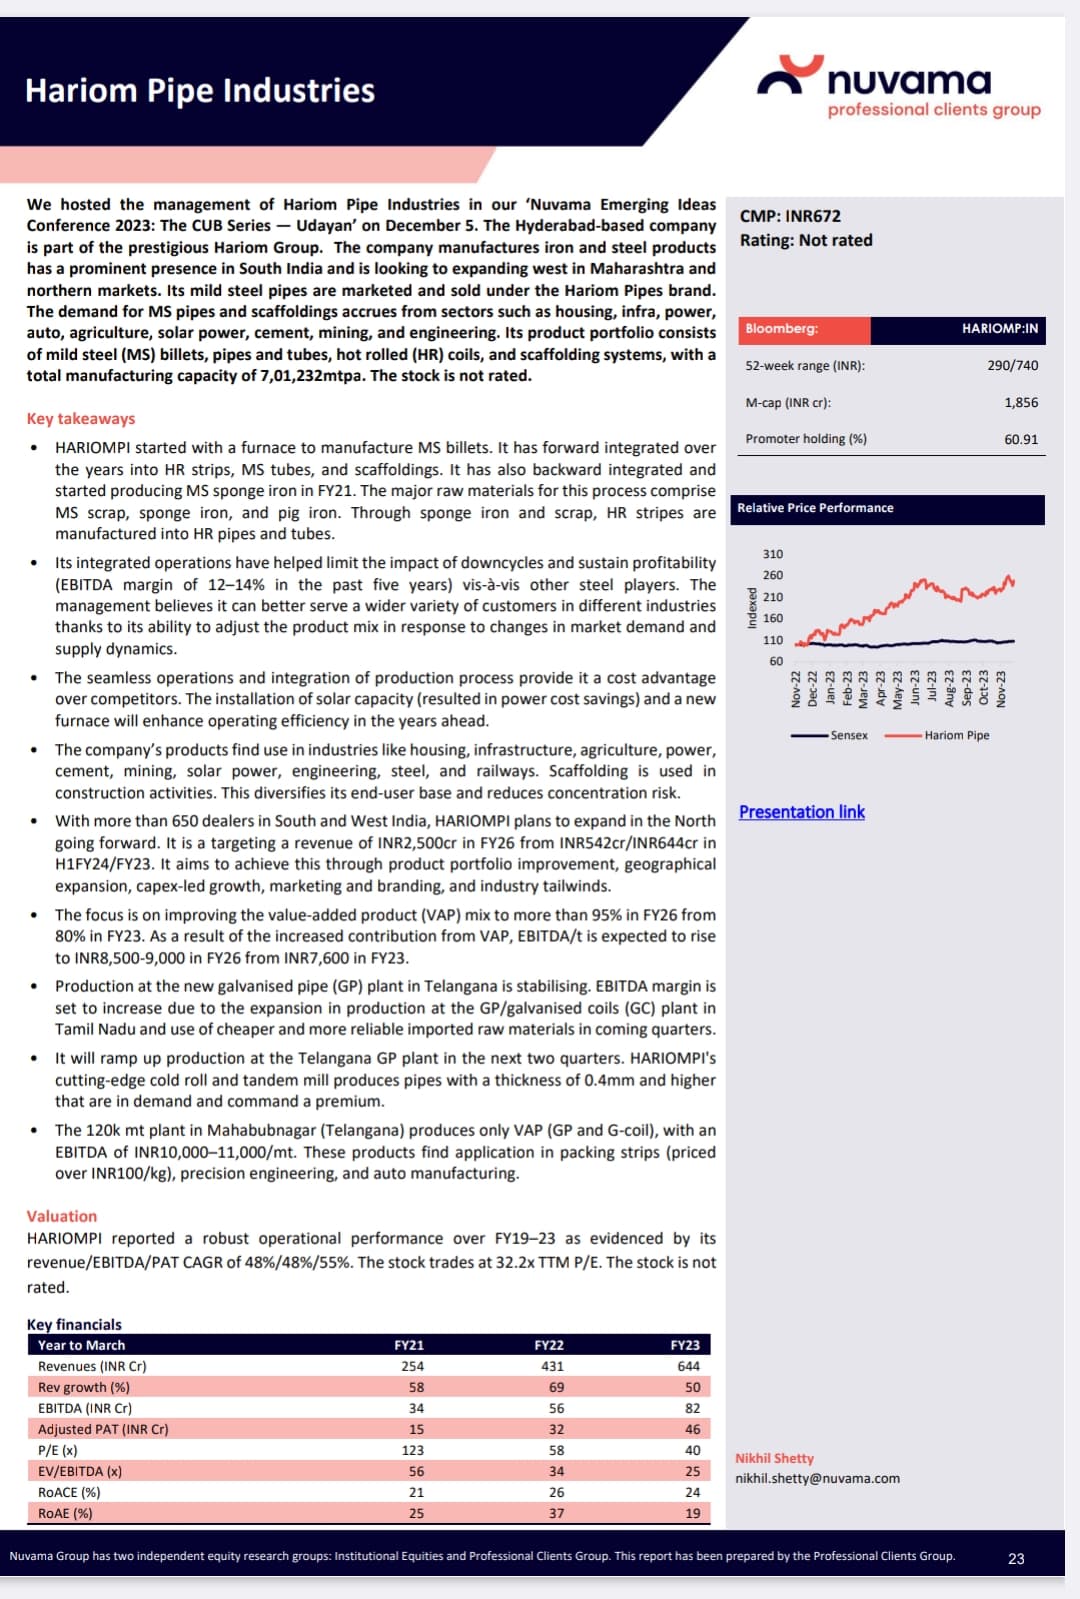
5 year Sales CAGR: 44%
5 year Profit CAGR: 48%

ROE: 20%
ROCE: 17%

Let’s, deep dive into it

Business Overview:

Hariom Pipe Industries Limited is an integrated manufacturer of multiple industrial pipes & tubes
With a diverse product portfolio consisting of Mild Steel (MS) Billets, MS, GP, GI Pipes and Tubes, HR, CR, GI Coils, Scaffolding Systems, Metal Crash Barriers

Product Profile:

Sponge Iron: Raw material for making Pipes; It’s an alternative to Scrap/Patra (Better quality than Patra)
MS Billets: It’s pure steel (Metal Bar)/Semi-finished steel
HR strips: Again a semi-finished iron or steel
Both of these are used for making Pipes or tubes
MS/HR Pipes: Co. manufacture square, rectangular, circular and D-shaped sections pipes
HR pipes up-to a maximum size of 250x250mm for square sections, 300x200mm for rectangular
sections and 300mm NB (nominal bore) for circular sections. The thickness can vary from 2mm to 6mm
GI Pipes: Galvanized pipes are steel pipes that have been dipped in a protective zinc coating to prevent corrosion and rust. These pipes are used earlier for water supply in home; it is made from GI Stripe, which are again made inhouse
GI Pipes are high margin pipes
Scaffolding, Tube Accessories and Fittings:
Scaffolding is used in construction activity, both buildings and other infrastructure construction. Scaffolding is used for variety
of purposes including ease of construction process and safety of workers

Catering to wide Industries like:
-Housing
-Infrastructure
-Agriculture
-Power
-Cement
-Mining
-Solar Power
-Engineering
-Steel Industry
-Railways

Scaffolding is used in construction activities
This makes end-users diversified in nature & reduce concentration risk

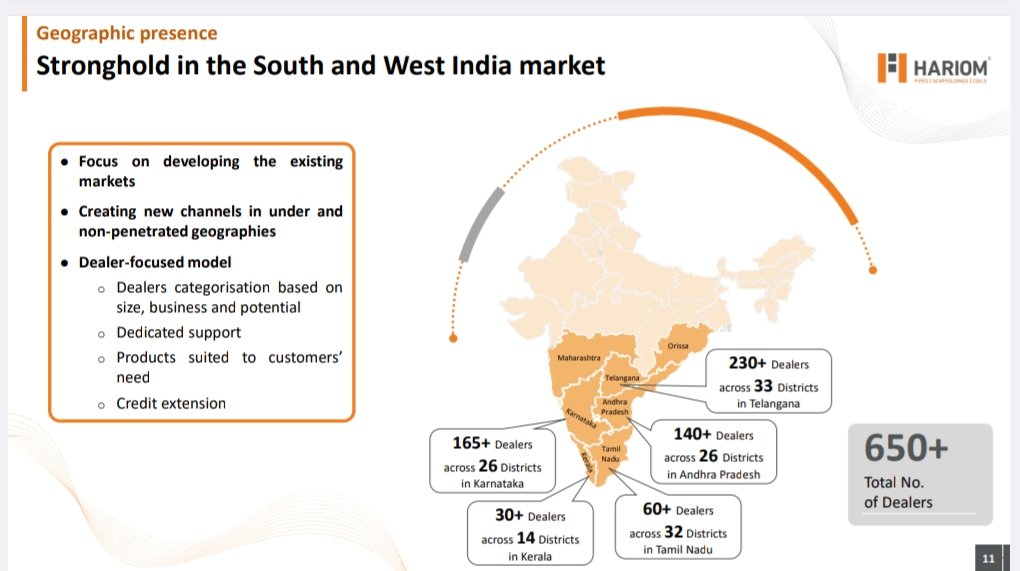
Distribution Network:

Hariom Pipe has a strong distribution network of 1,400 distributors and 1,500 point of sales in:
Telangana
o Andhra Pradesh
o Karnataka
o Tamil Nadu
o Kerala
o Maharashtra
o Dadra & Nagar Haveli & Puducherry

Mainly catering to South & Western India
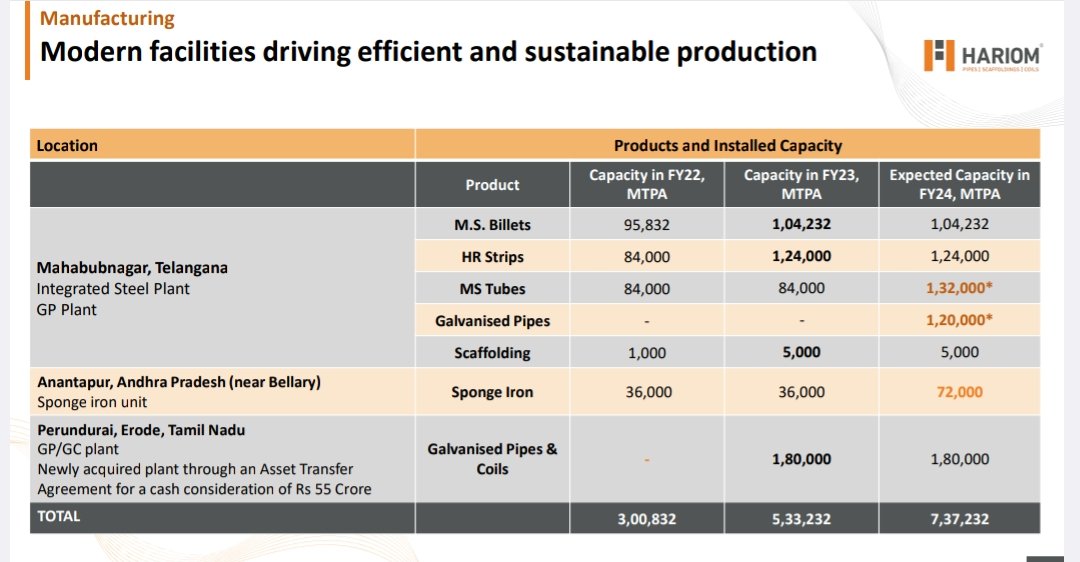
Production Process:

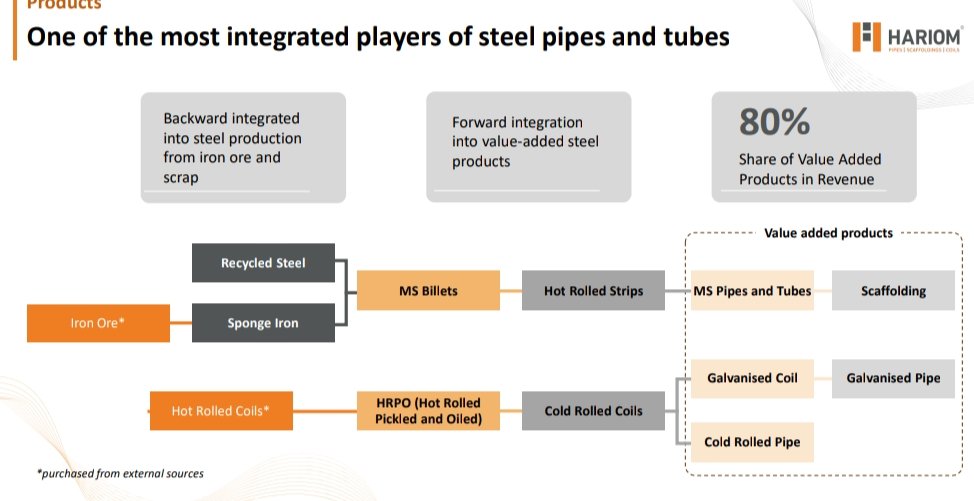
Hariom is Vertically & Backward integrated in manufacturing Pipe & Tubes Process

-Major raw material for this process comprises MS scrap, sponge iron and pig iron
-Through sponge iron & scrap, HR Stripes are made and from HR Stripes, Pipes & tubes are made

MS Steel Pipes are manufactured by using the process called Electric Resistance Welding (E.R.W).

As the company is Vertically integrated it makes sponge iron internally
Sponge iron is made from Iron Ore, which company procure through E-Auction
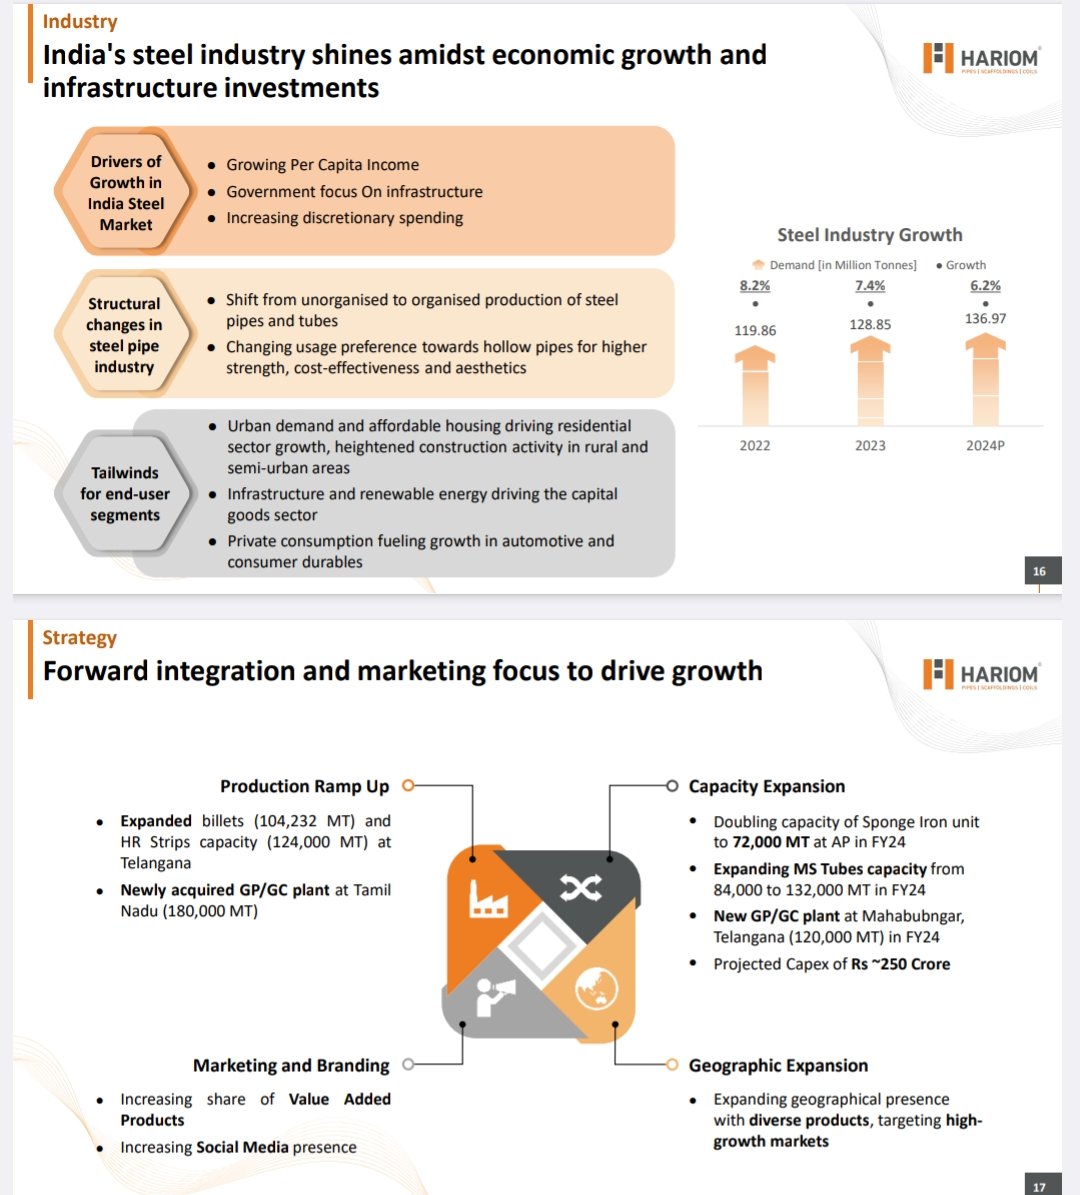
Industry Overview:

-After Europe and China, India is amongst the top-3 steel pipe manufacturers in the world with
capabilities to manufacture crude steel to value-added steel products, including pipes & tubes
-Availability of raw material, cheap labor & ability to produce steel at low cost have supported India’s
progress in the steel pipes & tubes industry. In terms of steel consumption, India stands amongst the top-3 countries in the world
Per Capita Cons. of steel is still very low

Indian Steel Pipes & Tube Industry:

India’s steel pipes & tubes market is currently estimated at ~Rs 600-700bn in value and ~11-12mtpa
in volume terms
It is expected that Indian Steel industry will grow at 7-8% CAGR for next 5 year
Hariom manufactures ERW & HSAW Pipes:

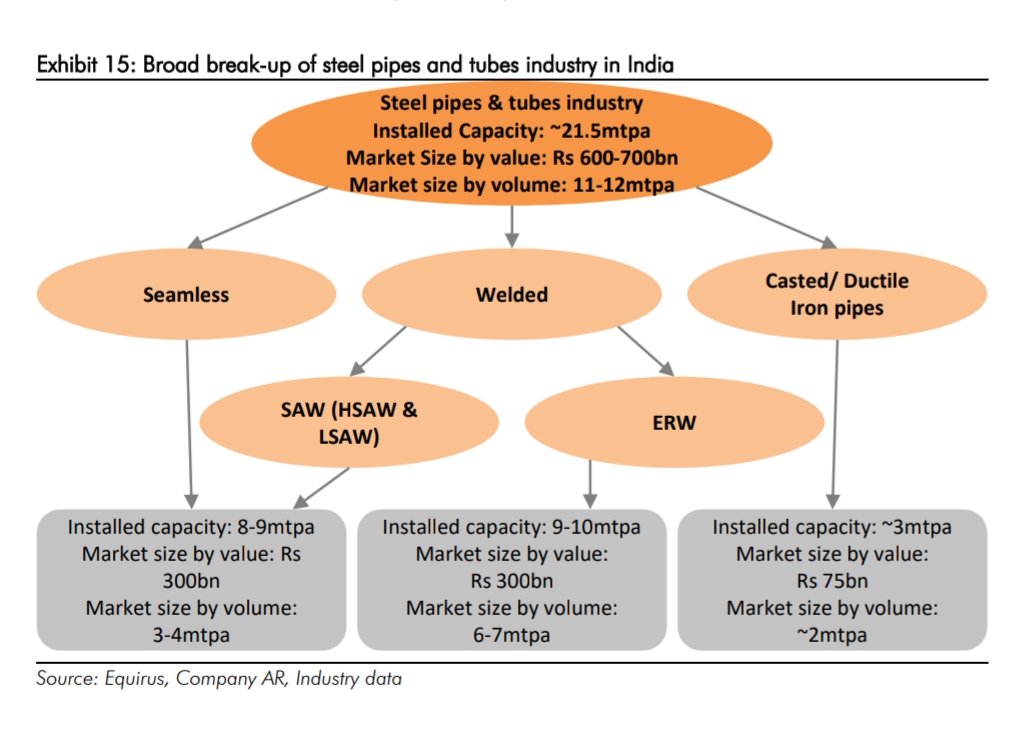
Types of Steel Pipes & their key features:

-DI Pipes are commodity Pipes
-ERW Pipes have wide usage & are little value additive in nature compared to DI Pipes (ERW Pipe market is expected to grow at 8-10% in future) aka Future growth driver for Pipe Industry

Key Competitive Advantage of Hariom Pipe:

  1. Vertically+Backward integrated manufacturing process:
    -This insures margin safety in bad times & also can face high competition
    -Dependence on external sources of RM reduce
    -Better quality maintain
    -Efficiency of production increases
  2. Qualify chemist & engineers, which help in maintaining quality standards as per Industry standard
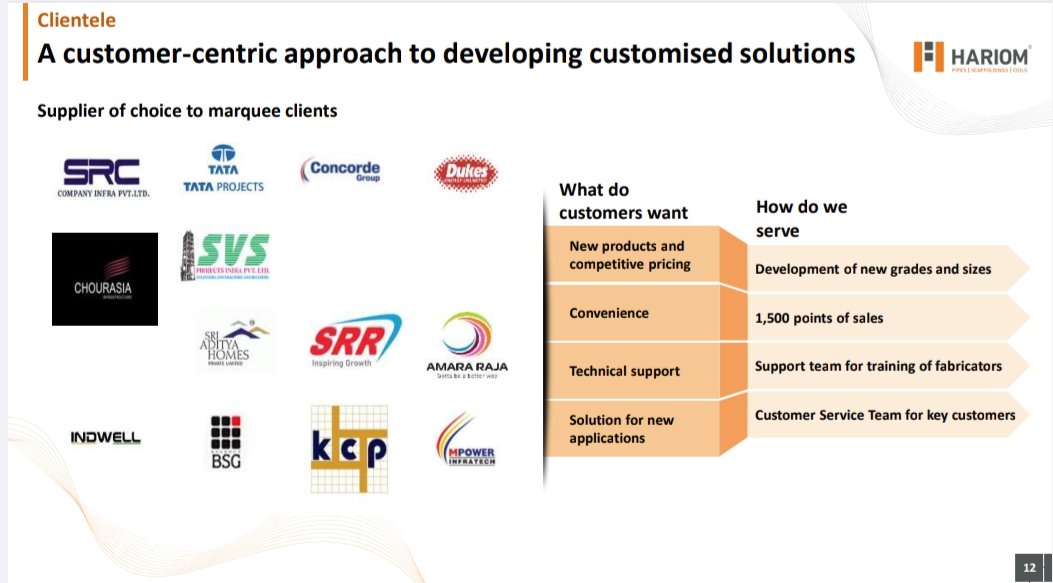
  3. High Number of SKUs/Customised products as per customer (Maintain customer stickiness)
  4. Strategic location of Units, which help in maintaining logistics cost
  5. Experience Promoter over three decades experience
  6. Competitive pricing of product as it’s product are in between Industry specialist & Patra base pipe products, which enable to capture price sensitive clients
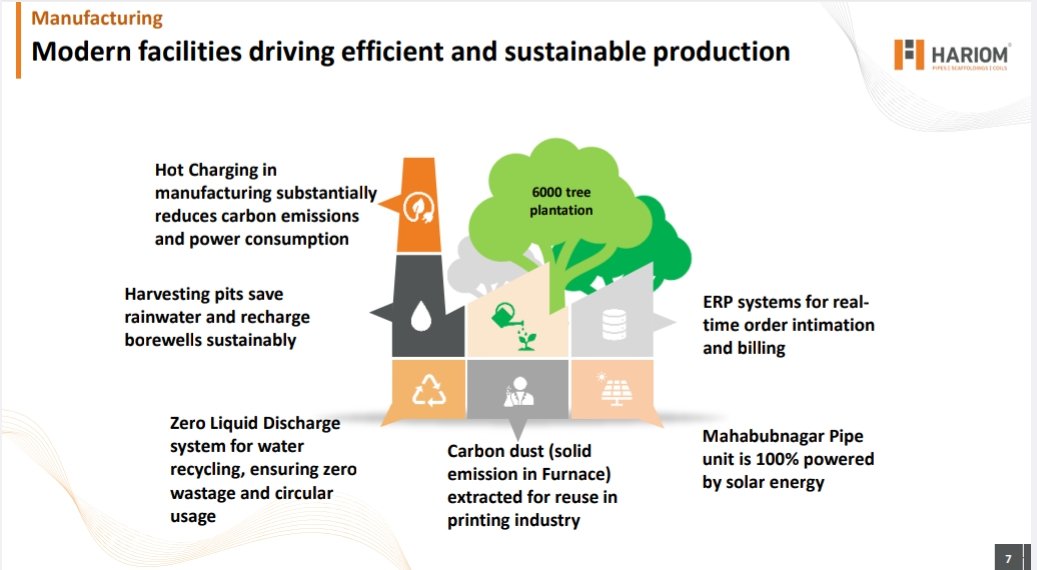
  7. Sustainable steel producing method

Key Variant Perception playing out:

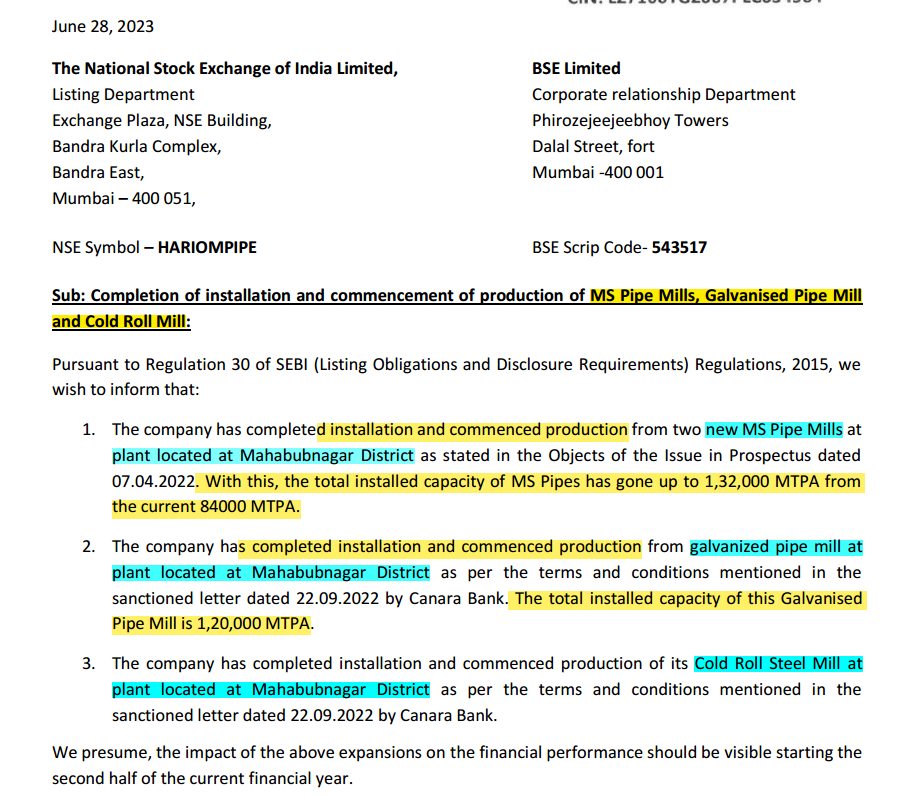
  1. Margin Expansion in Future: -Through introducing VAP: GI Pipes
    -Cost Reduction: Reducing waste through automation & Reducing Power cost (through establishing solar plant)
  2. Industry Cycle: Industry is growing at low single digit
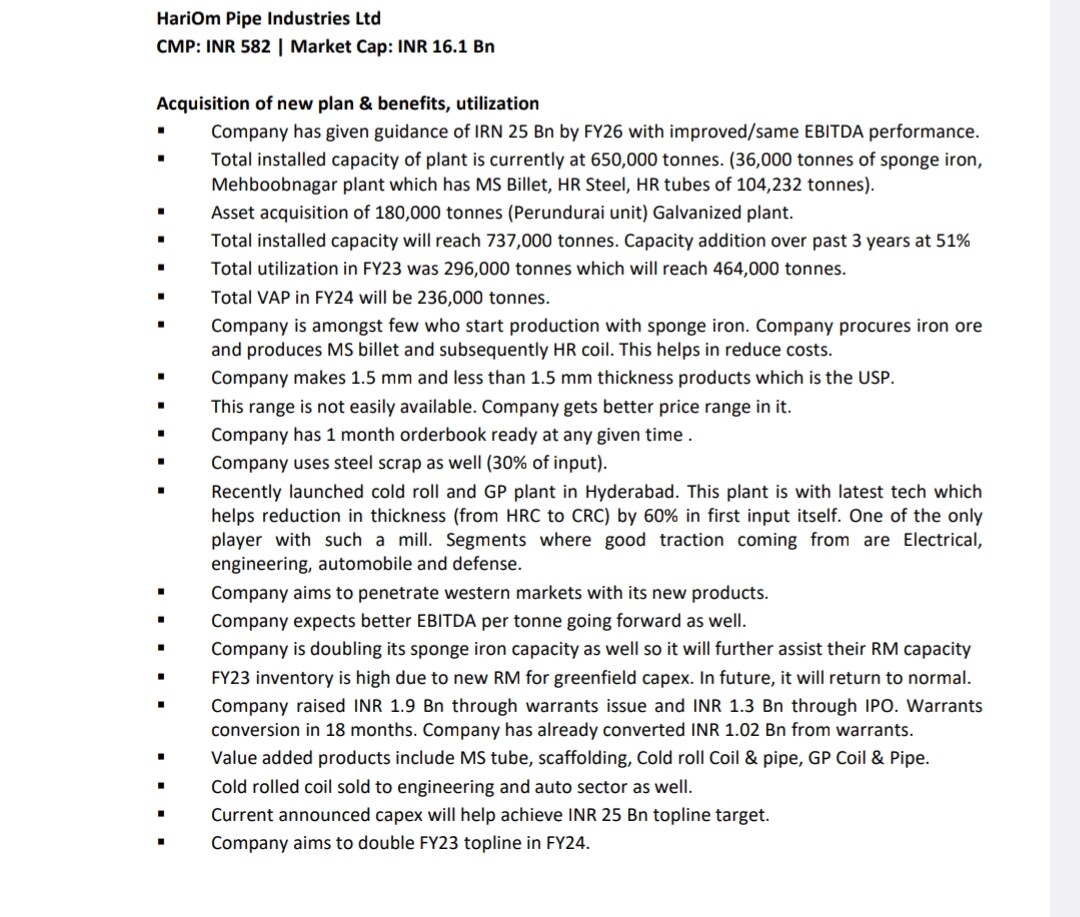
  3. Capex led growth: Hariom has increased MS & HR Capacity in the current plant (Up by more than 55%) + Introducing GI Pipes through IPO money, Debt & fund raising
  4. Operating Leverage to be played in future as sales increase
  5. Stable operating margin
  6. Acquisition of R.P Metals (But it’s products are commodity & low margin in nature)
  7. Additional Capex for cold rolled strips would cater demand to Asia’s largest hub of fan manufacturers in Hyderabad

Sources of Future Earning Growth:

  1. New Product Introduction (GI Pipes)
  2. Geographical Expansion through entering new states & Export contribution & Expanding distribution network
  3. Growth in the End User Industry(Capex cycle is going in India)
  4. M&A & Capex led growth

Peer Comparison:

-Indian Steel Pipe Industry is highly fragmented & dominated by large organised steel pipe players like APL Apollo & various unorganised Patra based manufacturers
-Its closest competitors are APL Apollo, Hi-tech Pipes, JTL Industries & Surya Roshni

Anti-thesis/Risk:

-Highly competitive & Cyclical Industry
-All players are doing Capex this can impact industry profitability
-Low margin Acquisition of R.P Metals
-Last year Cash flow turn -ve (need to track the CFO conversion)
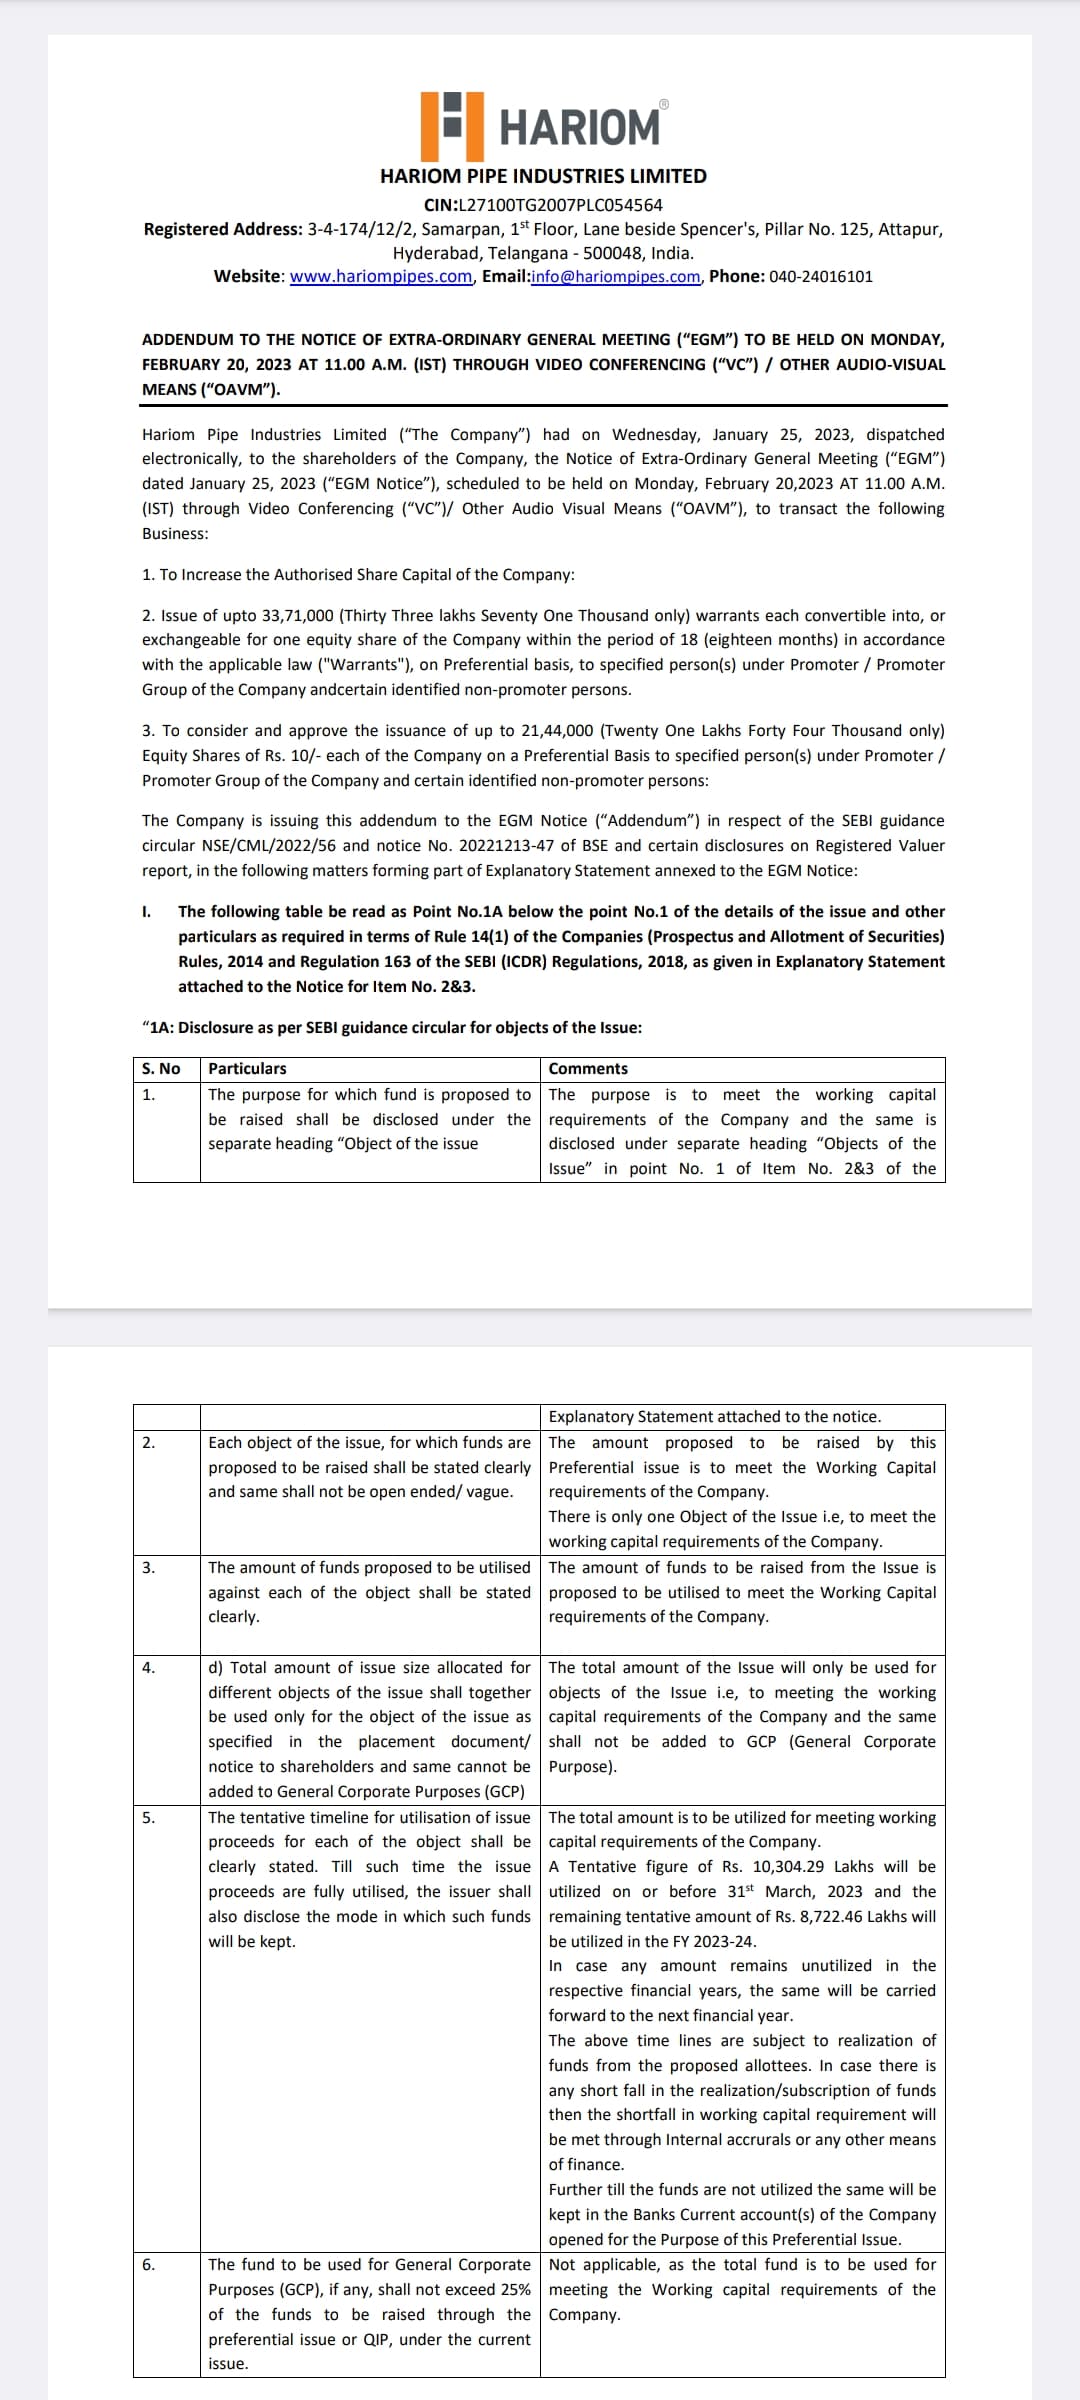
-Debt has increased for WC needs
-Finance cost & Dep increase as Debt & Capex rises(this can impact margins & PAT in short term)
-Contribution from low margin product impacting margins
-Concentration risk: Top 10 customer contributes over 50% of sales
-China dumping low price pipes in India & other countries

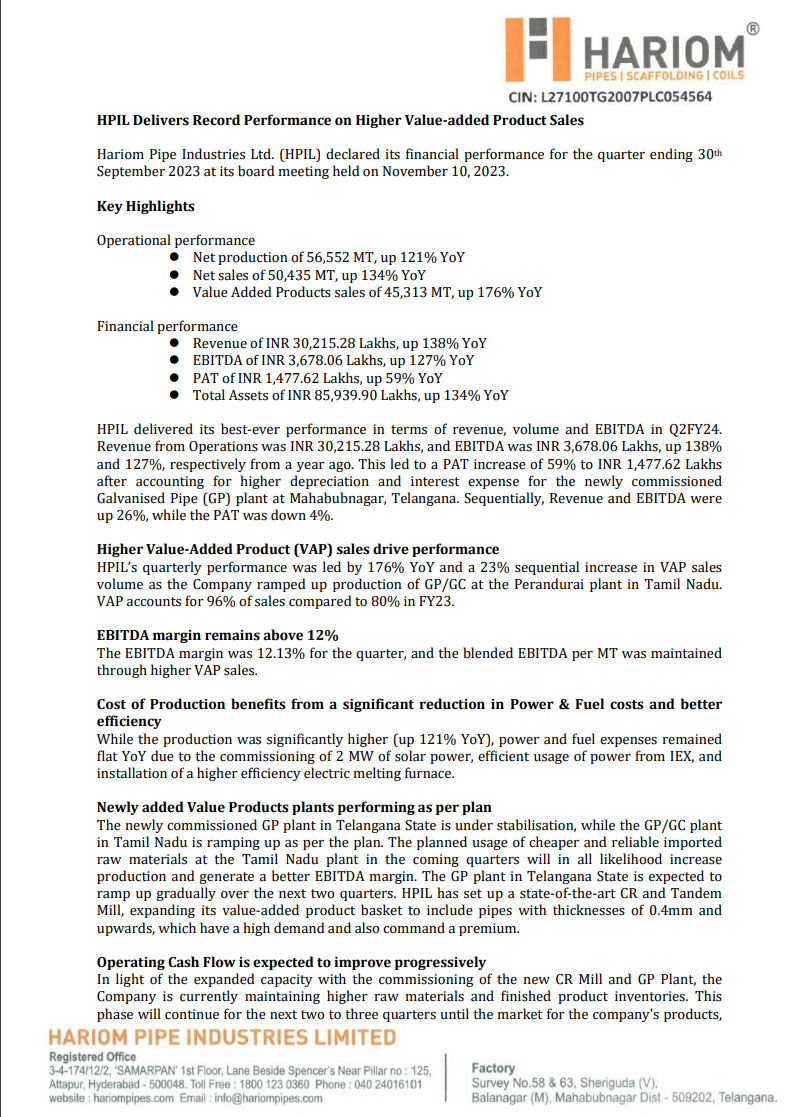
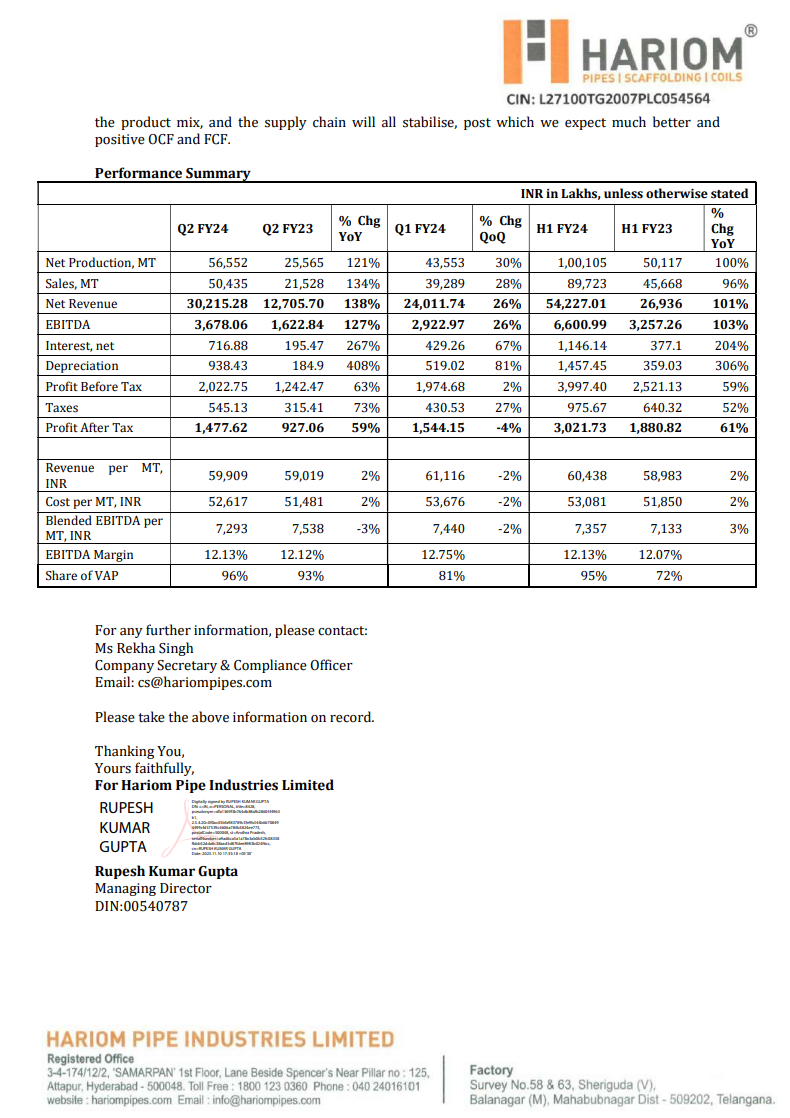
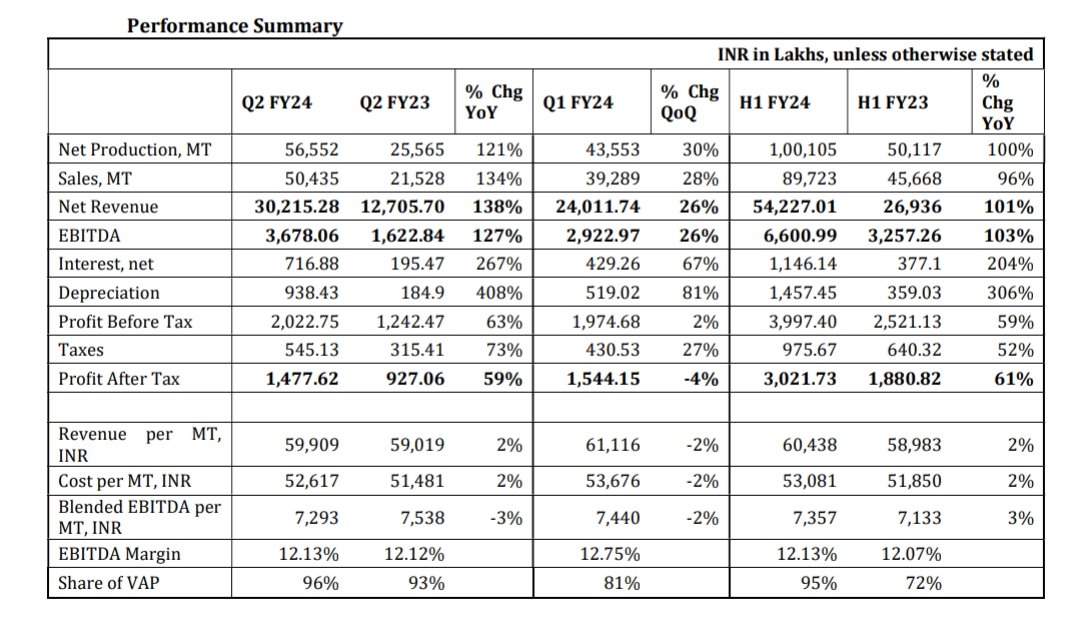
My Estimates (can be totally wrong):

  1. FY24 Revenue can be around 1000-1200 crores
  2. EBITDA Margin can be in the range of 12-13%
  3. PAT is expected to be around 58-68 Crores
  4. Trading at a forward PE of around 26

Strictly, No Recommendation

Disclosure: Invested & can be Biased

Note: Can’t able to Put proper Analysis with Images cauz of New Member restriction. If anyone want to read full analysis, one can check my twitter profile: https://twitter.com/BansalSwapan

I hadnt done Financial Analysis as one can check screener for it!!

12 Likes

Did they have MS Pipe Mills, Galvanised Pipe Mill
and Cold Roll Mill earlier or they have added this facilities new in their plant which started commercial production in last of days of June?


Disclosure: Studying.

1 Like

Brownfield

Through Borrowing & IPO Money expanded Capacity of Sponge Iron, Piping Mill & Rolling Mill in Mahabubnagar & Anantpur Plant

Through R.P. Metals Asset Purchase entered into manufacturing of GI Pipes in Perundurai

Now, Hariom Pipe has 3 Manufacturing Units

++ They had also added GI Plant Mill in Mahabubnagar Plant

2 Likes


Hariom Pipe Industries Ltd. (HPIL) has reported its financial performance for the quarter ending September 30, 2023. Here are the key highlights:

Operational Performance:

  • HPIL produced 56,552 metric tons (MT) of pipes, which is a 121% increase compared to the previous year.
  • Sales amounted to 50,435 MT, a 134% increase year-on-year.
  • Notably, sales of Value Added Products (VAP) reached 45,313 MT, marking a substantial 176% YoY growth.

Financial Performance:

  • The company generated revenue of INR 30,215.28 lakhs, showing a strong 138% YoY growth.
  • Earnings Before Interest, Taxes, Depreciation, and Amortization (EBITDA) stood at INR 3,678.06 lakhs, increasing by 127% YoY.
  • The Profit After Tax (PAT) was INR 1,477.62 lakhs, a growth of 59% YoY.
  • Total Assets reached INR 85,939.90 lakhs, reflecting a 134% YoY increase.

Details:

  • HPIL’s Q2FY24 performance was marked by its highest-ever revenue, volume, and EBITDA figures. The company reported INR 30,215.28 lakhs in revenue, and an EBITDA of INR 3,678.06 lakhs, both indicating substantial YoY growth.
  • This improved performance was attributed to the significant increase in sales of Value Added Products (VAP), particularly galvanized pipes (GP/GC) produced at the Perandurai plant in Tamil Nadu.
  • VAP sales volume witnessed a remarkable 176% YoY growth and contributed to 96% of total sales.
  • Despite the substantial increase in production, HPIL managed to maintain stable power and fuel expenses due to the commissioning of solar power, efficient energy usage, and the installation of a more efficient electric melting furnace.
  • The newly commissioned GP plant in Telangana is gradually stabilizing, while the GP/GC plant in Tamil Nadu is progressing according to plan.
  • The company is working on expanding its product range by including pipes with thicknesses of 0.4mm and higher, which have strong demand and can command higher prices.
  • The company expects its operating cash flow to improve as it continues to stabilize its market, product mix, and supply chain.

Performance Summary (Q2 FY24):

  • Net production increased by 121% YoY to 56,552 MT.
  • Sales grew by 134% YoY to 50,435 MT.
  • Revenue reached INR 30,215.28 lakhs, up 138% YoY.
  • EBITDA was INR 3,678.06 lakhs, reflecting a 127% YoY increase.
  • Interest expenses increased by 267%, and depreciation expenses grew by 408%.
  • Profit Before Tax (PBT) saw a 63% YoY increase to INR 2,022.75 lakhs.
  • The Profit After Tax (PAT) increased by 59% YoY to INR 1,477.62 lakhs.
  • EBITDA margin for the quarter was 12.13%.
  • The majority of sales (96%) came from Value Added Products.
4 Likes

My Take on Q2 Results:

Not so WoW Results, but justified a deep look :balloon:

-Revenue up 138% YoY n 26% QoQ
-EBITDA up 127% YoY n 26% QoQ
-EBITDA Margin at 12.17% vs 12.78% YoY vs 12.17% QoQ
-PAT up 59% YoY n -4% QoQ
-OCF weak -60.8 Cr vs -23.8 Cr

Looking weak,
But a deeper look :point_down:

Why PAT Growth lower?
-High Int & Dep Exp (Cauz of Capex)

Why Int Higher?
-Weak OCF (last 1 year -ve CFO)

Interesting things:

-Volume Growth is much higher 134% YoY n 28% QoQ🔥
-Value added share increased to 96% from 93% YoY
-VAP Volume increase by 176% YoY n 23% QoQ
-Realisation Growth is flat (Not selling product at depress price, to show good Revenue Growth)
-Highest ever volume & sales number
-Power & Fuel cost flat, even though FA doubled (cauz of Solar)
-Capex is ramping as per plan
-Will import cheaper RM to expand EBITDA Margin

About Weak OCF?

-Hariom is telling us that we need 2-3 Quarters time to improve CFO because of too much Capex, they need to maintain product, product mix & supply chain to stabilize

Weak CFO has led to high borrowings in B/S & high interest exp. impacting PAT

First ever presentation released:

Let’s analyse it:

  1. Value Chain
    -Backward integrated steel production
    -Forward integrated into VAP steel products
    -More than 95% VAP sales
    -Reason behind high EBITDA Margin compared to other players

  2. Modern & Sustainable use of technology for production

  1. Production Capacity

-Capacity expanded more than doubled from FY22 base thorough acquisition & capex

Hariom has:
-250+ Product specification
-1500+ Dealer network and POS
-Strong presence in South & West Market


  1. Customers:

  2. Guidance:

-Goal to reach 2,500 Cr revenue by FY26

Achieve thorough:
-Improving product portfolio
-Grographical expansion
-Capex led growth
-Marketing & Branding
-Industry tailwinds


My look:

-Results look neutral to average in hindsight as CFO -ve, Borrowing up, no margin expansion, high dep & low pat growth but

Management is saying:
-Wait & give us 2-3 Quarter to stabilize & things will look much better after that

Also, all the long term triggers are intact
-Grographical expansion + Power cost flat + VAP mix improving + Industry cycle + sales growth + importing RM to improve GP Margin

All good… will wait & give time to Hariom to show their true growth…

No Recommendation

6 Likes

Arihant Conference Notes on Hariom Pipes:

Similar to what states in their First Presentation…

3 Likes

Nuvama Notes on Hariom Pipe:

-Everything is going as per expectation…
-FY26 Revenue guidance of 2500 Cr. It aims to achieve this through product portfolio improvement, geographical
expansion, capex-led growth, marketing and branding, and industry tailwinds
-Management talking about margin Expansion & Operating Leverage
-Waiting for Cash Flows to turn Positive… then Bang

Disc: Invested
No Recommendation

4 Likes

Management Interview:

Nothing new… same as what states in PPT & Last Q Notes…

Still someone want to listen

1 Like

Arihant Capital management meet: (was in Sep-oct I guess)

-Tubes & Pipes have various uses… it has never ending usage, it is from frem to automobile to gas to water everywhere
-Using advanced technologies to save cost & lower wastage & power
-No Capex is required till FY26
-Capacity utilization is below 50% in FY23 & with growing sales & volume… utilization can improve & operating Lvg will take into play
-Only in Value added category, No commodity products & not any intention to enter the commodity market (Targeting Value & Low competition area)
-Pipe has higher margins than Coil
-CFO: Had done Greenfield Capex… it requires time to stabilize & in next 6-8 months it will normalise (Warrant money will be credited in next 12-18 month… take care of cash need)
-Targeting 75%+ growth in FY24 & 50% for FY25 & FY26
-USP is 1.5 & below thickness products (Coil is difficult to get)
-FY24 target is around 1200 Cr Revenue & around 12-13% EBITDA Margin
-Targeting 2500 Cr revenue & Avg. Realisation of Rs. 9500 approx (from now Rs. 7500), Targeting Gujarat & Rajasthan market
-Perundurai plant will target the south market: Kerala, Tamil Nadu & part of Karnataka
-Hyderabad plant will cater to the Gujarat & Orissa side (West & East side)
-Due to forward & backward integration can manufacture products at lowest cost & at fast pace compared to peers
-Perundurai plant will stabilise in H2FY24 and will target further VAP market to expand margin

No Recommendation
Invested & Bias

2 Likes

Promoter sold 5.11% of their holdings in March 2023 quarter. Does anyone know the reasons?

1 Like

Holdings were not sold… Warrants were issued to outside promoter entities leading to falling promoter holdings

1 Like

what will be the impact of flood in TN on the result of Hariom this quarter?

1 Like

Little to No impact, I think so…

One of my friend has contacted their IR team & they told no impact on operation + when flood came I checked their plants location & flood area (through map), I found their plant are little away from flood

Also, if operations were affected then it might be already reflected in price as whole tubes sector is in stage 2 and this one is consolidating & falling…

Rest one can know the impact on 9th Feb

Disc: Invested & Biased

:slight_smile:

2 Likes

The plant is located where there was no flood but I think the transport to the sales location might be affected that’s there is selling going on since the Mid December. Lets see the results om 9th.

1 Like

Despite achieving decent results, the stock experienced a correction of nearly 20%. What could be the reason for this downtrend? I’ve heard there have been some changes in management, and the promoter has been consistently selling.

Promotoer stake has gone down probably because of raising funds via preferential issue and warrants. Also Malabar India fund has increased stake to 6%

3 Likes

Yup correct this is last order consequences

Like if Hariom Pipe operations were not affected then it’s transportation & distributors were surely affected… this can lead to inventory pile up if this were worsen or else cash flows will further strech as distributors will ask further time to recover

Let’s see what all can possible… if they answer such questions on press release like they done in Q1 then it would be much helpful

4 Likes

Promoters are not selling… warrants are allotted

BSE & NSE shows shareholding patter as on date as & when shares will allotted it will change

If u see No of shares promoter hold its same as before & after

2 Likes

Correct this is the reason behind falling percentage

1 Like

Any update on the result?