Glenmark Life Sciences

Thanks for sharing the analysis on the gross margin and SG&A expenses, however your final summary seems to be quite misleading given it’s financial performance.

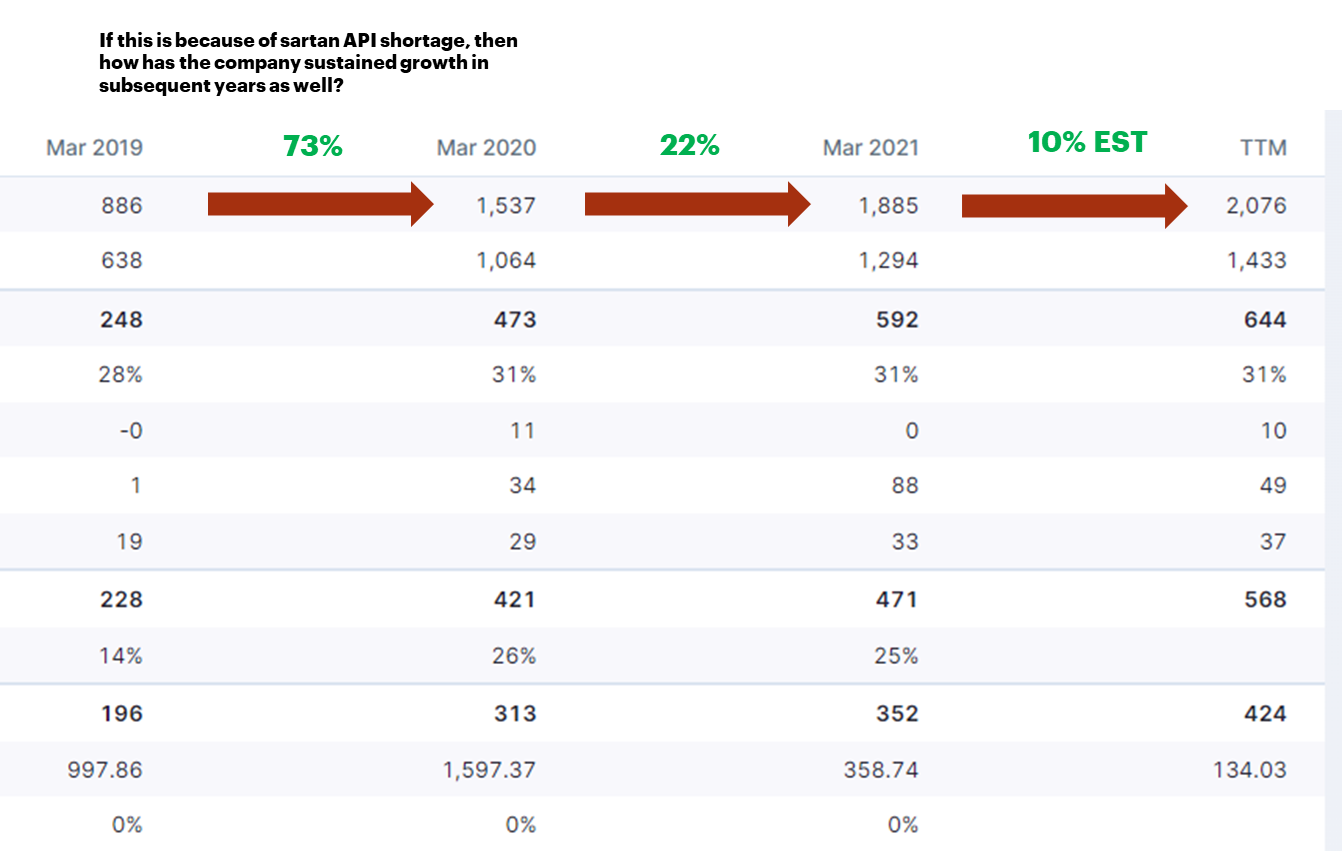
If you believe Glenmark benefitted a lot from the sartan API shortage in 2019-20 and actually does not operate with any competitive advantage in complexs/specialty APIs - why has it been able to continuously grow in the past 2 fiscals?

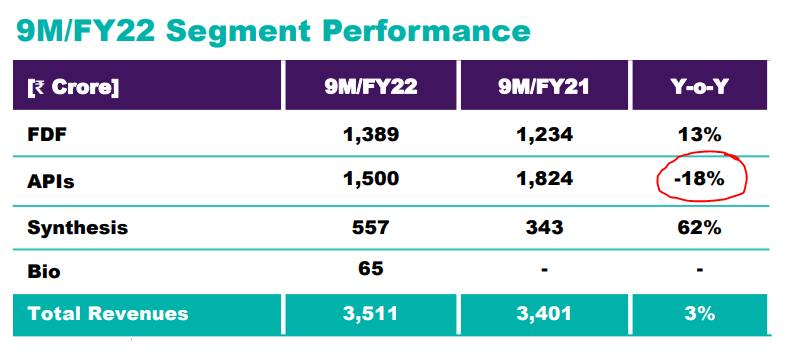
Companies like Laurus and Neuland have struggled to grow the API business in 2021-22 along with huge margin compression. Laurus’ API business has degrown 18%. A company like Alembic was the true beneficiary of Sartan drugs as you can see from their financial performance in the past few quarters.

Laurus Labs

Alembic

Glenmark management claims they operate in high value APIs, which range from $200 / kg to $800-900 / kg. Do you have any data to compare this with likes of other API manufacturers which would help us understand if these are commodity APIs or niche / specialty APIs?

Customer Concentration
I agree there is a parent concentration risk i.e. 35-40% revenue from the parent company, however It’s customers also include 16 of the 20 world’s largest generic pharma companies globally.

Regulatory Track Record
In the last 6 years, it has not received a single warning letter or import alert. Since 2015, GLS facilities have been subject to 38 inspections and audits by regulators including the USFDA, PMDA, COFEPRIS, Health Canada, MFDS (Korea), EDQM, other European regulatory agencies and CDSCO conducted on a periodic basis. GLS has not received any warning letters or import alerts from such regulatory authorities. GLS facilities have also been subject to 432 inspections and audits by our customers during this period

CDMO Business
Very sweet business, very high margin business, much healthier than generic business margins, business growing very rapidly - crossed 200 cr business in FY20 and FY21 business went down to 150 cr as 1 molecule got affected due to Covid, but expect it to comeback as Covid fades away.

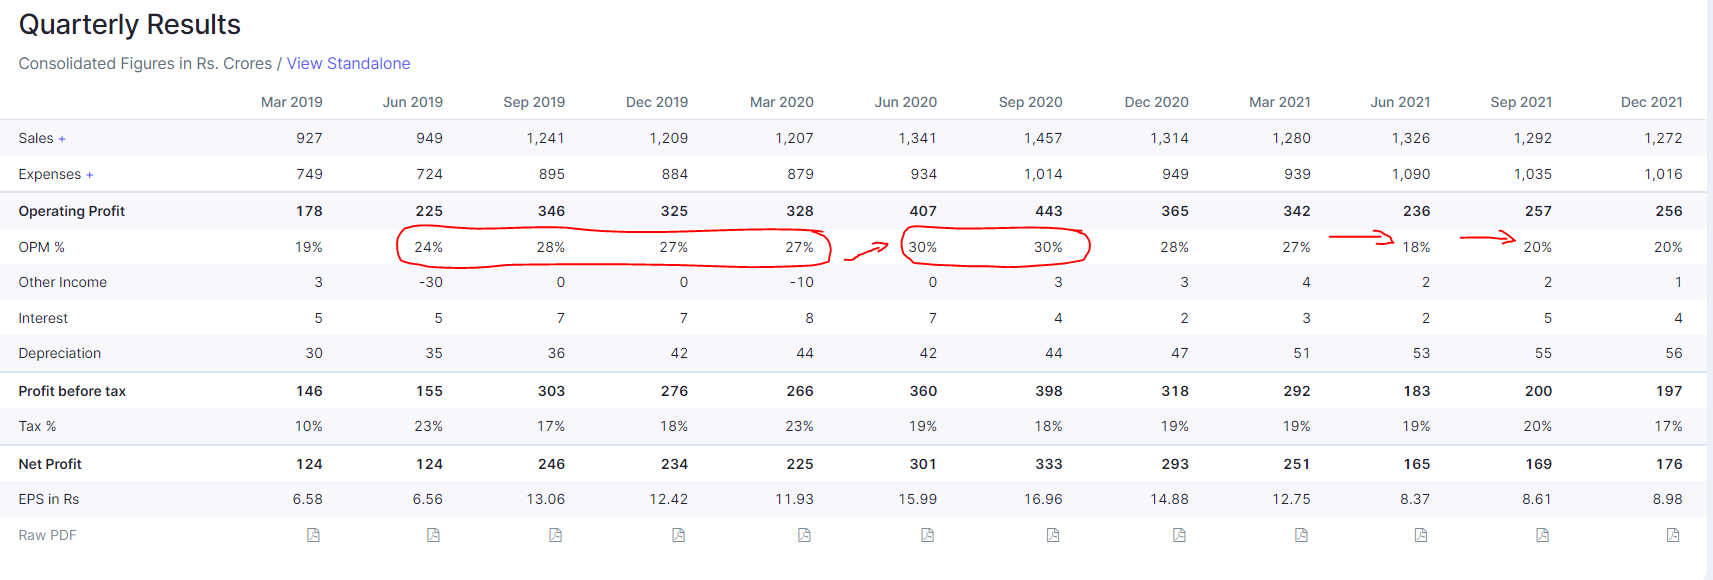
Based on the company’s recent performance and track record, I don’t see why this is an average or bad business. If the company can maintain the revenue growth and EBITDA margins at 28% in Q4 as well, there is something special about the company where most other API makers have struggled on revenue growth (no new customer orders due to high inventory) along with 5-8% margin compression

Disc: Invested

8 Likes

In addition, even if SG&A expenses are lower as 40% of revenue comes from parent, we do not know if GLS sells to parent at lower prices compared to other customers. Perhaps we can get this clarity in the next con-call.

And as pointed out by @gurjota,their manufacturing facilities have not received any warning from various regulators. Perhaps, this aids in premium pricing as well.

Hey!

I didn’t mean to say they don’t have any competitive advantage. Its impossible to build a business that is part of NSE500 without having some competitive advantages. However, Glenmark Life did benefit majorly from the SARTAN api shortage. This is visible in their gross margin numbers in FY19 (60%+). Since then, their other business has also scaled which has meant that contraction in gross margins (from 60%+ to 50%) has not translated into EBITDA margin.

This will show up in gross margins, if a company makes higher realizations they should make higher gross margins.

I never said its a bad business, they are making operating margins of 25%+ in an API downturn, obviously they have something good about their inherent business. I am trying to see if I can decipher their secret sauce by looking at their numbers. Its not to comment on their business, but on my understanding of their business. Its important to differentiate that.

12 Likes

Interesting management interview

7 Likes

Supriya lifescience and gls are 2 small cap API companies which have had least impact on their margins in this such a bad time and still guiding only impact of north of 2% is significant and when glenmark’s ankleshwar plant which is for backward integration with 400klpd capicity comes online then these guys will further improve their margins.

3 Likes

Q4 results pretty much in-line with expectations (moderate top line growth with couple of % reduction in margins). In con-call, CEO says topline growth moving forward will be 12-14% and backward integration project at Ankleshwar plant will yield 1% benefit in margins. That sounded quite low for the investment they are making… perhaps they are being conservative? They also claim the primary benefit of that capex is to ensure regular supply of raw materials, the supply and prices of which can fluctuate in the market.
Overall, seems decent but not for aggressive investors I guess…any feedback / opinion?

4 Likes

At the time of writing this the CMP is Rs. 497, mkt. cap. is Rs. 6,087 Cr. The return ratios (RoE and RoCE) for FY22 are very healthy, at 30% and 42% respectively. Valuation wise the stock looks attractive, P/E is 14.6, which I find to be low when compared to other companies (in similar segment/sector), and also the market in general. MC/sales is 2.87 which again I feel is low.
According to the expansion plans, the total reactor capacity is expected to reach 2,205 KL by 2026. If I take the current sales to reactor capacity ratio (2123/765=2.77) and try to extrapolate for 2026, the sales (2205*2.77) could cross Rs. 6000 Cr. Mkt cap in this case could cross Rs. 17,000 Cr. Assuming the company maintains operating profit margins of 28%, then the operating profit in 2026 could cross Rs. 1700 Cr. Assuming current MC/OP of 9.88, the market cap could reach Rs. 17,000. Based on these over simplified calculations, it seems the market cap by 2026/27 could triple from current levels.
My expectation is that the company should improve margins if they are investing capex for backward integration, else what is the point if the investment does not generate additional revenue or help improve margins. Securing supplies is a reasonable reason, but there could be other ways of doing the same without incurring capex (no?). Further, one of the growth levers for the company is expanding its CDMO business, but the company has not given any guidance on this front. If the CDMO business ramps up meaningfully, then the margins should improve as CDMO generally has better margins as compared to API (according to the company). This should further re-rate the share price upwards.
Need to monitor,

  1. Expansion plans, no cost or time overruns would be critical (haven’t seen any cumulative capex figures for the full plan though)
  2. Margins, whether they are maintained
  3. Ramp up of CDMO business
  4. Any adverse inspection outcome/impact
    So looks like GLS presents an interesting investment opportunity. However, I have been optimistic in my assessment and I could be completely wrong. I welcome fellow members to present counter view points, thank you!

Disclosure: taken small position for tracking. Data points above have been taken from screener, as is.

10 Likes

A small correction in the quoted text below.
The capacity expansion to 2200 KL includes 400KL capacity meant for backward integration. So, this 400KL would not generate revenue but more for raw material production for internal consumption to maintain regular supply & improve margins.

Effective topline generating capacity would increase to roughly 1800 KL

2 Likes

Hi,

Few things I noticed. In one of earlier (first I guess) concall, mgmt. guided for 16% growth in sales. But they failed to deliver the same.

Mgmt has rescheduled the capacity expansion timeline for solapur site couple of times. Inspite of having funds and capability to raise debt, why are they delaying capacity expansion for greenfield site? I could not understand. Obviously, the scenario has changed dramatically in last 3-4 quarters. But it seems hunger for growth and aggressiveness is missing. At the same time they are planning to become less dependent by manufacturing key raw materials, planning to backward integrate top 20 key products, thus it seems they would be able to maintain/enhance the margins but need to monitor growth in sales closely.

Even Mgmt has alluded earlier that, anytime for new capacity, utilization would be very gradual plus it will take time to get necessary approvals for greenfield site.

Disc. Invested

6 Likes

Agree, I also remember them mentioning 16% topline growth in an earlier con-call but now they are guiding 12-14%. They also keep saying the demand is robust and almost 40% of their revenue comes from parent Glenmark Pharma which is quite stable. So am too unable to understand the lower guidance. And their ramp-up of CDMO business is also quite slow.
For long term investors, the fundamentals look good (perhaps at a lower price to cover some risks). But not sure about medium term.

1 Like

thanks…appreciate the correction … that reduces the market cap estimate to Rs. 14000 Cr.

Some discussion around the company on twitter.

1 Like

Was going through the earlier calls from the mgmt and in one of them, CEO clarified that they expect the CDMO business to contribute 15% to the total revenues few years down the line…thats not very impressive goal given that CDMO is a high margin business. Why wouldnt they want more CDMO business.

Also came across Bank of America’s view on GLS…https://www.bloombergquint.com/markets/bofa-reinstates-coverage-on-gland-pharma-glenmark-lifesciences-with-a-buy-neutral-on-divis-labs

1 Like

What is CDMO ?

This line of business cannot be linear in nature, an innovator can’t spend continuously on the development ? This kind of business is high margin but lumpy, one cannot predict.

The focus should be on the parts that are certain, their ANDA pipe line , how many approved and how many are live and how many are in the pipe line for approval. What is the opportunity size of each of these. What kind of pricing power do they have on the supply side.

Do they have diversified product basket (Bulk + Niche Molecules ) , in case of bulk are they lowest cost producer ?

Let us look for anti thesis what can go wrong not always what can go right.

3 Likes

Just trying to understand the balance sheet number, especially the first line item - Equity.
It was 752 Crores at end of FY21. They came up with an IPO in FY22 for about 1060 crores (excluding the OFS by parent which directly went to Glenmark Pharma). Out of 1060 crores, around 800 crores were used to pay off debt to Glenmark Pharma and the balance is around 260 crores that’s being used for capex and corporate purposes. FY22 net profit is around 420 crores and interim dividend of around 120 Crores

But the equity at end of FY22 is higher than FY21 (750 to 2050 Crores). Thought it would be 750 + 260 from IPO + 420 from FY22 profits - 120 dividend paid = 1300 Crores or so (and not 2050)
I am not an accounting expert. Can someone explain this? Thanks

image

1 Like

@newone almost there, just you missed entries for 800 Crore. There should be a entry for 800 crore in equity side.
Using this below, A = L + E
Before IPO, considering only debt and equivalent asset
800 = 800 + 0
After IPO, before debt repayment
1600 = 800 + 800
After debt repayment
800 = 0 + 800

So just add back debt repayment to your numbers, this will match

2 Likes

In a recently aired interview the CEO guided for:
14% topline growth
28% - 29% EBITDA margin
400+ cr of FCF

Currently stock is available for:
P/E ~14
EV/EBITDA ~8
Div. Yield ~4.5%
Increasing institutional coverage in the past few months (GS, Jefferies, BoB Caps)

Current price provides significant MoS

Risk:
Possible adverse USFDA inspection outcome, since many sites are due for inspection
RM supply
Elevated solvent prices

D: Invested

3 Likes

Mgmt has guided that the oncology capacity is scheduled to be commissioned in the current fiscal. The table below shows the oncology products that they have under development and their sales in 2021 by the innovator companies. Some of these could also be CDMO opportunities for GLS.

The opportunity size is an additional $9 billion with, potentially, higher margins than their traditional CNS/CVS products.

Sr.No. Generic Brand Originator Size ($mio) LoE
1 Bosutinib Bosuvi Pfizer $145.00 2026
2 Cabozatinib Cometriq Exelixis $1,008.00 2024
3 Enzalutamide Xtandi Pfizer $302.00 2026
4 Ixazomib Ninlaro Takeda $670.00 2029
5 Olaparib Lynparza AZ $2,748.00 2025
6 Palbociclib Ibrance Pfizer $1,398.00 2027
7 Selumetinib AZ Under Dev
8 Ruxolitinib Jakafi Incyte $2,891.00 2027
9 Tivozanib Fotivda Aveo Oncology $38.90 2025
3 Likes

BoB Cap initiated coverage with a target price of 620. Further, Glenmark’s launch of Sitagliptin should augur well for CVS volumes given the large mkt size for Sitagliptin in India.

1 Like

Hello, is the report publicly available? If so request you to share the link rather than the uploaded report. In the past the VP forum got into trouble for sharing non public reports. For your attention, admins cc @basumallick @Donald