you should value cyclicals by market cap to sales also.
CMP/Sales from screener:
Minda: 2.96
Endurance: 2.41
Lumax: 0.64
Fiem: 0.88
PEG ratio for Fiem (0.81) is the lowest of all as well. I’m wanting to understand the reason behind no rerating, irrespective of whichever metric we choose to evaluate it from.
1 Like
Its a good question that you have asked.
There could be several reasons for 2 stocks in the same industry having different valuations. How are valuations determined? They are obtained essentially by discounting future cash flows using a discount rate. Therefore, any factors that impact either the cash flows, or the degree of their certainty or the discounting rate itself can impact valuations.
Along those lines, the reasons for valuation differences in the same sector/industry could be split into fundamental and perceptional reasons. Elaborating on them below
Fundamental reasons
-
One business has superior ability to generate cash i.e. high CFO/PAT - Both Minda and FIEM score very highly on this. Both companies have low Cash conversion cycle and working capital needs
-
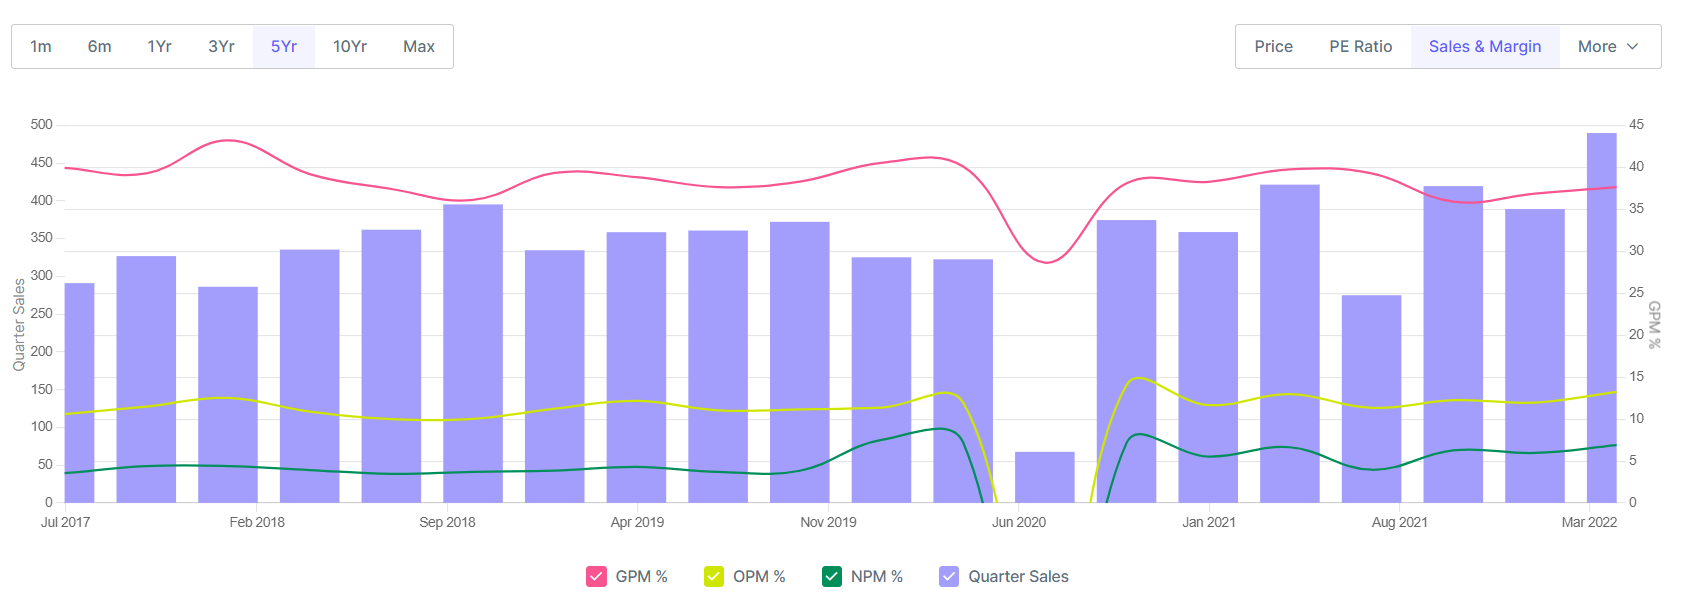
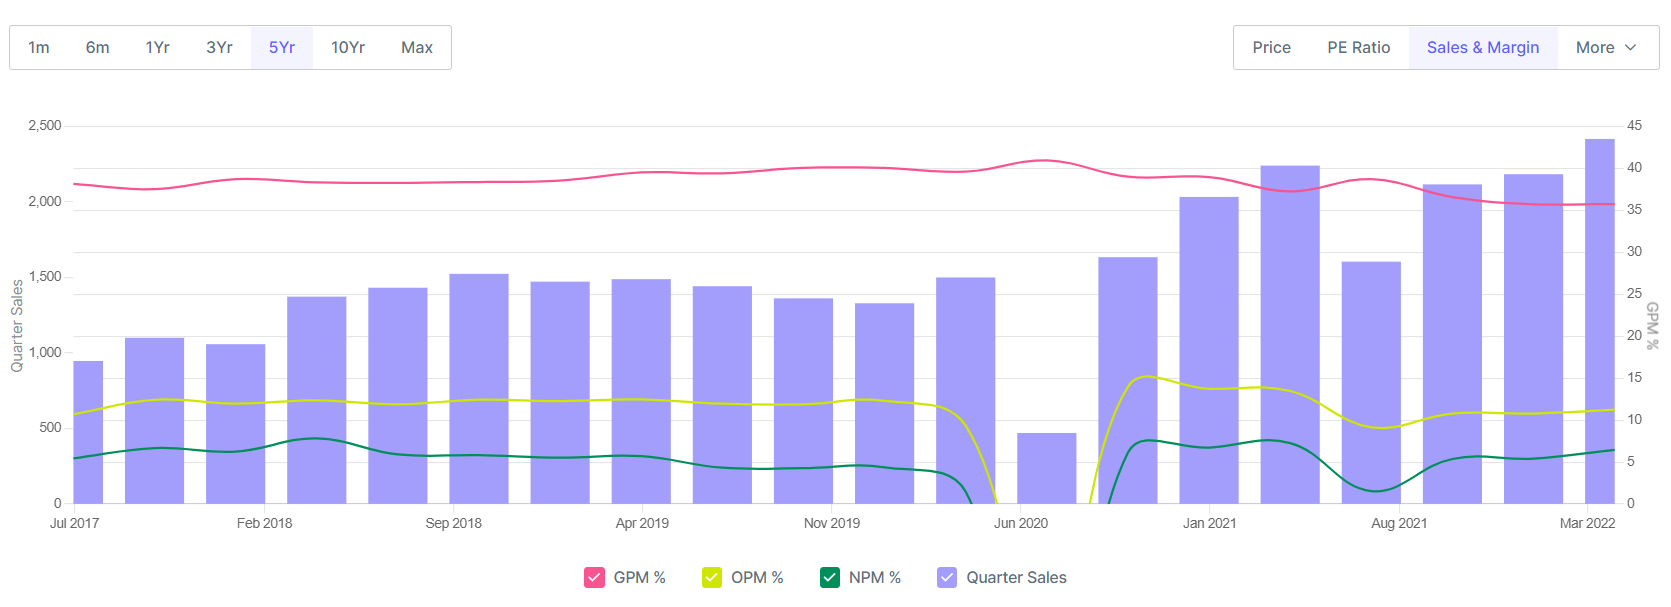
One business has superior gross and operating margins - Once again, FIEM and Minda are pretty much similar here with 35-40% GMs and 10-13% OPMs over the last 5 years
FIEM
Minda
-
One business has a superior capital structure - FIEM scores over Minda here with almost a zero debt balance sheet. Although Minda also has a very, very strong balance sheet with 15x Interest coverage ratio. So while FIEM scores better, investors don’t really penalize Minda here.
-
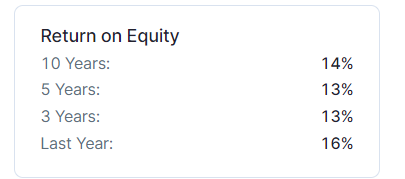
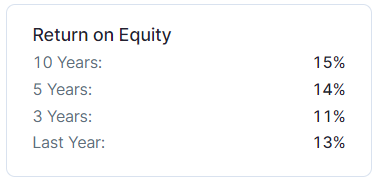
One business has superior return ratios i.e. ROE or ROCE - Again, FIEM and Minda are pretty similar but FIEM’s ROEs are on a clearly increasing trajectory due to higher asset turns resulting from migration to LED lights in vehicles.
5. One business may have higher quality of revenues - By quality of revenues, one means sustainability and diversification of revenue sources. FIEM is essentially a 2W lighting player with diversifications in mirrors and other moulded parts. Minda has far greater diversification with 20+ product categories in the OEM segment. Market perhaps views Minda’s revenue quality to be higher and more de-risked than FIEM’s
FIEM ROE trend is increasing
Minda ROE trend
Perceptional Reasons
-
One stock has lower free float of shares than the other - If you see, Minda barely has 7-8% of its market cap as free float due to high promoter, DII/FII and large retail investor holdings. Whereas, FIEM has about 22% of free float market cap, about 3X as much as Minda. This gives Minda stock an advantage. Lower float for a good company generally means higher than average stock prices as liquidity is low.
-
One stock has higher DII/FII holdings - Clearly Minda has higher FII/DII holdings at 23% vs only 11% for FIEM. DII/FIIs have lower expected rates of return than retail investors because of their well diversified portfolios and long term nature of holdings. Therefore, a higher concentration of DII/FII holdings usually means a higher stock price as DCF calculations will factor in a lower cost of equity. So Minda has an advantage here.
-
One business is tied to a sector which has headwinds at the moment - FIEM’s entire revenues come from 2Ws (96%) whereas Minda’s revenues are split equally between 2W and 4W. The 2W industry is in one of its worst phases right now, with demand well below 2019 levels, where as the 4W PV and CV segments have started picking up already.
Therefore, if you look at the fundamental and perceptional factors that go into deciding a valuation multiple, FIEM is as good if not better than Minda on fundamental parameters but lags well behind in perceptional parameters. Perception is a servant of fundamentals and perception does catch up with fundamentals at some points (Although sometimes this may take an unreasonably long time). Therefore, if FIEM management keeps up this level of execution, I see the stock getting rerated over the next few years. Having said that I don’t expect FIEM to match Minda’s 2.7x P/S ratios. I believe Minda is heavily overvalued at 2.7x P/S. I would peg FIEM’s fair value at around 1.5-1.7x P/S at current levels given recent execution (Take this with a spoon of salt, a large part of assigning a multiple is “art” rather than science). Its a good time to add the stock in my view as the market hasn’t completely discounted FIEM’s increased ability to generate ROE due to LED migration.
PS: Invested and biased
PPS: Would love for other boarders to add to this model of analysing valuation differences. Are there any other key factors that contribute?
25 Likes

FiemIndustries-CompanyUpdate-June2022_112557_665fe.pdf (1.0 MB)
A Technical Analysis View of Fiem: (views of @hitesh2710 @StageInvesting would help)
5 Year plus cup & handle formation, fibo retracement of 0.5 done:

3 Likes
On yearly charts , you would find this kind of structure on many charts due to COVID fall and a V shaped recovery after that . So be careful , especially in a bear-market.
In bear markets, even bullish structures fail .
For Fiem ,I will keep a close watch on this and would try to SIP only if it goes above 1118 (its recent high) and stays there for few days.
Why I am cautious ![]()
a) The first fall from the top was in 5 legs , after that structure has become complex,so I would be very cautious .
b) On the top ,we have strong resistance near 1325 , so upside is limited or would be very torturous. And above that in a correcting market
Looking at above facts, I won’t like to lose my sleep for only 10-15 % upside.
I would rather wait for good sentiments in market/sector/stock to ride with full conviction.
5 Likes
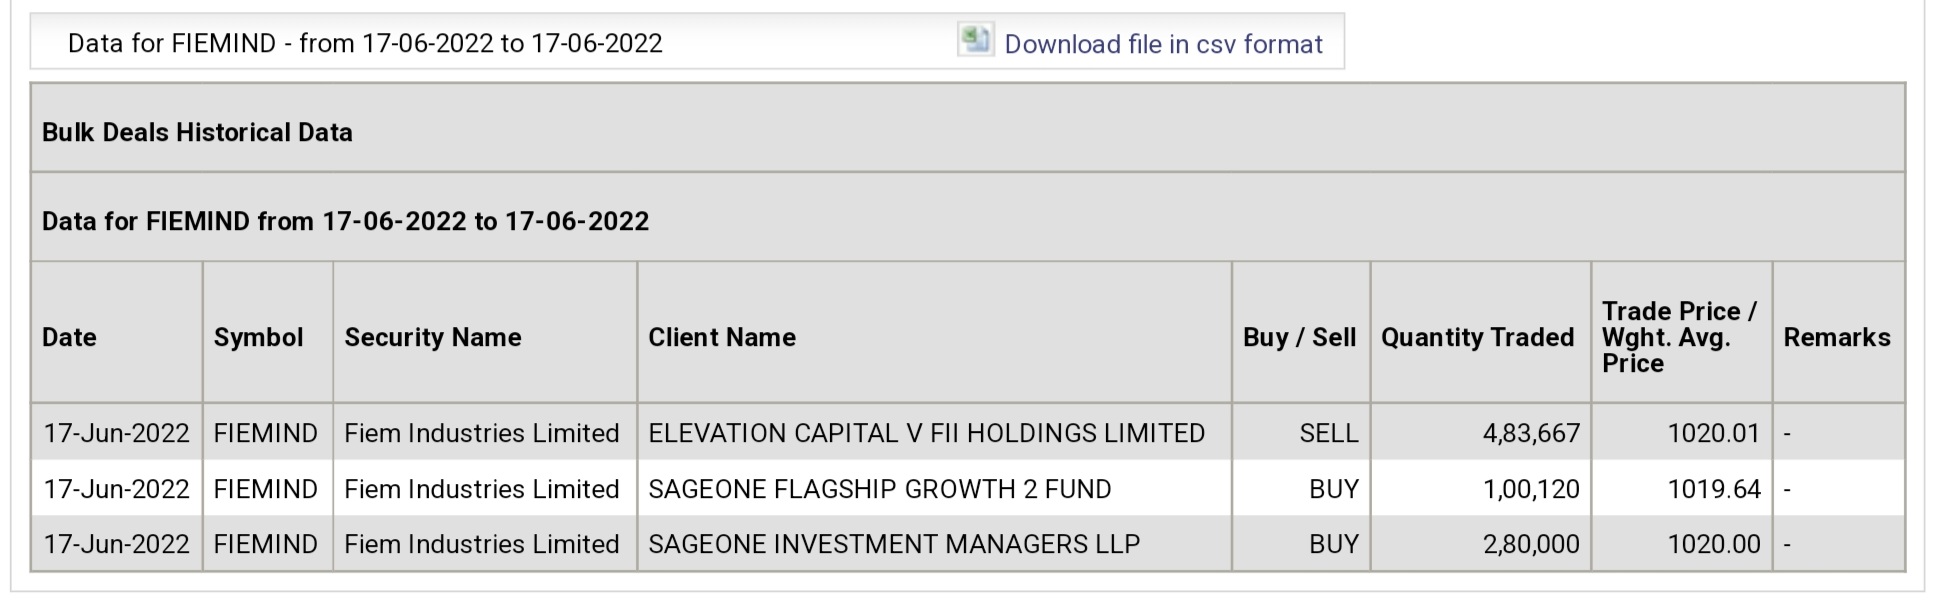
Sage One Investments led by Samit Vartak sir has invested via bulk deal while Elevation Capital sold the same.
7 Likes
Not related to discussion here but I’ve always been fascinated by rear view mirror alternatives.
1 Like

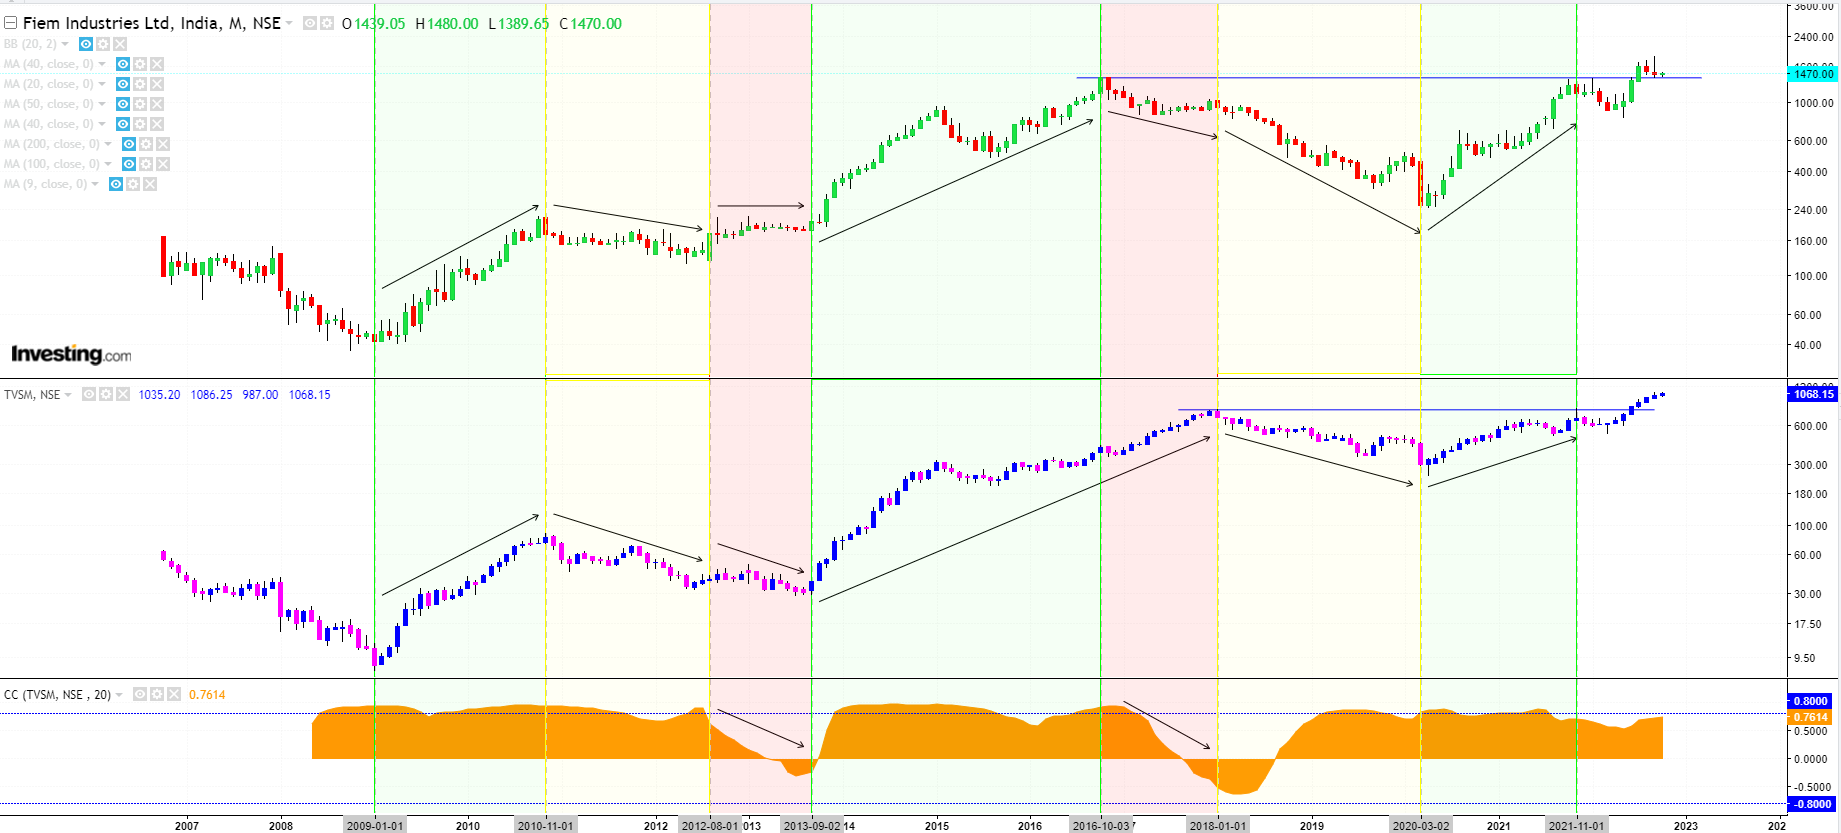
Analysis of the High Correlation in price movements between Fiem Ind and one of its top clients TVS Motors::
Long trending up and down moves are highly correlated > 0.80-0.85 ( Green & Yellow Zones)
2 instances where Correlation turns from positive to negative (Red zones)
Both stocks br eaking out of 5-6 year plus bases. Correlation still maintaining at 0.76-0.80.

7 Likes
Excellent results from Fiem. 17% QoQ growth in revenues, 25% YoY growth in revenues. EBITDA margins expand QoQ by 100bps.
Full results here.
5 Likes

Q2 FY22 Concall summary (link):
Overall industry 2-W production volume – 5.6 M units / 8% growth YoY and 17% QoQ. Driven by good Monson. Festive season has worked well. Commodity price easing out and Chip availability will improve the things forward.
FIEM specific - 25% YoY and 18% QoQ growth for FIEM. Q2 always better than Q3. Good growth in plastic mould and Mirro segment – is reflection of industry growth particularly for or Honda and Suzuki. Export dip due to EU crisis. Harely division volume is going strong. Thailand and US market.
EBIDTA margin
- 13.52%, 12.48% in Q2’FY22. Historically it has been ~12%. Is the increased margin of 13%+ stainable? Guidance is for ~13%. Employee benefit cost is going high YoY and QoQ – 12.08%. increase due to sales.
- Raw material cost – are always pass-through.
EV lighting Industry –
- 560% growth on a very small base. Volume is 2.7 Lac. Deep penetration will help growth.
- 4% -5% contribution in overall revenue.
FIEM EV market share –
- working with 20 OEMs. Currently engagement with top 10. New competitions not yet. Is LUMAX, Uno Minda eating into our market share? – existing customers will continue fighting for turf however no signficant threat. FIEM is sole supplier for Okinawa, Revolt. ~4% revenue from EV segment.
- Realization difference between EV and ICE – customer payes tooling cost for EV. Realization is better in EV.
LED share -
- 47%. Fast adoption of tech. Heading towards 60%. 100% new projects are all LEDs. Even for existing like Honda etc are also adopting to LED. LED has 2X and upwords realizations. Margin can move upwards.
Growth:
- 2W recovery from FY19, industry is really growing. Will be gradual but in the direction. New model for next FY. Further visibility by next Q.
- Working with Hero. Is in WIP. Few models to be launched next year. Will ramp up gradually. Contacted for new models only. Contacted for LEDs for Hero.
- Very less of replacement ~5%. Have been restricted by OEM for doing replacement market.
- Working on 4W penetration. Will be able to share updates once have one.
Product market share share by customers:
| Headlamp | TailLamp | Rear view Mirror | Winker | |
|---|---|---|---|---|
| HMIS | 40% | 76% | 100% | 85% |
| TVS | 73% | 69% | 55% | 82% |
| Yamaha | 91% | 64% | 32% | 5% |
| Suzuki | 80% | 80% | 100% | 23% |
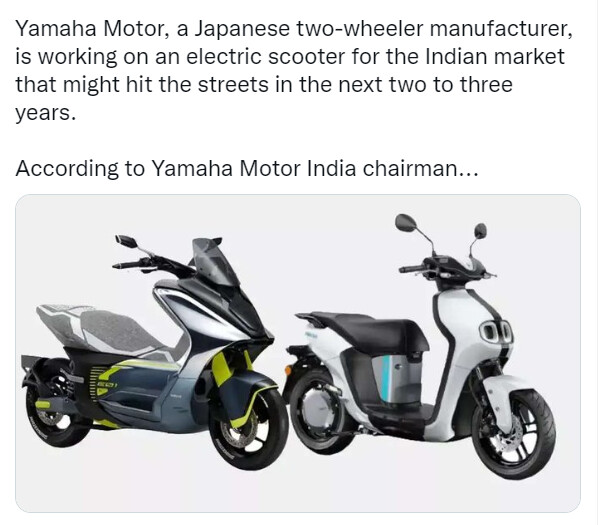
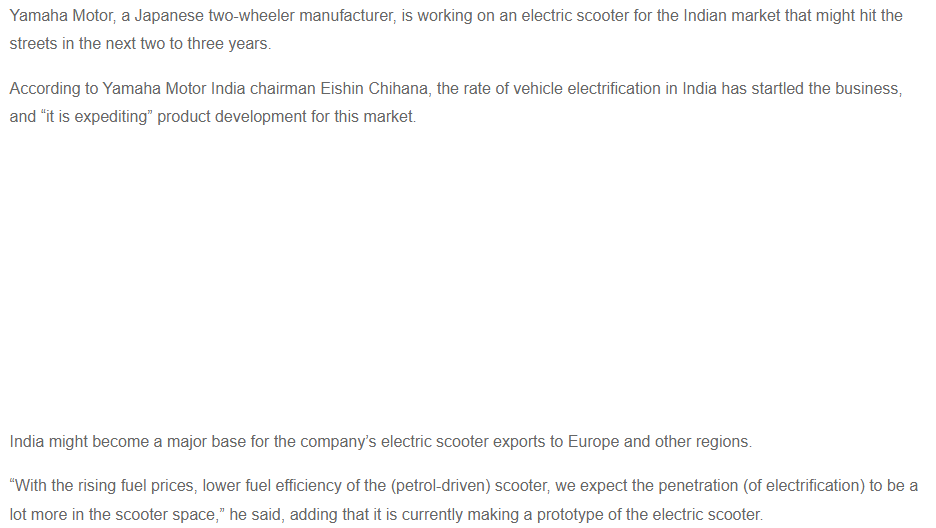
- Is there any slow down in Yamaha due to export slow down? Not much volume and value de-growth. In fact new models are launching Q1FY23.
- HMIS – our growth not matching with Honda growth. This quarter most growth is due to Honda.
- Ather – Not working with Ather.
Capacity Utilization - 80%+ Adding capacity in south since there are business opportunities.
CAPEX – 10.3 Crs incurred so far. Total projected Capex of 50 to 75 Crs. mostly in south India from internal accruals. Have 4 plants in south. Focus on adjacencies. May need significant large capex for new products. (visibility by year end).
- Margin profiles for new products – rear view mirror is an old product. Blended is 13% range.
- Railway business share – focus area is automotive only.
- Export is very minuscule. Indirect supply from domestic OEMs. Yamaha has significant re-routing for overseas.
- Customer specification is most critical factor – raw material indexation by customer + value-add based on a formula.
- Also, looking at other opportunities (in-organics??). Open for exploration.
Overall good top line growth and margin expansion. Sinc last couple of calls, management has been guiding about 15% -20% which looks to be feasible 2W industry inching back to historical volumes. Sustenance of margin could be key monitorable.
Also, purely from reported numbers perspective, most remarkable aspect has been good increase in cash and cash equivalent to ~135 Crs. primarily driven by reduction in trade payable (~55 Crs.), 20 Crs from JV sales and MF liquidation of 26 Crs. As a possibility, this Cash built -by is significant in case something metalizes on inorganic avenues that management is speaking about.
Thanks,
Tarun
Disc: Invested
16 Likes
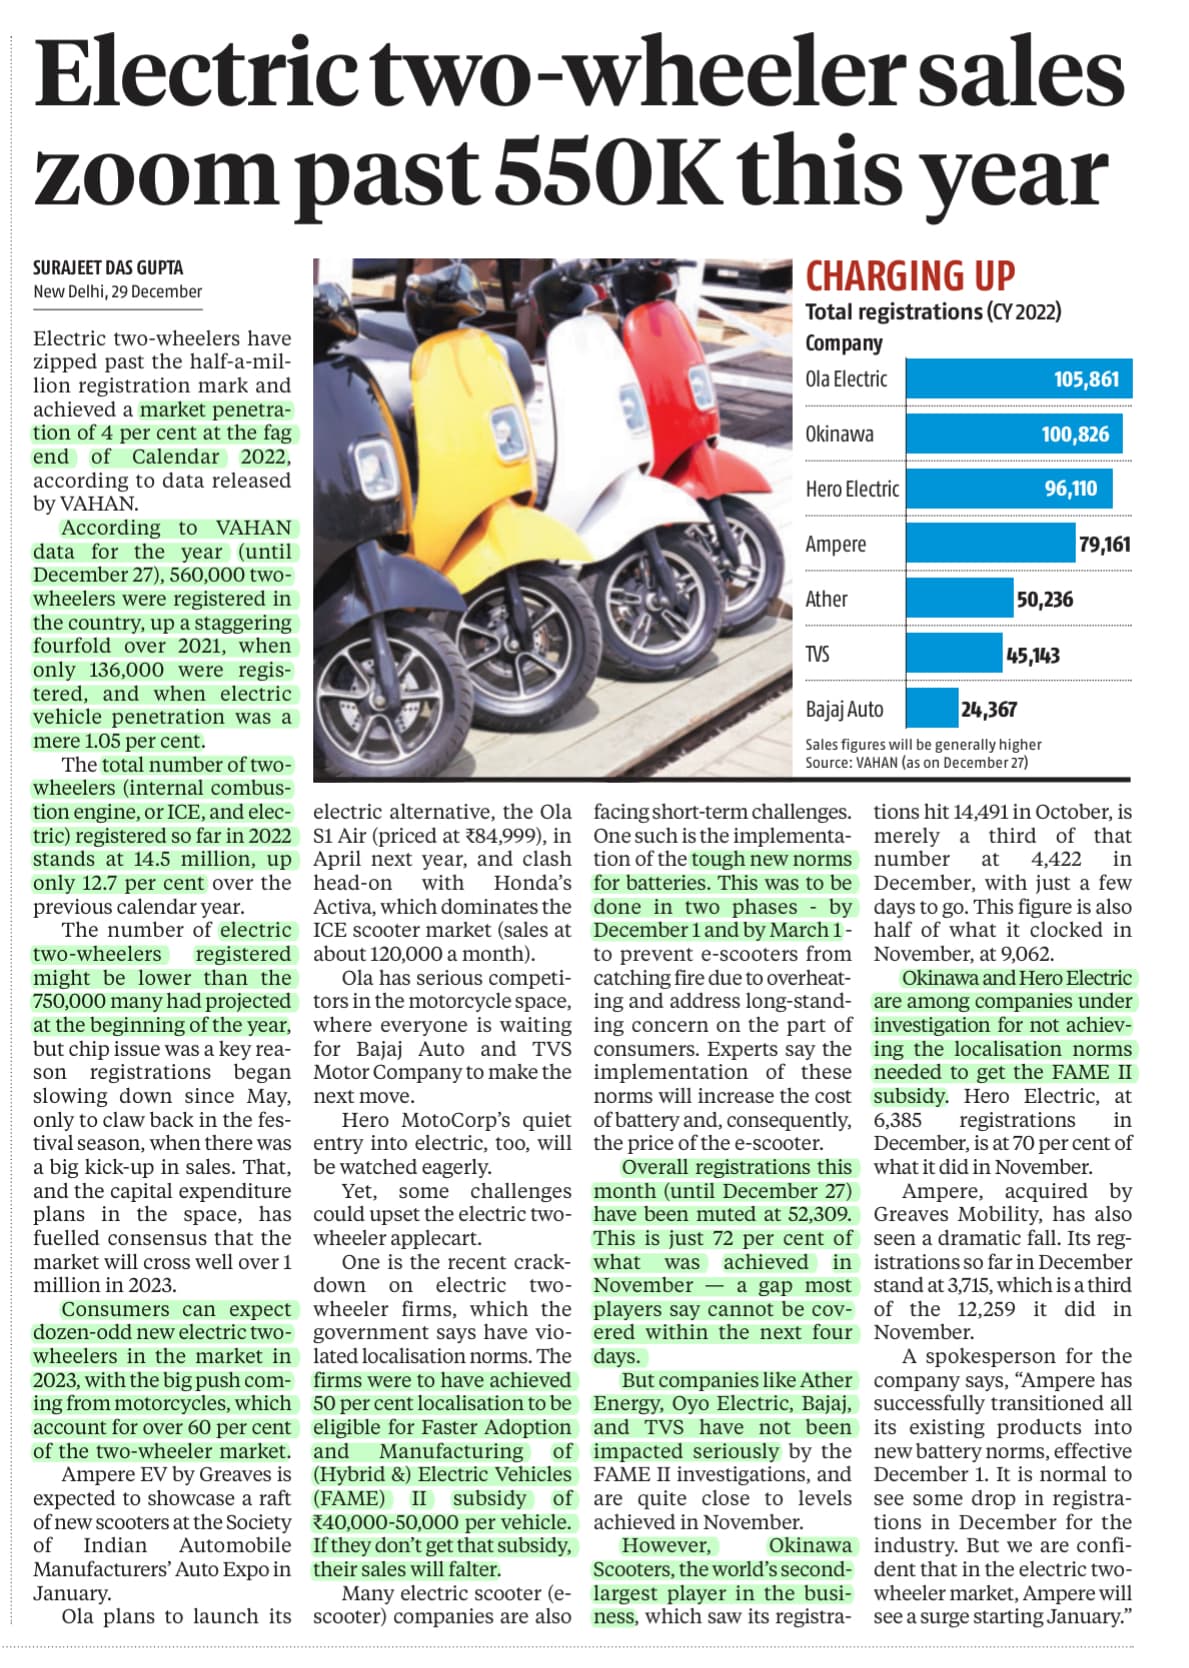

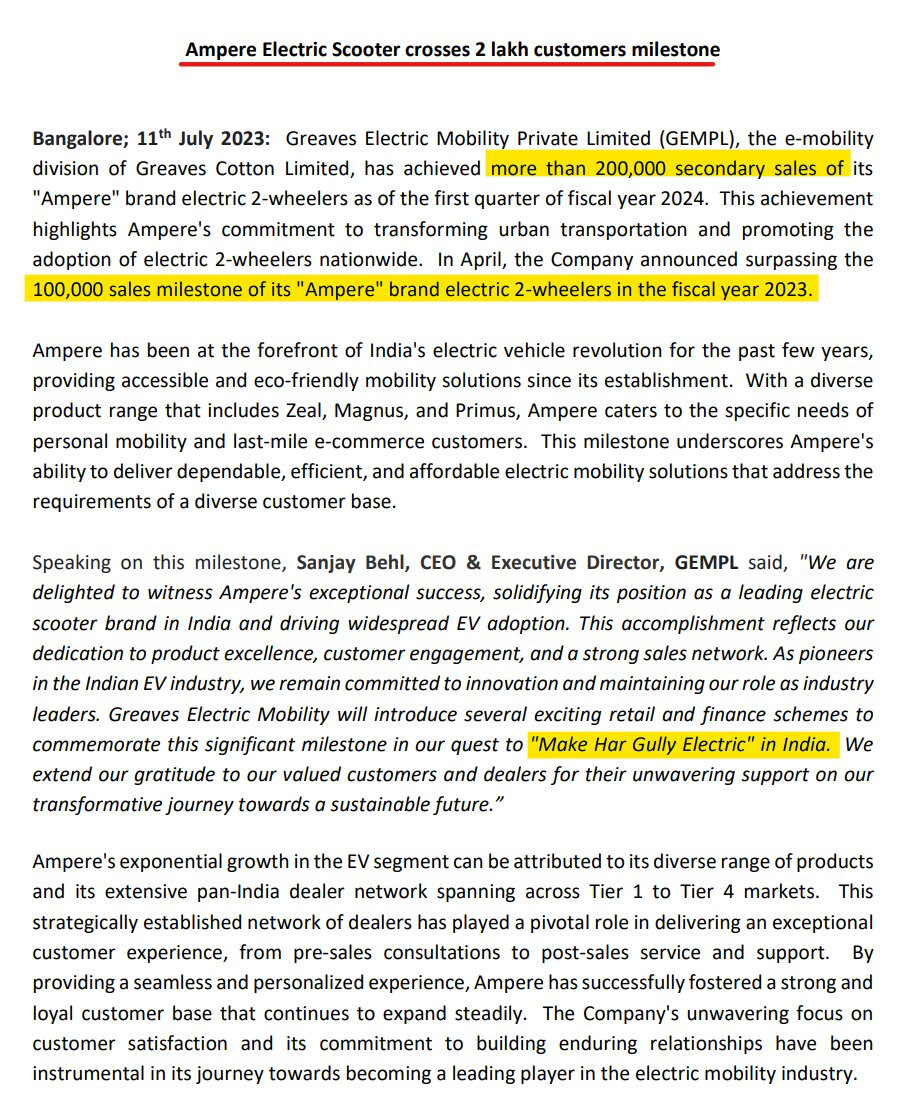
FAME II subsidy disbursal has been stopped by GOI to 6 major EV 2W companies due to gross violations of localisation norms. The affected companies are - Hero Electric, Okinawa, Jitendra EV, Ampere, Revolt and Okoye.
4 of these - Okinawa, Hero Electric, Ampere and Revolt are FIEM customers. Need to understand from Management in the upcoming concall, what is the net impact of this on Ola. Although % of business would be relatively small, but all of this business was high margin LED lighting.
5 Likes
2W-EV.pdf (4.0 MB)
1 Like
Very interesting Q4 call by Fiem. Some key triggers discussed, PFB my notes.
-
Revenue growth triggers
-
Gogoro
-
Already developed headlamp, taillamp and blinkers for 2 models for India and export markets
-
Hub motor assembly, motor controller and ECU
-
Has started assembly and from August commercial revenues are expected to start; But significant ramp-ups will happen from FY25; Homologation and regulatory requirements already fulfilled
-
Will start with CKD which will be indigenized in a phased manner
-
Investment quantum not yet finalized – will inform in next quarter
-
Margins will be like Fiem existing business margins
-
-
Total content per vehicle is going to be 15-18k INR
-
For supplies, capacities will be put up in existing Tapukhera Plant (RJ)
-
-
4W
-
Appointed Vineet Sahani as CEO & Whole Time Director; Has a lot of experience in 4W having been CEO of Minda & Lumax & Varroc (Last role Lumax Group CEO)
-
No timelines yet – company expects good customer response due to Vineet’s customer relations
-
-
2W demand uptick post Covid
-
20-25% lower than peak volumes
-
Expects double digit industry volume growth over next 2 years; Could also surprise higher
-
-
Hero
- 1 product has already started from April – ICE model
- One more model to be started from August – ICE model
- EV model products are under development
- Total 3 Hero projects with FIEM
-
Yamaha – Yamaha 3 new models; 280Cr FY23
-
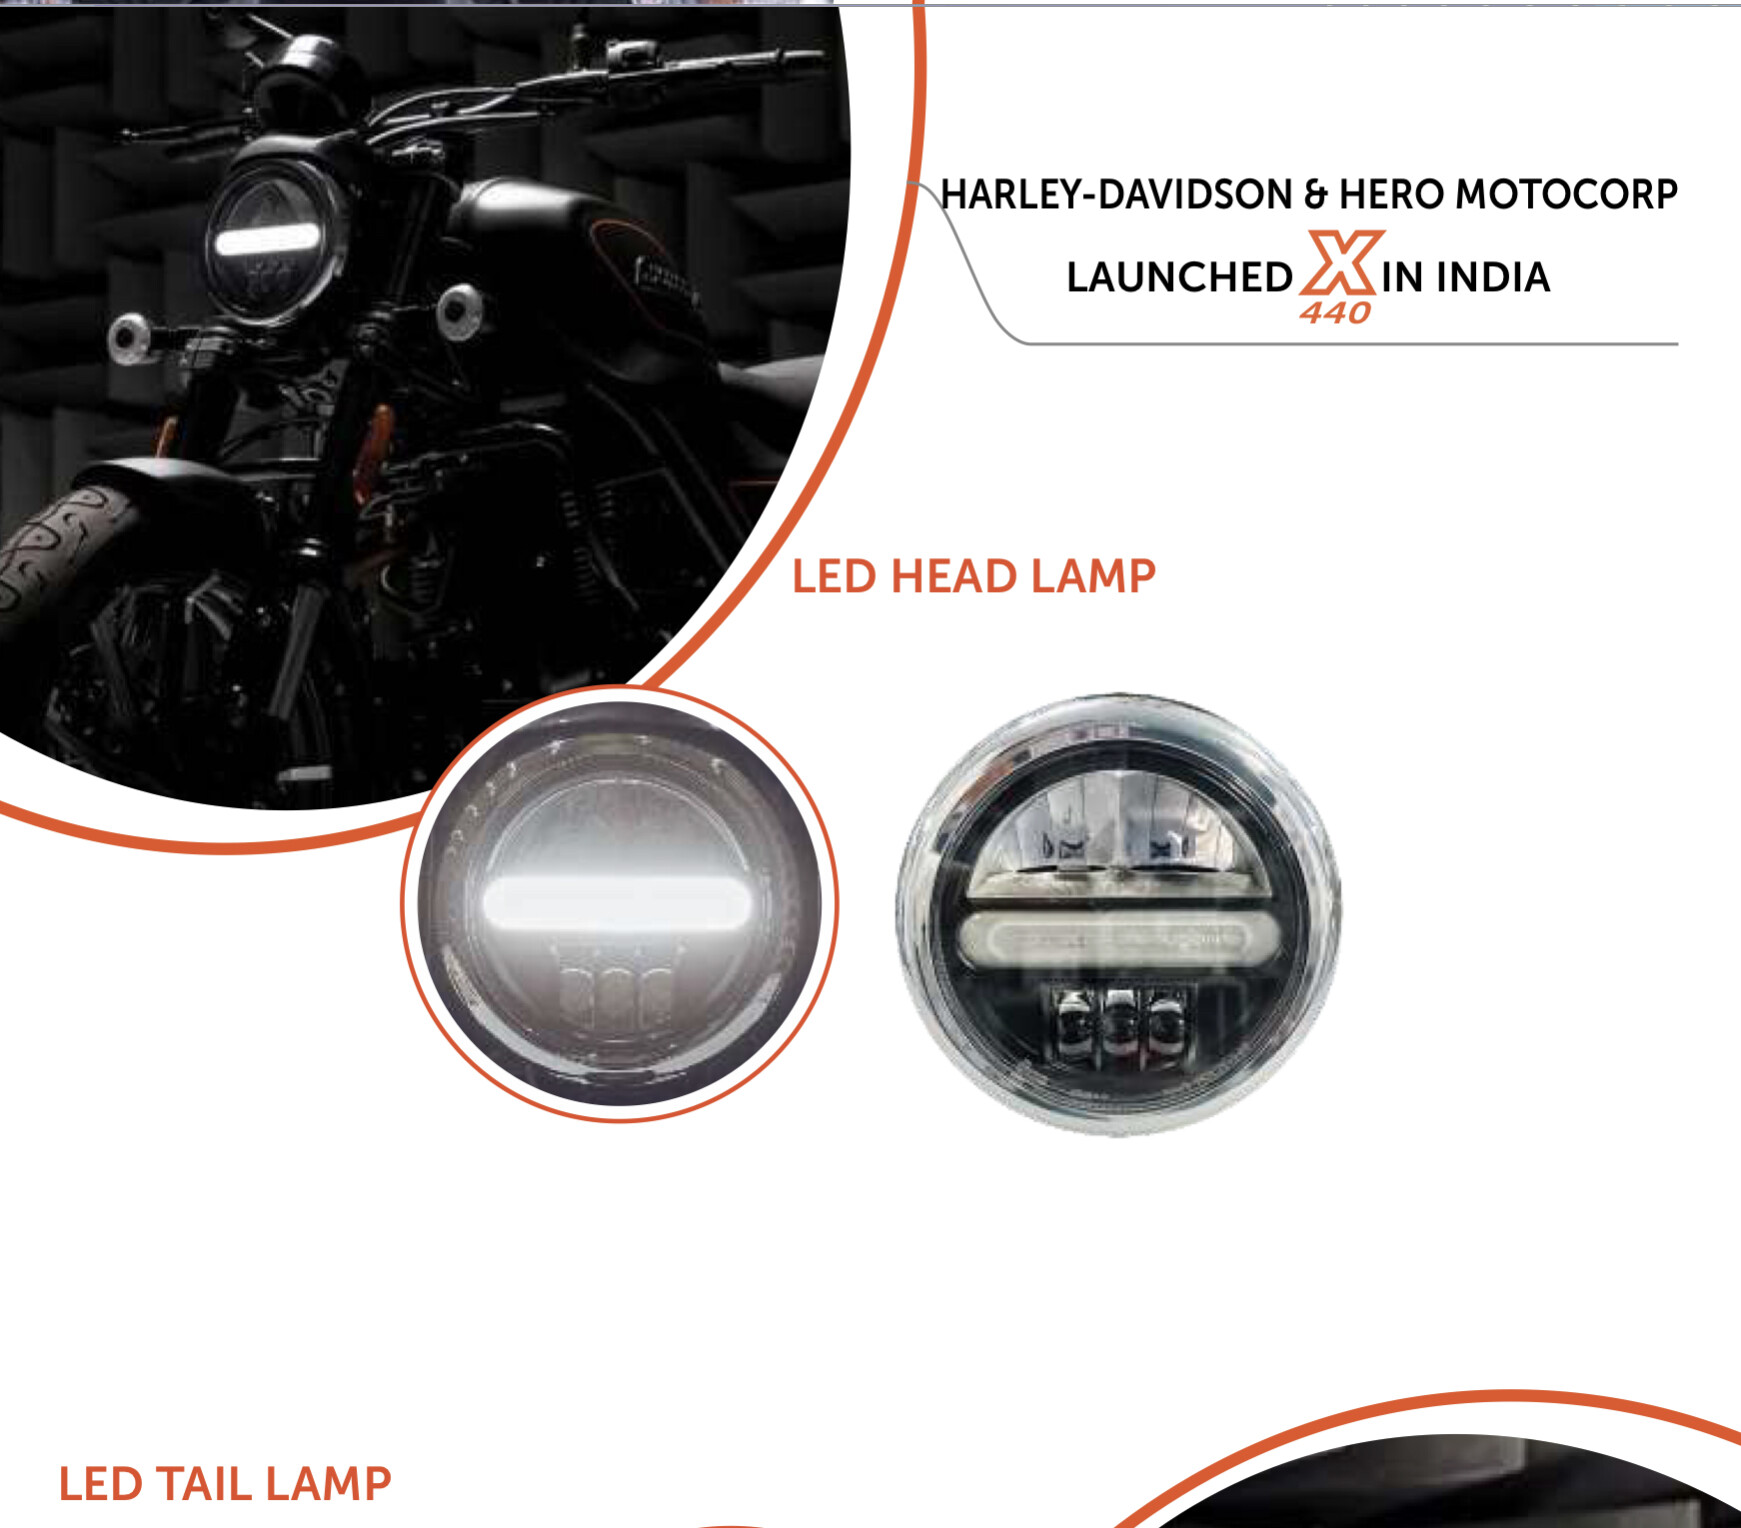
Harley Davidson – 38Cr; Exports to Thailand and USA; Growth will be moderate
-
EV
-
5% share of revenue as of now, total 28 EV customers
-
Some customers badly impacted; Others are growing sales
-
TVS iCube products are under development; supplies to start in a few months
-
-
-
Order book – 950Cr
-
Capex guidance – 75-100Cr capex over next 18 months for regular business – does not include any capex for 4W or Gogoro
-
Guidance – Guides for outperforming industry growth
-
Capacity utilization – Current capacity can take Fiem to 2300-2400Cr depending on product composition; With LED the turnover can be higher too; Capacity enough for organic growth; New businesses will require new capex which are yet to be finalized
-
Margin growth triggers
- LED mix for Q4 – 56%; Expect a mix of 60-65% for next 2 years
- EBITDAM to remain in 13.5%
- Export vs domestic margins are same
- Higher margins this Q due to price escalation in last Q
14 Likes