
I think this does not give the complete picture without imports. What if we import 1 L Cr so that we export for 1.2 L Cr ? To my little understanding of macros, difference between Export and Import would be a better measure.
2 Likes
Nothing can give complete picture. What you can ideally see is corporate profit since value addition is in profits. Even corporate profit to GDP is at all time multi decade high.
Yes they are linked, if you see our electronics parts imports and exports numbers, there will be a pro rata increase in imports and exports since the mobile phone PLI was announced. Companies are importing components and parts and exporting assembled phones since we don’t make many of the components. Not much value add right now.
1 Like
Reg. Corp profits. For a meaningful comparison one need to account for corp. tax cuts. Before 2019 we had 35 % and currently 25 %. About 28 % reduction in tax boosted bottom line. Is this Organic growth? I really don’t know. Better would be to compare Earnings before tax.
3 Likes
February 2023 update:
India’s overall exports(merchandise and services combined) in Feb 2023 are estimated at USD 63.02 Billion exhibiting positive growth of 7.81% over Feb-2022.
Merchandise exports in Feb-23 were USD 33.88 Billion compared to USD 37.15 Billion in Feb-22 negative growth of -8.8%.
Services sector continues to grow impressively with 29.15 USD Billion compared to 21.30 USD Billion for February month.
Overall imports in feb-23 is estimated at USD 65.85, exhibiting a negative growth of -4.38% over the same period of last year.
Under merchandise exports, 14 out of 30 sectors exhibited positive growth in Feb -23 as compared to feb-22.
Commodities with positive growth and % for the month of feb-23:
Electronic goods:29.85%
Oil meals:220.96%
Oil seeds: 9.4%
Iron ore:51.37%
Rice : 11.75%
Fruits and vegetables: 17.42%
Ceramic products & glassware:11.5%
Marine products: 4.96%
Other cereals: 10.65%
Spices: 30.85%
Cereal preparation & processed items:5.22%
Drugs and pharmaceuticals:4.72%
Mica ,coal & other ores: 2.97%
Gems and jewellery: 13.76%
https://pib.gov.in/PressReleseDetail.aspx?PRID=1907162
9 Likes
March 2023 update:
India’s overall exports(merchandise and services combined) in March 2023 are estimated at USD 66.14 Billion exhibiting negative growth of -7.53% over March-2022.
Overall imports in March 23 is estimated at USD 72.18 billion, a negative growth of -7.98% over March-22.
Merchandise exports in March-23 were USD 38.38 Billion compared to USD 44.57 Billion in March-22 negative growth of -13.8%.
Services sector export for March-23 is 27.75 USD Billion compared to 26.95 USD Billion for March 22.
Under merchandise exports, 13 out of 30 key sectors exhibited positive growth in March -23 as compared to March-22.
Commodities with positive growth and % for the month of March-23:
Oil meals:156.56%
Oil seeds: 99.5%
Electronic goods: 57.36%
Coffee: 17.86%
Marine products: 12.85%
Fruits and vegetables: 11.37%
Rice: 10.02%
Ceramic products & glassware: 9.73%
Iron ore: 6.85%
Drugs and pharmaceuticals: 4.19%
Meat, dairy & poultry products: 3.44%
Tobacco: 3.04%
9 Likes
April 2023 update:
India’s overall exports(merchandise and services combined) in April 2023 are estimated at USD 65.02 Billion exhibiting positive growth of 2% over April-2022.
Merchandise exports in April-23 were USD 34.66 Billion compared to USD 39.70 Billion in April-22 negative growth of -14.5%.
Services sector export for April-23 is 30.36 USD Billion compared to 24.05 USD Billion in April 22 ,Positive growth of 26.2%.
Overall imports in April 23 is estimated at USD 66.40 billion, a negative growth of -7.92% over April-22.
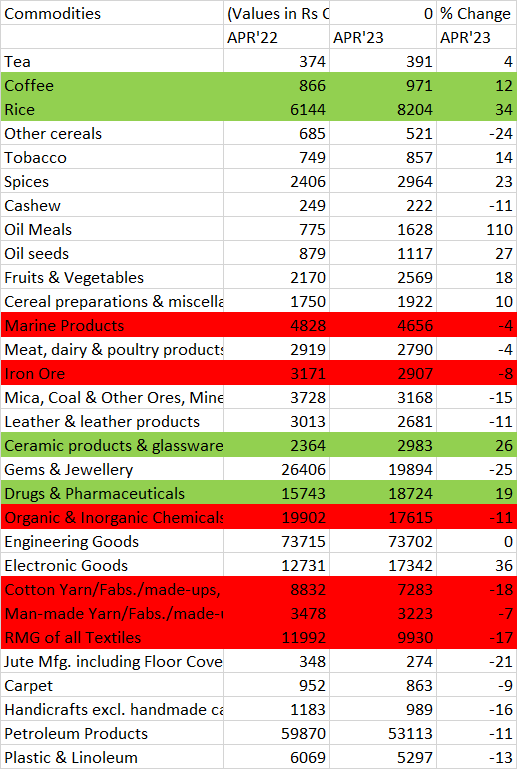
Coffee exports grow at 12%.
Rice exports continued positive growth up by 34% for April-23
Marine products exports de-grew by -4% for the month.
Iron ore exports declined by -8%.
Ceramic products and glassware exports increased by 26% for the month.
Pharma exports grew at 26% for the month.
Chemicals exports are down by -11% for the month.
RMG of textiles, cotton, and yarn exports remained negative.
12 Likes
May 2023 update:
**India’s overall exports(merchandise and services combined) in May 2023 is estimated at USD 60.29 Billion exhibiting negative growth of -5.99% over May-2022.
Merchandise exports in May-23 were USD 34.98 Billion compared to USD 39.0 Billion in May-22, negative growth of -11.4%.
Services sector export for May-23 is 25.30 Billion compared to 25.13 Billion USD in May 22.
Overall imports during May 23 is estimated at USD 70.64 billion, a negative growth of -7.45% over May-22.
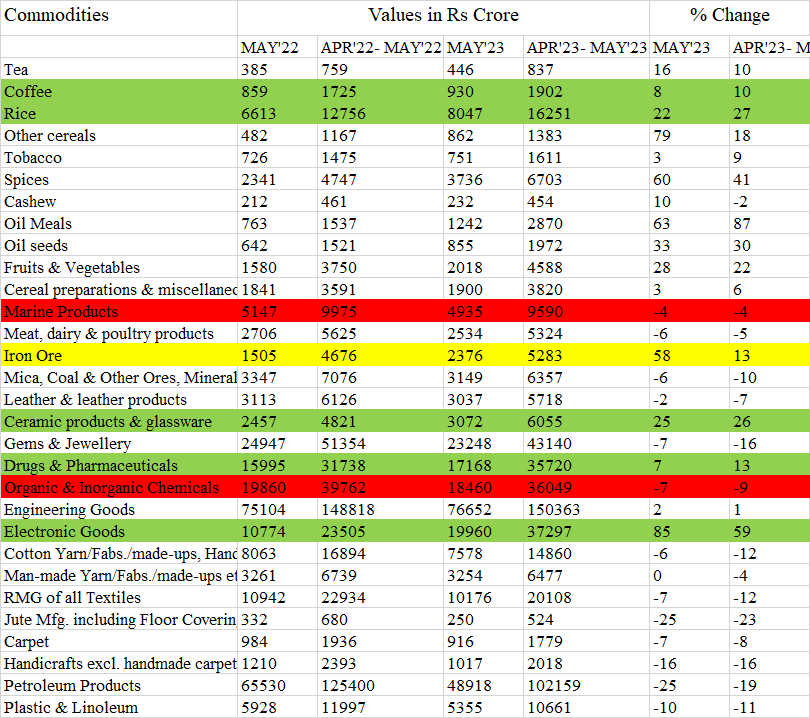
Coffee exports grow at 8% YoY for the Month.
Rice exports continued positive growth, up by 21.6% for May-23
Marine products exports remained negative -4% for the month.
Iron ore exports have rebounded up by 58% during May.
Ceramic products and glassware exports increased by 25% for the month.
Pharma exports grew at 7% for the month.
Chemicals exports continue to degrow at -7% for the month.
Electronic goods continue to show impressive growth of 85%.
RMG of textiles, cotton, and yarn exports remained negative.
16 Likes
June 2023 update:
India’s overall exports(merchandise and services combined) during June 2023 is estimated at USD 60.09 Billion exhibiting negative growth of -13.16% over June-2022.
Merchandise exports in June-23 is USD 32.97 Billion compared to USD 42.38 Billion in june-22, negative growth of -22%.
Services sector export for June-23 is 27.12 Billion compared to 26.92 Billion USD during June- 22.
Overall imports during June 23 is estimated at USD 68.98 billion, a negative growth of -13.9% over June -22 import value of 80.12 Billion USD.
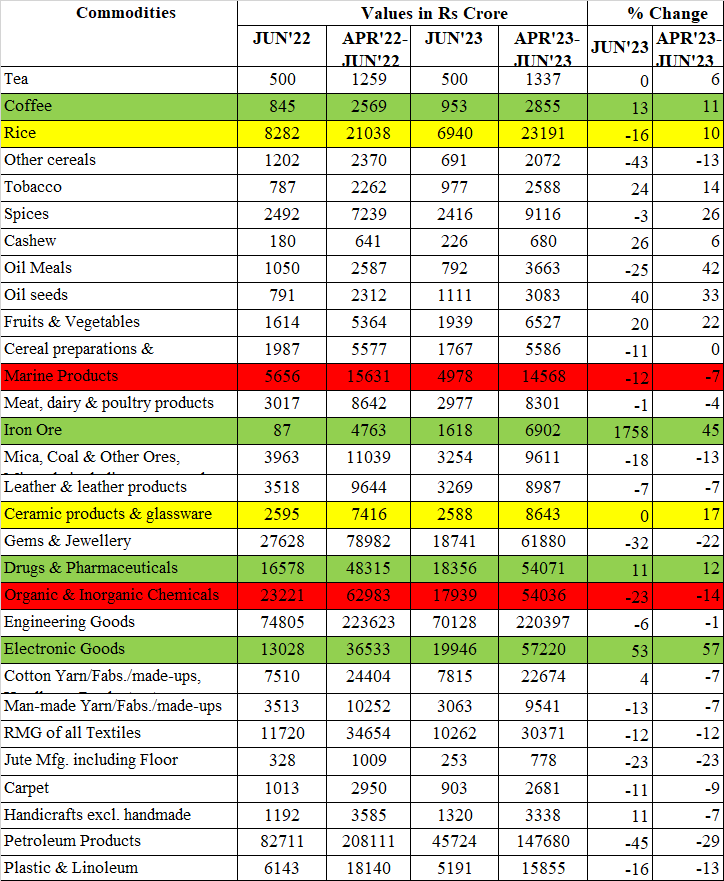
Coffee exports grow at 13% YoY for the Month.
Rice exports have reversed the trend and degree by -16% during june.
Marine products exports remained negative -12%% for the month and -7% for the quarter.
Iron ore exports grew significantly on a low base last year. Trend remains positive during the last two months.
Ceramic products and glassware exports are flat for the month of June.
Pharma exports grew at 11% for the month.
Chemicals exports continue to degrow.
Electronic goods continued impressive export growth of 53% and 57% for the month and quarter respectively.
Textile segment exports continue to degrow.
june23.pdf (229.7 KB)
11 Likes
Would ‘coffee exports’ stand for both raw produce (beans) and processed (like instant coffee) please?
@PavanM I think it will include both raw and processed coffee export. They do not provide breakup.
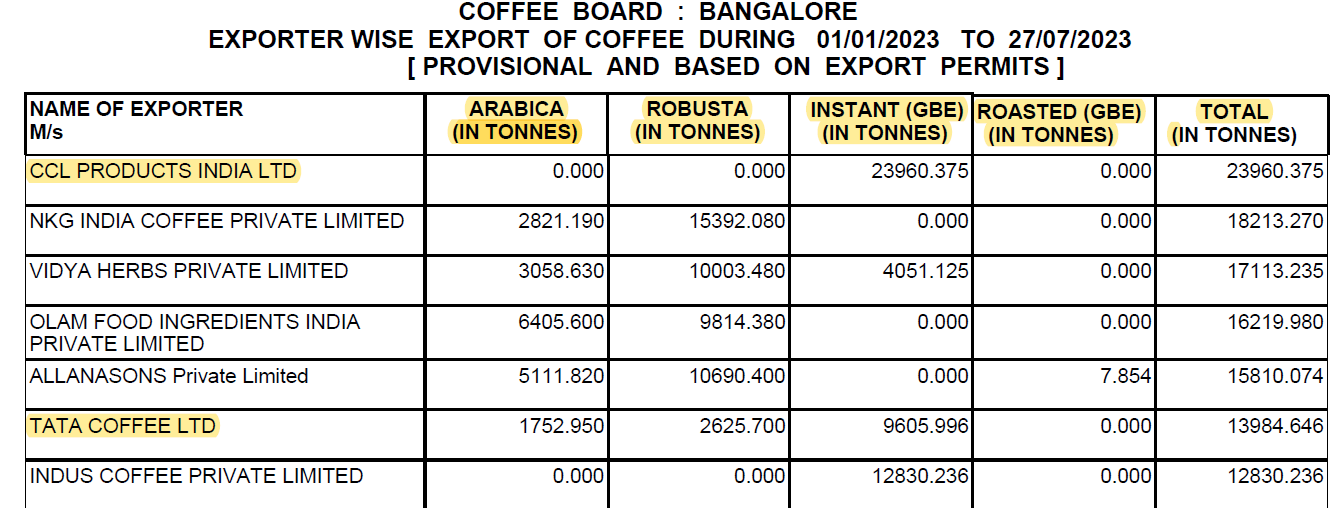
If you want know more in detail about coffee export and variants , coffee board of India is an excellent source. https://coffeeboard.gov.in/ExportInfo.aspx
Under exporter info all the details are available(based on permits issued) . I am attaching screen shots of the same for you reference.
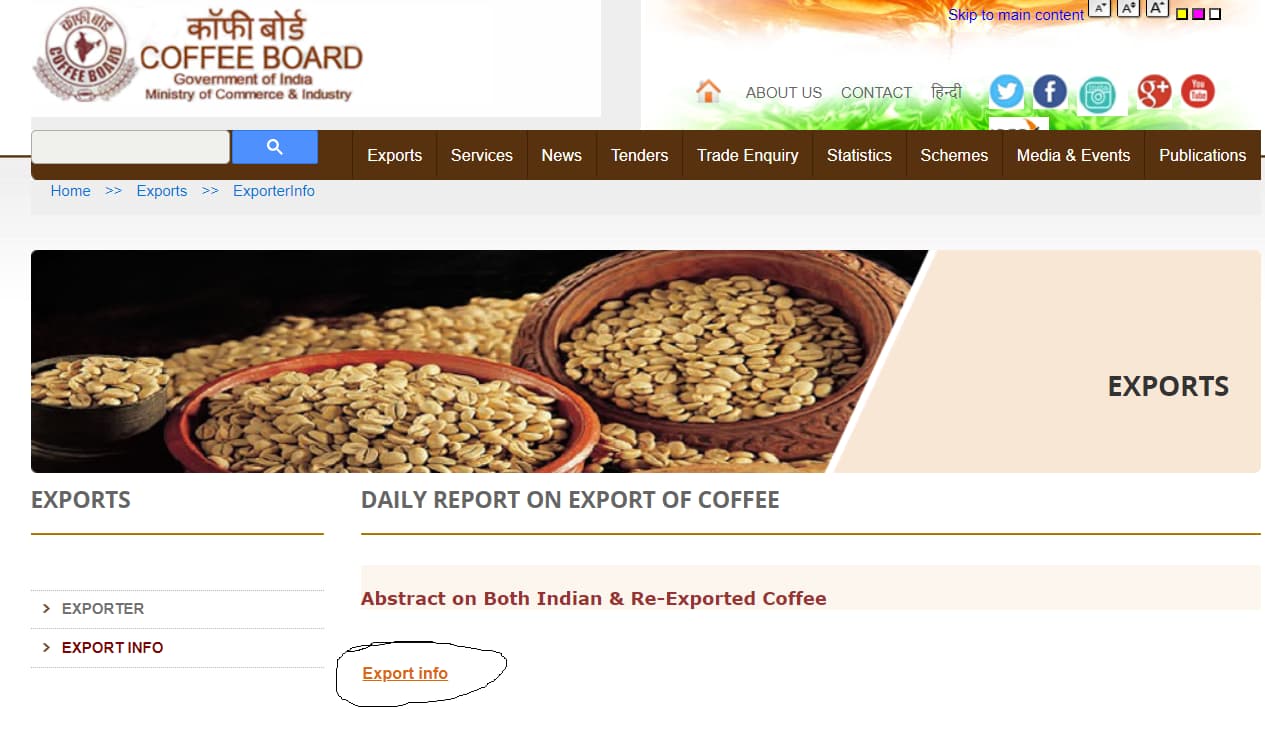
Export of Indian coffee and re-export data available on calander , financial and coffee year basis.
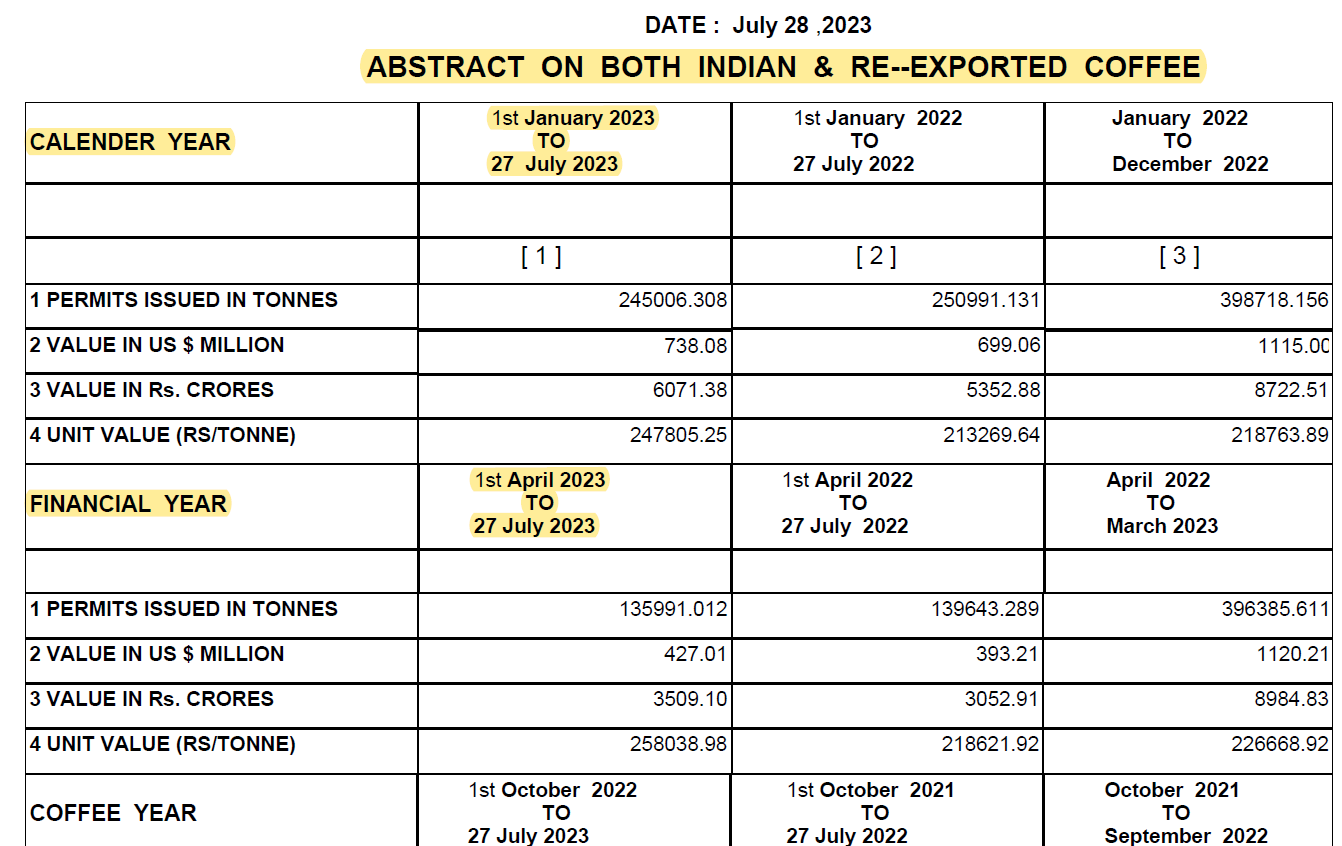
Based on variants of coffee like robusta,arabica and instant coffee:
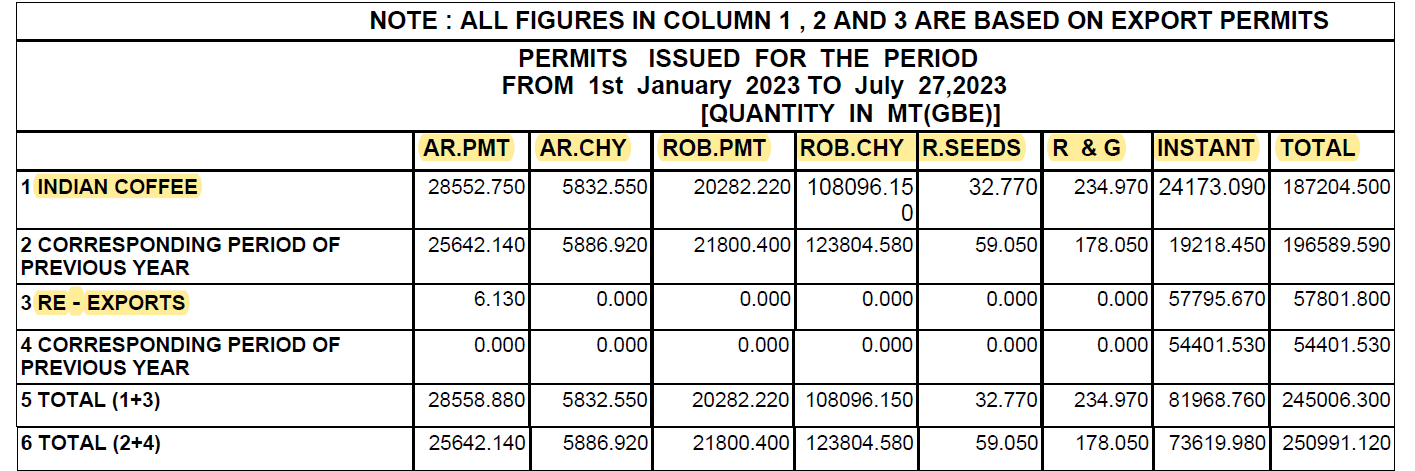
company wise data for CCL products and tata coffee also available.
9 Likes
JULY 23 UPDATE:
India’s overall exports(merchandise and services combined) during July 2023 is estimated at USD 59.43 Billion exhibiting negative growth of -5.06% over July-2022.
Merchandise exports in July-23 is USD 32.25 Billion compared to USD 38.34 Billion in july-22, negative growth of -16%.
Services sector export for July-23 is 27.17 Billion compared to 24.26 Billion USD during July- 22.
Overall imports during June 23 is estimated at USD 67.77 billion, a negative growth of -13% over july-22.
(Values in Rs.Crs)
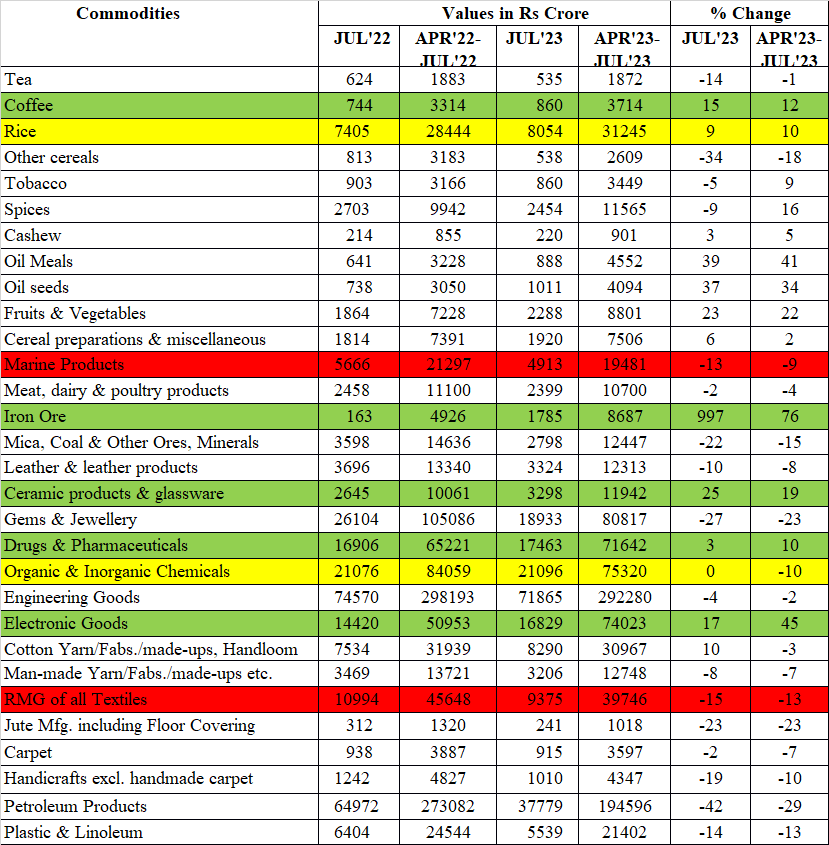
Coffee exports grow at 15% YoY for the month & 12% so far for FY.
Rice exports rose by 9% for the month.
Marine products exports remained negative.
Iron ore exports continue to grow significantly on a low base of last year.
Ceramic products and glassware exports up by 25% for the month and 19% so far in FY24.
Pharma exports grew moderately at 3% during july.
Chemicals exports remained flat for the month and down by 10% till July23.
Electronic goods continued impressive export growth up by 17% and 43% for the month and FY.
Textile segment exports continue to degrow.
doc2023814238701.pdf (117.3 KB)
16 Likes
@spartan Thank you for sharing the data with us. It is very useful.
May I know where this data can be sourced from? Is it freely available or paid?
2 Likes
August 23 update:
India’s overall exports(merchandise and services combined) during August 2023 is estimated at USD 60.87Billion exhibiting negative growth of -4.17% over August-2022.
Merchandise exports during August-23 is USD 34.48 Billion compared to USD 37.02Billion in Aug-22, negative growth of -6.8%.
Services sector export for Aug-23 is estimated at 26.39 Billion compared to 26.50 Billion USD during Aug- 22.
Overall imports during Aug 23 is estimated at USD 72.50 billion, a negative growth of -5.9% over Aug-22.
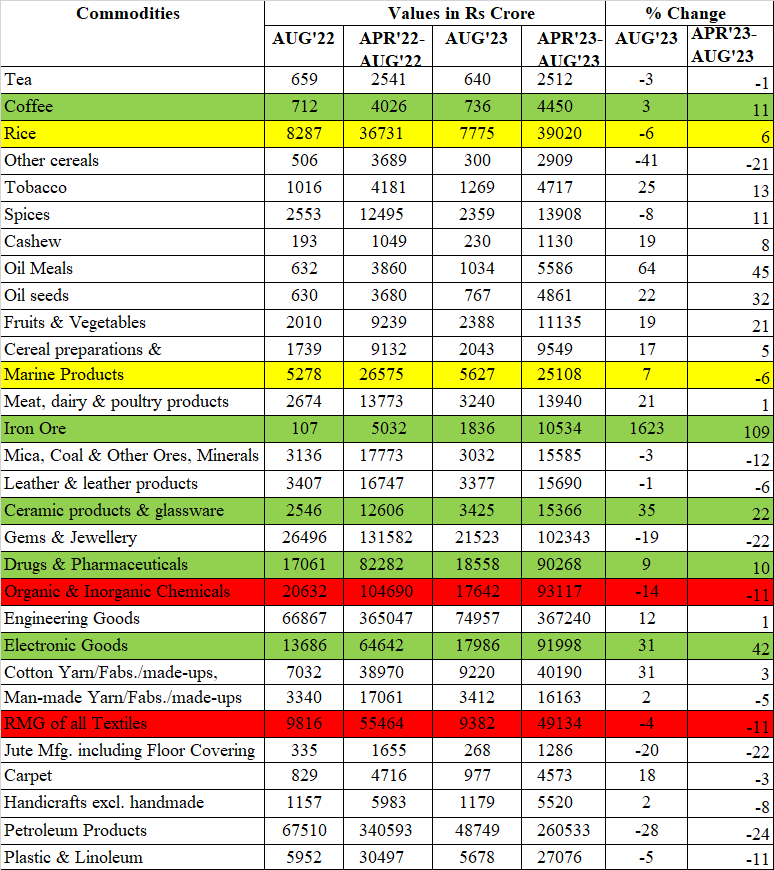
Coffee exports grow moderately at 3% YoY for the month & 12% so far for FY.
Rice exports reduced by -6% for the month( expected with govt measures to restrict rice export)
Marine products exports grew by 7%.(after 4 months of negative growth)
Iron ore exports continue to grow significantly on a low base of last year.
Ceramic products and glassware exports up by 35% for the month and 22% so far in FY24.
Pharma exports grew 9% during August and 10% for FY24.
Chemicals exports are down by -14%.
Electronic goods continued impressive export growth.
RMG of textiles are down by -4%, cotton yarn/fabs grew by 31% during August.
Link for quick estimates:Press Information Bureau
@Nitesh_Ranka Above data is freely available from the above source. The same data is also available @ https://commerce.gov.in/trade-statistics/latest-trade-figures/
13 Likes
Sept 23 update:
India’s overall exports(merchandise and services combined) during Sept 2023 is estimated at USD 63.84Billion exhibiting negative growth of -1.20% over Sept-2022.
Merchandise exports during Sept-23 is USD 34.47 Billion compared to USD 35.39 Billion in sept-22, negative growth of -2.6%.
Services sector export for Sept-23 is estimated at 29.37 Billion compared to 29.22 Billion USD during Sept- 22.
Overall imports during sept 23 is estimated at USD 68.75 billion, a negative growth of -13.67% over Sept-22.
Coffee exports reduced by -4% YoY for the month which has happened after many months of good exports growth.
Rice exports reduced by -25% for the month(2nd consecutive month of degrowth).
Marine products exports grew by 5%.(2nd consecutive month of + growth)
Iron ore exports continue to grow significantly.
Ceramic products and glassware exports up by 50% for the month and 20% so far in FY24.
Pharma exports grew 9% for the September month and 5% so far in FY24.
Chemicals exports continue to remain negative.
Electronic goods exports down for the first time compared to same month of last year but up by 28% so far in Fy24.
Cotton yarn/fabs grew by 27% during the month , RMG of textiles remains negative.
13 Likes
Exports from key industries in India
Software ~$150B
Chemicals ~$30B
Pharma ~$25B
EMS ~$25B
Software growing at 10% creates a new pharma export industry every two years
Source:Tijori
3 Likes
October 2023 update:
India’s overall exports(merchandise and services combined) during Oct 2023 is estimated at USD 62.26 Billion exhibiting positive growth of 9.43% over October-2022.
Merchandise exports during Oct-23 is USD 33.57 Billion compared to USD 31.60Billion in Oct-22, positive growth of 6.2%.
Services sector export for Oct-23 is estimated at 28.70 Billion compared to 25.30 Billion USD during Oct- 22.
Overall imports during October 23 is estimated at USD 79.35 billion exhibiting positive growth of 11.10% over OCT-22.
Overall trade deficit during April-October reduced by 35.86% from USD 89.86 Billion USD in 2022 to 57.14 Billion USD.
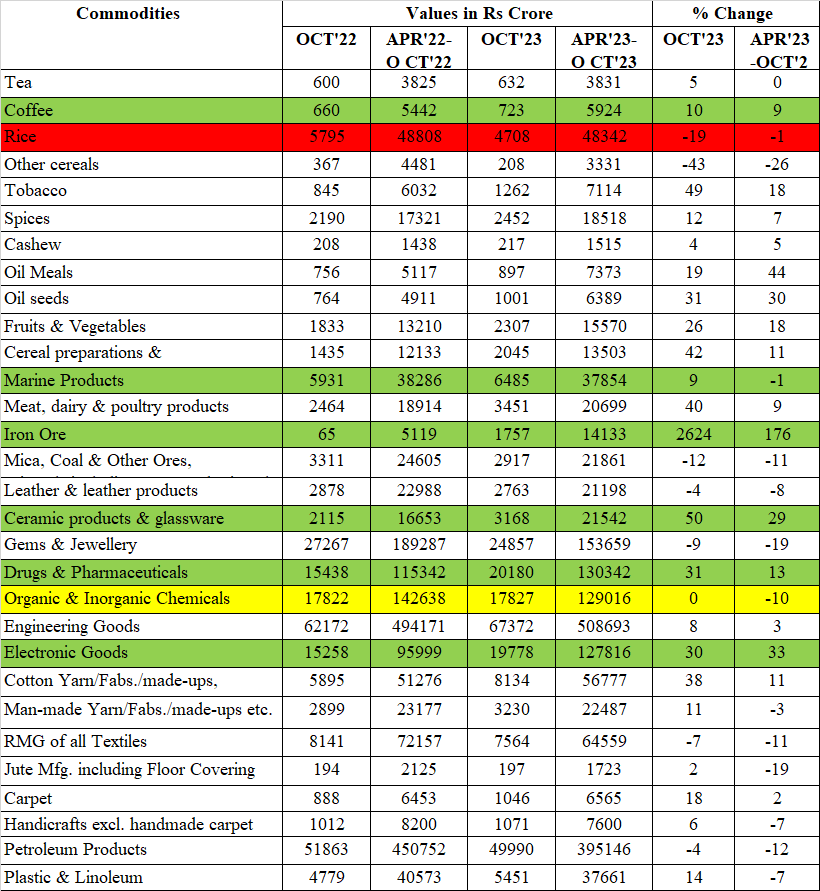
Coffee exports growth of 9.6%for the month and 8.8% till Oct.
Rice exports reduced by -19% for the month(3rd consecutive month of degrowth)
Marine products exports grew by 9%.(3rd consecutive month of + growth)
Iron ore exports continue to grow significantly on a low base of last year.
Ceramic products and glassware exports up by 50% for the month and 29% so far in FY24.
Pharma exports grew 30% for October month and 13% so far in FY24.
Chemicals exports remained flat during the month.
Electronic goods exports are back to positive growth after dipping during last month.
Cotton yarn/fabs grew by 38% during the month , RMG of textiles remains negative.
11 Likes
November 23 update:
India’s overall exports(merchandise and services combined) during Nov 2023 is estimated at USD 62.58 Billion exhibiting positive growth of 1.23% over Nov-2022.
Merchandise exports during Nov-23 is USD 33.90 Billion compared to USD 34.89 Billion in Nov-22, negative growth of -2.8%.
Services sector export during Nov-23 is estimated at 28.69 Billion compared to 26.69 Billion USD during Nov- 22.
Overall imports during Nov 23 is estimated at USD 67.88 billion exhibiting negative growth of -6.16% over Nov-22.
Overall trade deficit during April-Nov improves by 38.79% from USD 100.38 Billion in 2022 to USD 61.44 Billion in 2023.
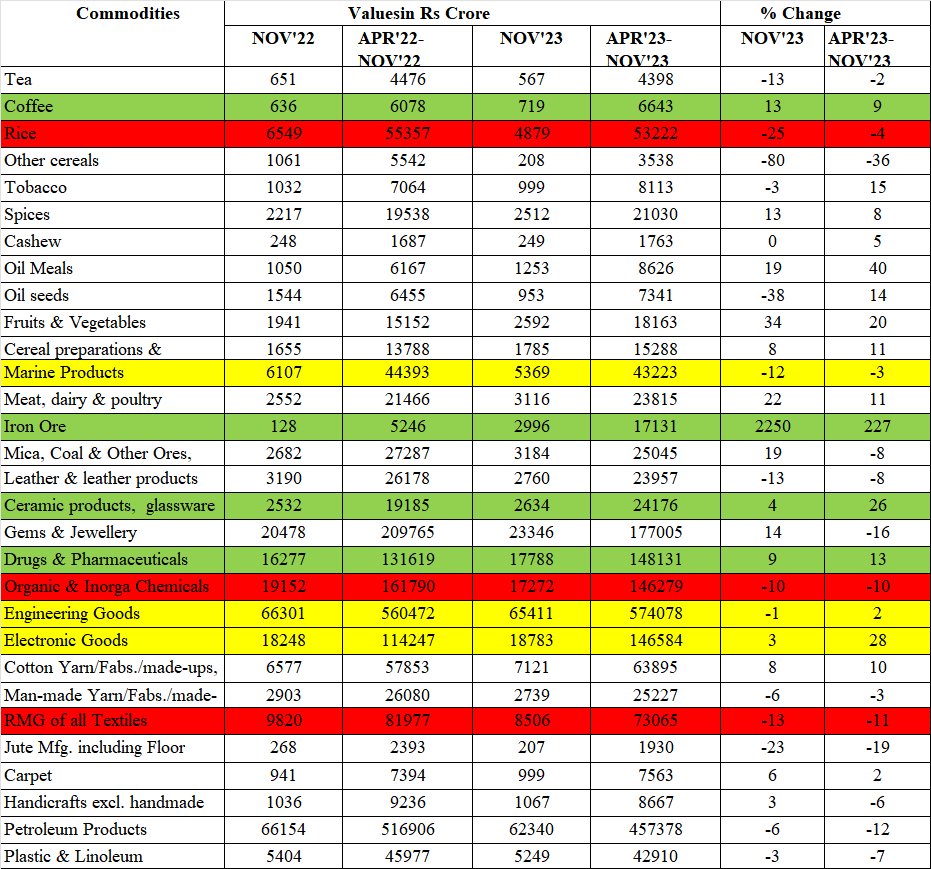
Coffee exports continue to grow 13%for the month and 9% till Nov-23.
Rice exports’ downtrend continues with negative growth of -25% for the month.
Marine products exports fell by -12% during Nov ( was positive during October ).
Iron ore exports continue to grow significantly on a low base of last year.
Ceramic products and glassware exports moderated to 4% compared to high growth seen during the last few months.
Pharma exports grew 9% for November month and 13% so far in FY24.
Chemicals exports fell by -10% during Nov-23.
Cotton yarn/fabs grew by 8% during the month , RMG of textiles remains negative.
9 Likes
Hi spartan. Could you possibly give the link of source and guide if its possible to get this source feed into own email. regards
December 2023 update:
India’s overall exports(merchandise and services combined) during Dec 2023 is estimated at USD 66.33 Billion, a negative growth of -4.24% over Dec-2022.
Merchandise exports during Dec-23 is USD 38.45 Billion compared to USD 38.08 Billion in Dec-22.
Services sector export during Dec-23 is estimated at 27.88 Billion compared to 31.19 Billion USD during Dec- 22.
Overall imports during Dec 23 is estimated at USD 71.50 billion exhibiting negative growth of -7.18% over Dec-22.
Overall trade deficit during April-Dec improved by 35.87% from USD 108.13 Billion in 2022 to USD 69.34 Billion in 2023.
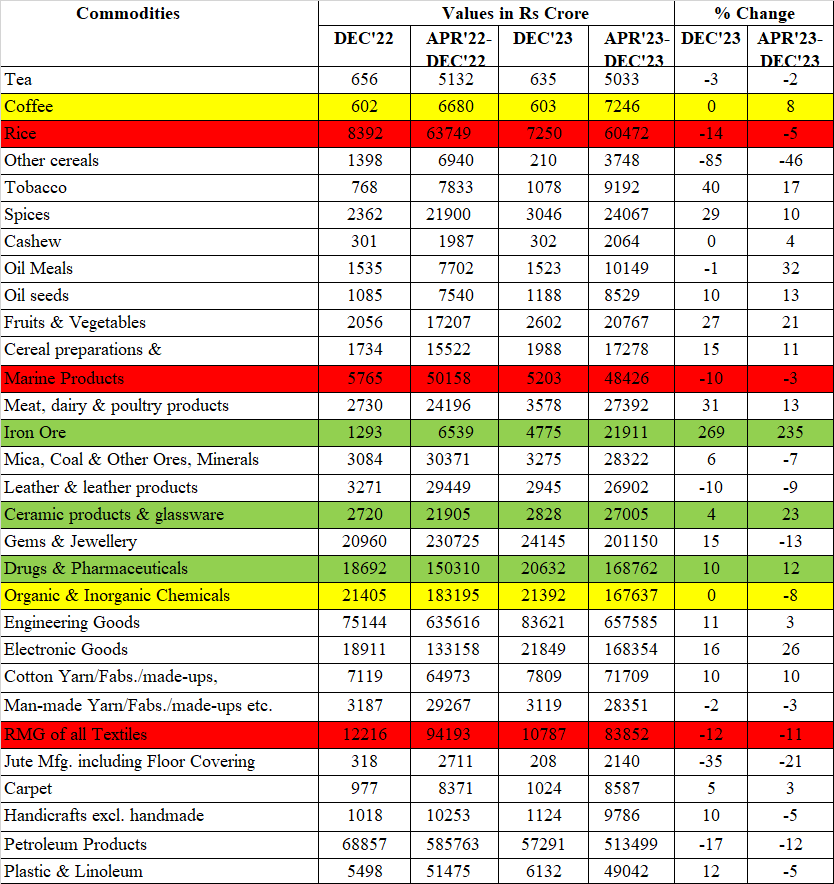
Coffee exports which were constantly growing became flattish during the December month.
Rice exports’ downtrend continues with negative growth of -14 % for the month.
Marine products exports remained negative.
Iron ore exports continue to grow more than 200%.
Ceramic products and glassware grow moderately.
Pharma exports grew 10% for December month and 12% so far in FY24.
Chemicals exports are flat compared to negative growth during previous months.
RMG of textiles remains negative.
@Mayur_Dvivedi below is the source for data.
12 Likes