
You are right. Thanks for highlighting it. I have posted the edited one.
1 Like
December 2021 update:
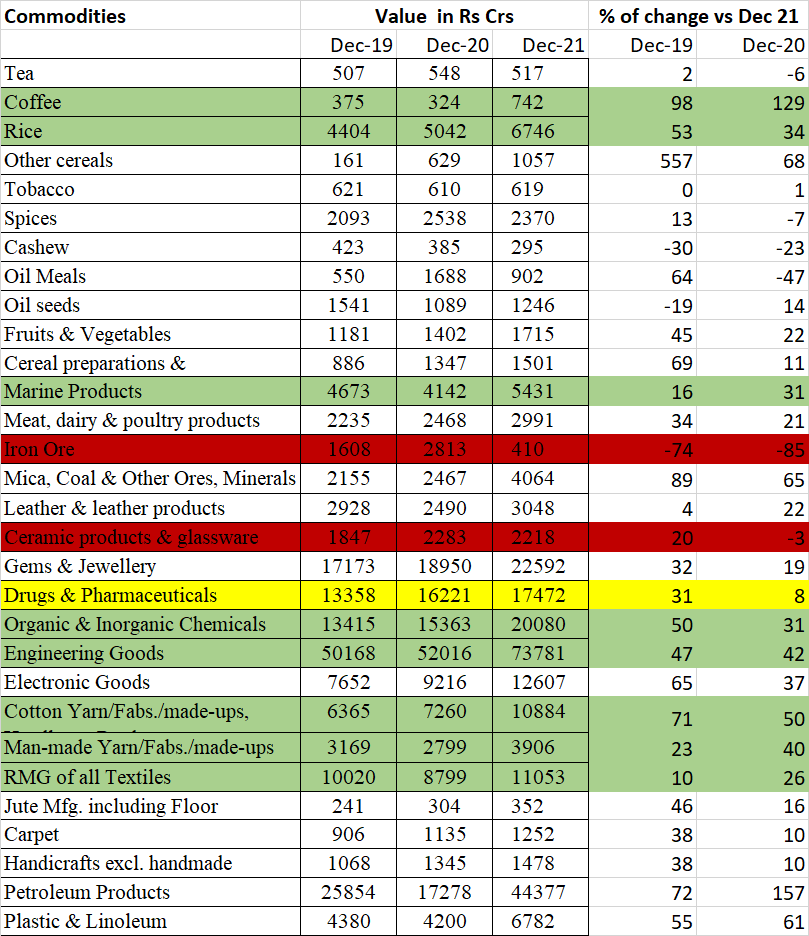
Merchandise exports during Dec-21 were Rs. USD 37.81 Billion compared to USD 27.22 Billion in Dec-20 registering a positive growth of 38.9% and positive growth of 39.4% compared to Dec-19.
India’s overall exports(merchandise and services combined) for Dec 21 estimated at USD 57.87 Billion exhibiting positive growth of 25% and 23% over Dec 20 and Dec19 respectively.
Coffee exports continue to remain high with growth of 129% yoy for Dec month.
Rice exports grew by 34 % compared to Dec 20.(second consecutive month of significant growth)
Marine product exports growth of 31% vs Dec 20 and 16% compared to Dec19.
Iron ore exports down by -85% yoy for December.
Ceramic products and glassware exports remain negative.
Pharma exports growth of 8% compared to Dec 20 ( high single digit growth after many months)
Chemicals exports were higher by 31% compared Dec 20.
Engineering goods exports by 42% and 47% compared to Dec 20 and Dec19 respectively.
Exports for Cotton yarn, man made yarn/fabric, RMG of textiles remains strong.
10 Likes
Jan 2022 update:
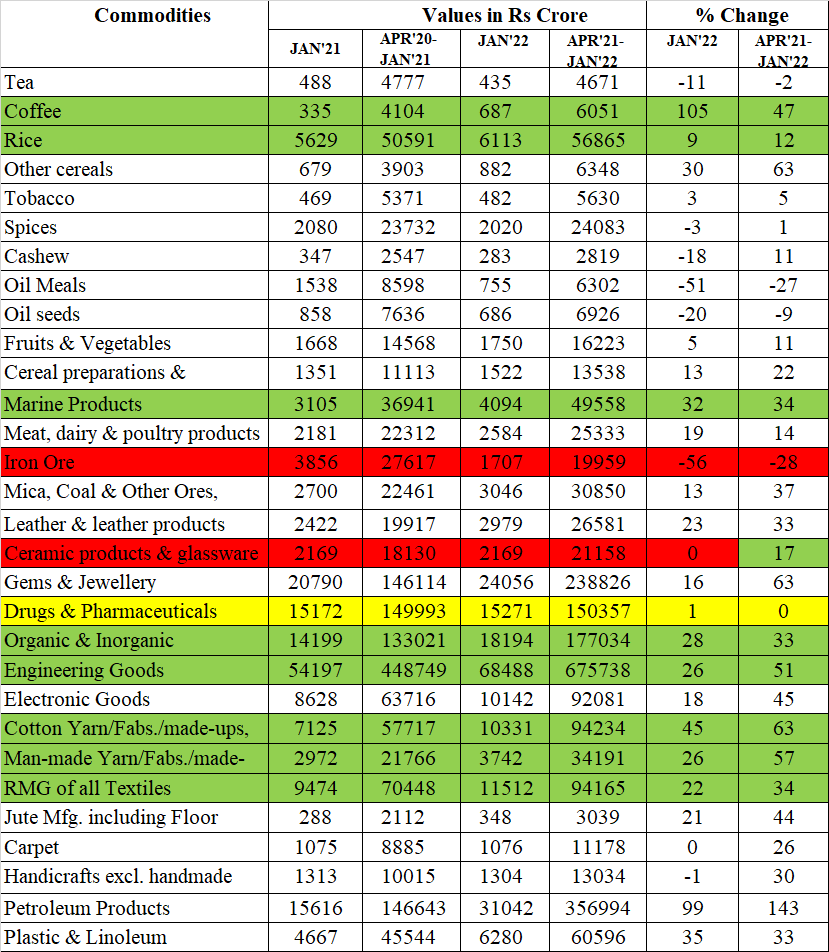
Merchandise exports during Jan-22 were USD 34.50 Billion compared to USD 27.54 Billion in Jan-21 registering a positive growth of 25.28%.
India’s overall exports(merchandise and services combined) for Jan-22 estimated at USD 61.41 Billion exhibiting positive growth of 37.76% over Jan-21.
Coffee exports remains strong with more than 100% growth for Jan month and 47% growth for the period April 21 to Jan 22
Rice exports grew by 9% yoy and 12% for 10MFY22.
Marine product exports showed positive growth of 32% vs Jan21 and 34% for 10MFY22.
Iron ore exports down by -56% for Jan,
Ceramic products and glassware exports remain flat for Jan month and positive growth of 17% for 10MFY22.
Pharma exports remained flat with growth of 1%.
Chemicals exports were higher by 28% and 33% for the month and 10mFY22.
Engineering goods exports increased by 26% for the month of Jan and 51% for the period April-Jan22.
Exports for Cotton yarn, man made yarn/fabric, RMG of textiles remains positive.
10 Likes
Feb 2022 update:
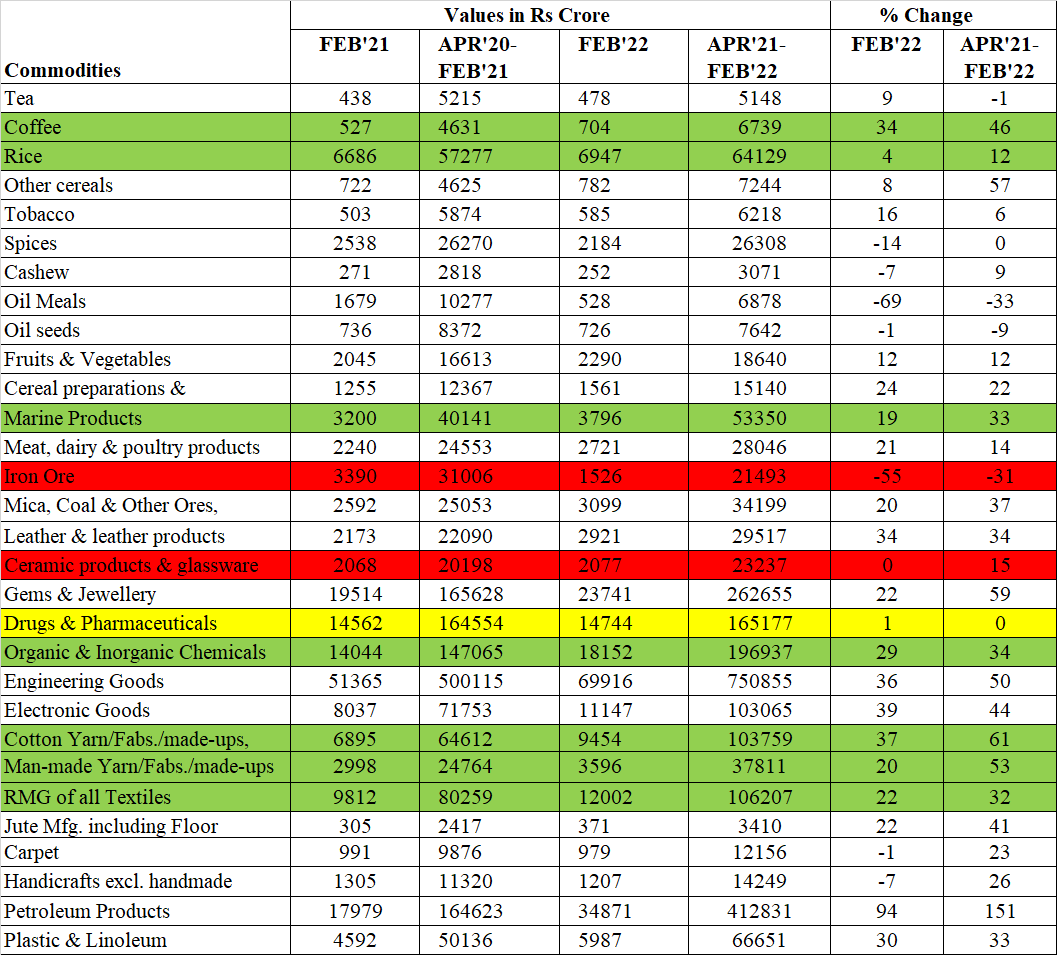
Merchandise exports during Feb-22 were Rs. USD 34.57 Billion compared to USD 27.63 Billion in Feb-21 registering a positive growth of 24.6%.
India’s overall exports(merchandise and services combined) for Feb-22 estimated at USD 57.03 Billion exhibiting positive growth of 25.4% over Feb-21.
Coffee exports continue to grow up by 34% for the month and 46% for period between April21 to Feb22.
Rice exports growth tapered to 4% for the month and 12% for 11MFY22.
Marine product exports showed positive growth of 19% vs Feb 21 and 33% for 11MFY22.
Iron ore exports remains negative down by -55% for Feb and -31% for period between April21-Feb22.
Ceramic products and glassware exports remain flat for last few months even though overall export for 11MFY22 remains positive at 15% growth.
Pharma exports remained flat with growth of 1%.
Chemicals exports were higher by 29% and 34% for the month and 11MFY22.
Exports of Cotton yarn, man made yarn/fabric, RMG of textiles remains positive with more than 20% growth.
Other sectors like engineering and electronic goods have been showing consistent positive growth.
5 Likes
March 2022 update:
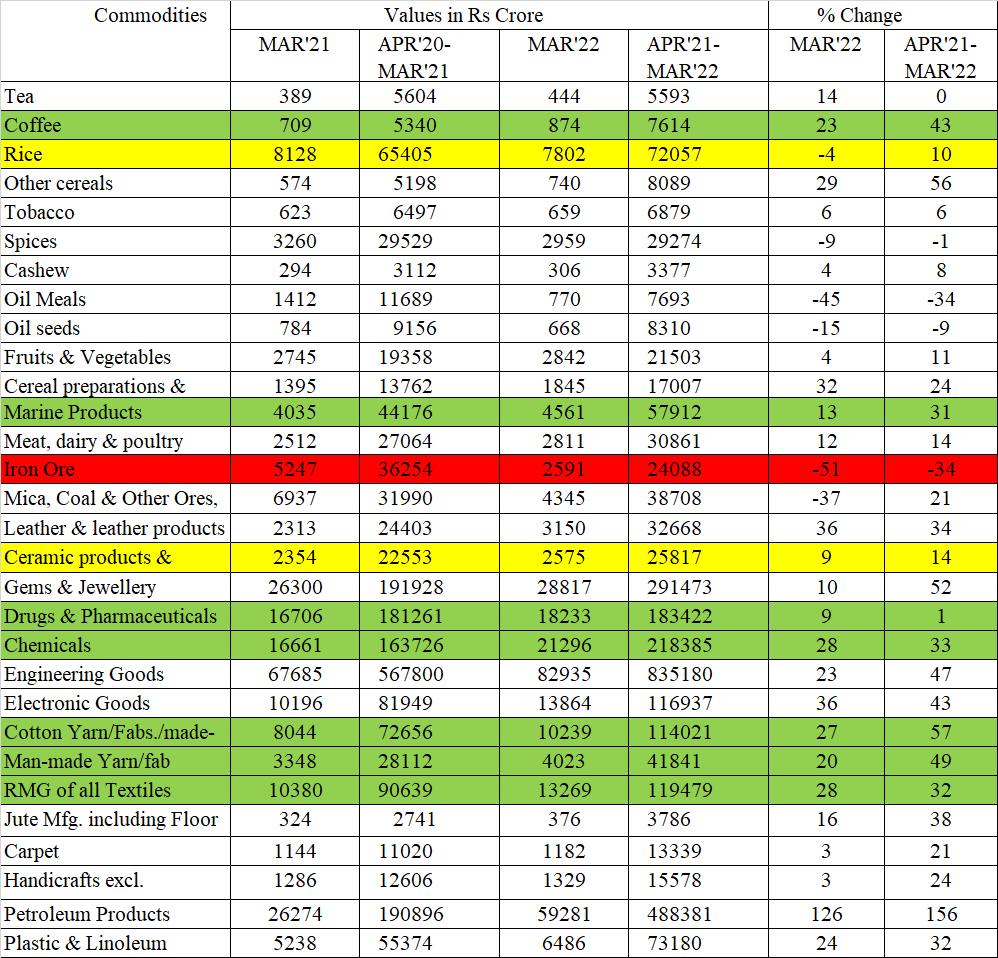
Merchandise exports during March-22 were Rs. USD 42.22 Billion compared to USD 35.26 Billion in March-21 registering a positive growth of 19.76%.
India’s overall exports(merchandise and services combined) for March-22 estimated at USD 64.75 Billion exhibiting positive growth of 15.51% over March-21.
Coffee exports continue to grow by 23% for the month and 43% for the FY22.
Rice exports negative growth of -4% the month (growth was tapered during Feb month).
Marine product exports showed positive growth of 13% vs March 21 and 31% for FY22.
Iron ore exports remained negative down by -51% for March and -34% for FY22.
Ceramic products and glassware exports turned positive(+9%) after 4 months of degrowth.
Pharma exports grew by 9% for March and flat(1%) for the FY.
Chemicals exports were higher by 28% and 33% for the month and FY22 respectively.
Exports of Cotton yarn, man made yarn/fabric, RMG of textiles continue to remain positive with good growth.
Other sectors like engineering goods and electronic goods have been showing consistent positive growth.
9 Likes
April 2022 update( value in Million USD):
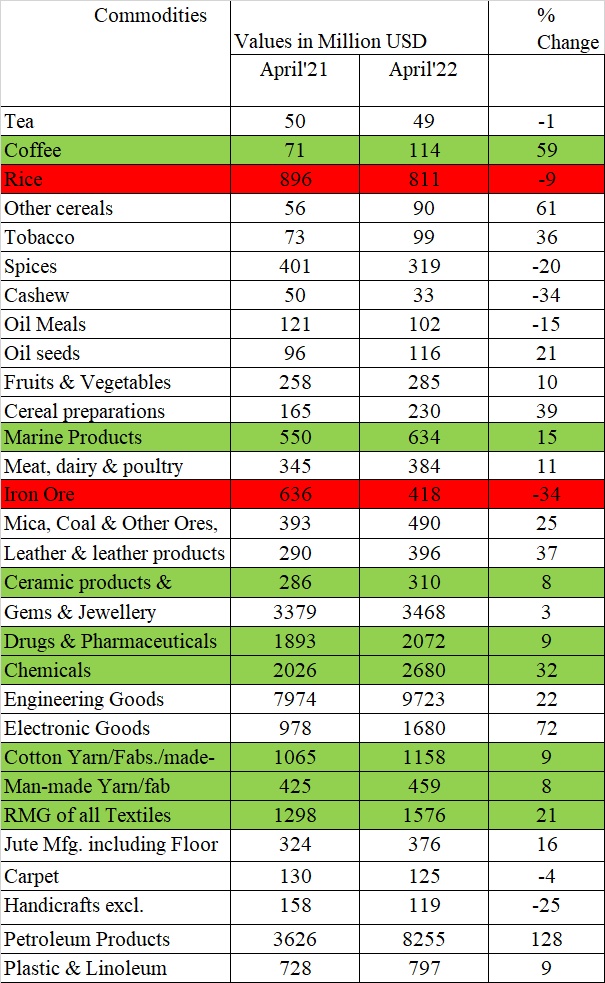
Merchandise exports during April-22 were Rs. USD 40.19 Billion compared to USD 30.75 Billion in April-21 registering a positive growth of 30.70%.
India’s overall exports(merchandise and services combined) for April-22 are estimated at USD 67.79 Billion exhibiting positive growth of 38.90% over April-21.
Coffee exports grew by 59% for the month of April.
Rice exports remained negative for the 2nd consecutive month(-9% during April).
Marine products exports showed positive growth of 15% vs April 21
Iron ore exports fell by -34% for April22 compared to April21.
Ceramic products and glassware exports remained positive for the 2nd month in a row.
Pharma exports grew by 9% for April22.
Chemicals exports were higher by 32% compared to April21.
Exports of Cotton yarn, man made yarn/fabric, RMG of textiles continue to remain positive.
8 Likes
May 2022 update(in Rs Crs):
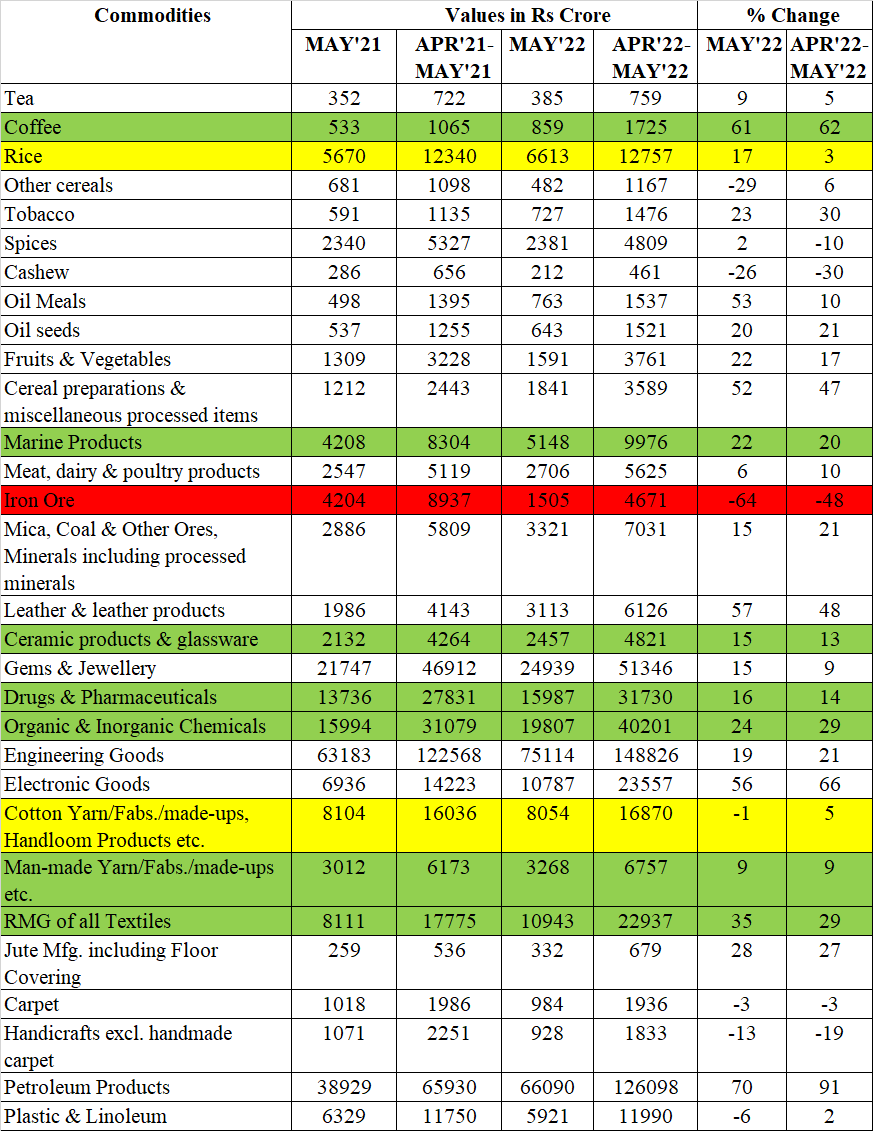
Merchandise exports during May-22 were USD 38.94 Billion compared to USD 32.30 Billion in May-21 registering a positive growth of 20.55%.
India’s overall exports(merchandise and services combined) for May-22 are estimated at USD 62.21 Billion exhibiting positive growth of 24.03% over May-21.
Coffee exports grew by 61% for May month.
Rice exports turned positive(+17%) after de-growth in the preceding two months.
Marine products exports continue to show consistent positive growth.
Iron ore exports remained negative, down by more than 60% for the month.
Ceramic products and glassware exports remained positive for the 3rd month in a row.
Pharma exports rose by 16% for the month and 14% for two months of FY23.
Chemicals exports higher by 24% compared to May21 and 29% for two months of FY23
Exports of electronic and engineering goods remain strong.
12 Likes
**JUNE 2022 UPDATE (values in Million USD)
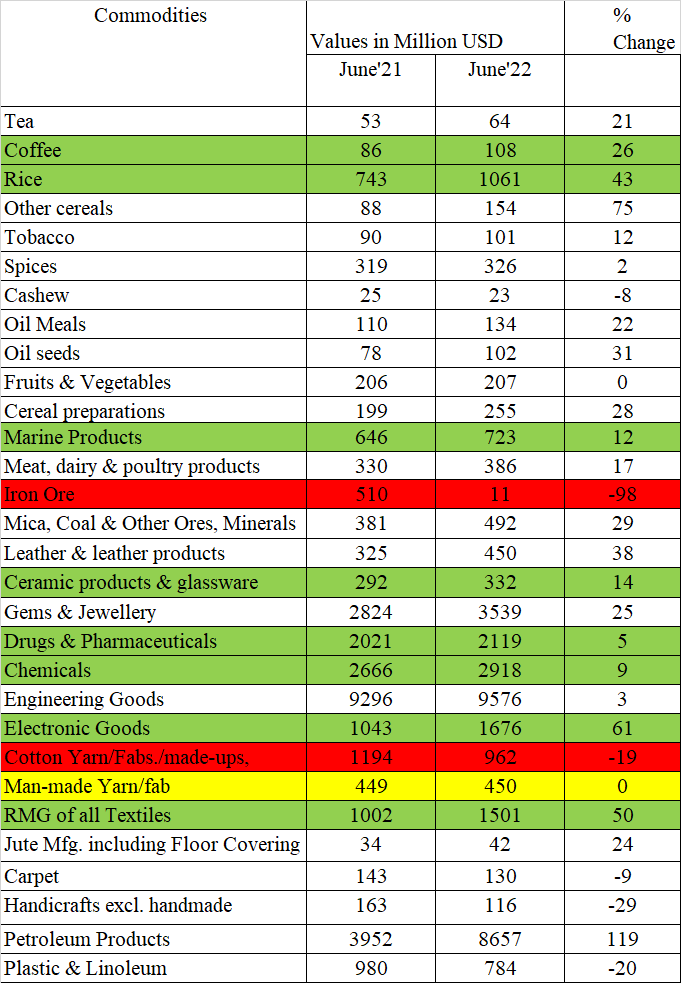
Merchandise exports for June-22 were USD 40.13 Billion compared to USD 32.49 Billion in June-21 registering a positive growth of 23.52%.
India’s overall exports(merchandise and services combined) in June-22 are estimated at USD 64.91 Billion exhibiting positive growth of 25.16% over June-21.
Coffee exports continue to remain strong with 26% growth during June.
Rice exports showed 43% growth, second consecutive month of positive growth.
Marine products exports continue to show consistent positive growth.
Iron ore exports had a degrowth of -98%.
Ceramic products and glassware exports remained positive for more than a quarter now.
Pharma exports had tepid growth of 5% for the month of June.
Chemicals exports increased by 9% compared to June 21.
RMG of textiles export rose by 50%.
10 Likes
Thank you, this data is quite interesting. Does “RMG of all textiles” include home textiles - bedspreads, terry towels, curtains etc.?
Where do you get this data from, btw?
2 Likes
Hi, above date is available from Press Information Bureau under ministry of commerce and industry.
Above site is quite useful as there will be regular official update on various government policies.
I am not sure if home textiles is covered under same as I am getting different HSN codes for under readymade garments.
Tracking the export data helps us to understand the broad trend of industry in general.
(sorry for the late reply)
3 Likes
July 22 update(values in Rs.Crs)
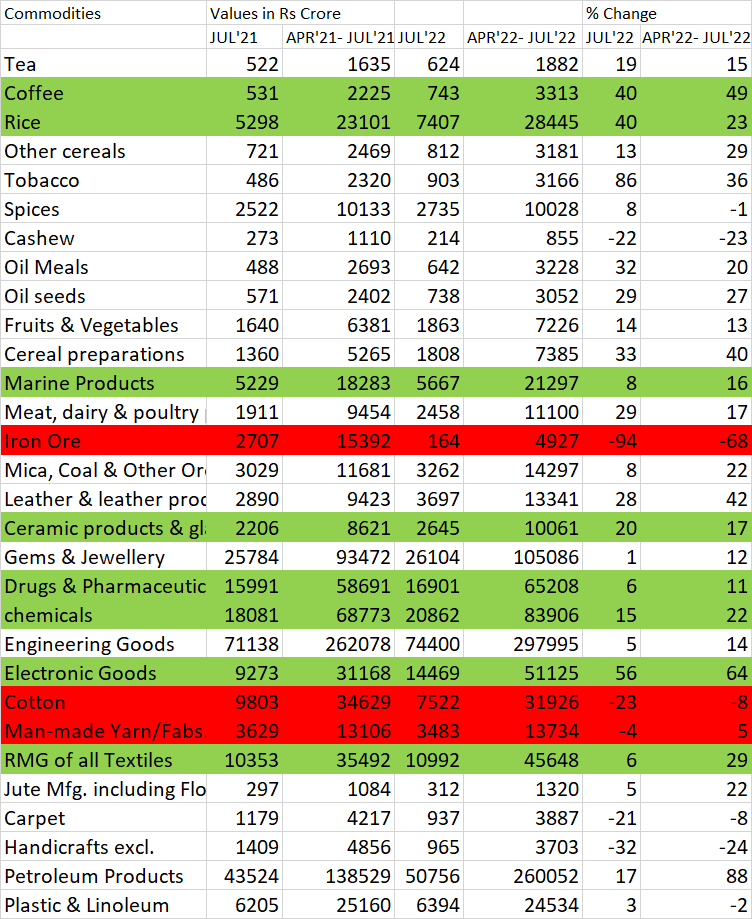
Merchandise exports in July-22 were USD 36.27 Billion compared to USD 35.51 Billion in July-21 registering a positive growth of 2.14%.
India’s overall exports(merchandise and services combined) in July-22 are estimated at USD 61.18 Billion exhibiting positive growth of 11.51% over July-22.
Coffee exports remain strong with growth of 40% for July 22 and 49% for the period of April to July-22
Rice exports continued positive growth( 3rd month in a row) up by 40% for July.
Marine products exports grew at 8% for the month and 16% for the period from April-July22.
Iron ore exports had a de-growth of -94%.
Ceramic products and glassware exports growth of 20% during July.
Pharma exports continue to remain in single digit(6%).
Chemicals exports increased by 15% compared to July 21and 22% for the period April-July22.
RMG of textiles grew by 6% for the month while other textile related segments like cotton, yarn remained negative.
6 Likes
Hi
Can you please share this export import excel sheet. I just want to analyse the historical data
August 2022 update:
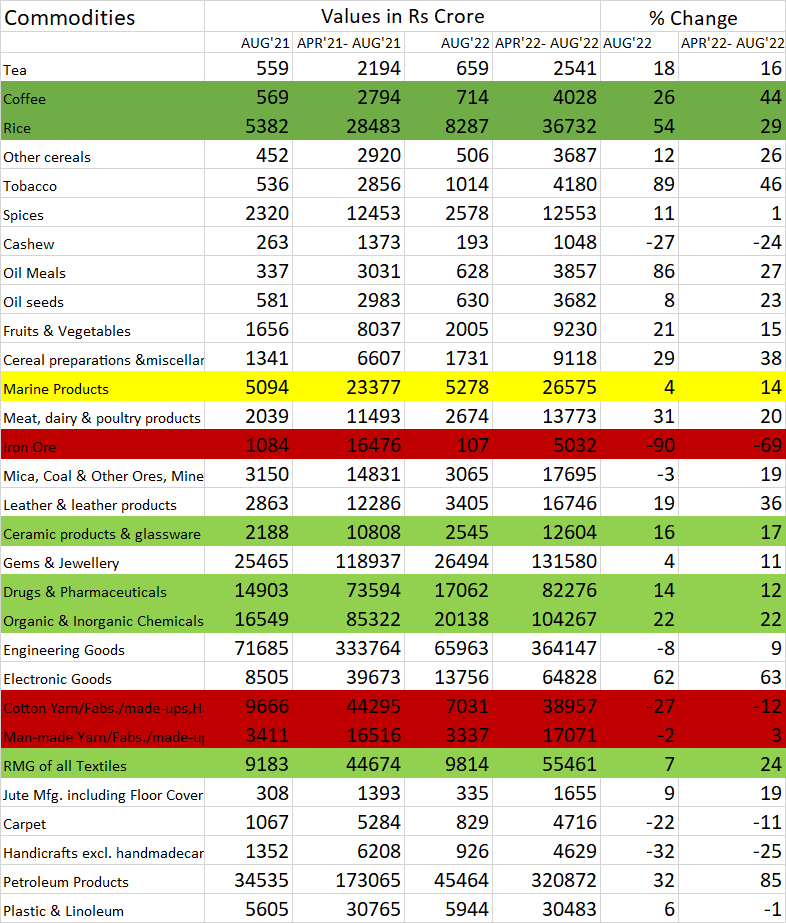
India’s overall exports(merchandise and services combined) in August-22 are estimated at USD 57.14 Billion exhibiting positive growth of 6.75% over August-22.
Coffee exports continue to grow at 26% for August and 44% for the period of April to August-22
Rice exports continued positive growth( 4th month in a row) up by 54% for August.
Marine products exports grew at 4% for the month (consecutive month of less than 10% growth)
Iron ore exports had a de-growth of -90%.
Ceramic products and glassware exports growth of 16% for the month and 17% for the period April to August-22.
Pharma export grew at 14% for the month( previous 2 months were <10% growth)
Chemicals exports increased by 22% for the month and April to August-22
RMG of textiles grew by 7% for the month while other textile related segments like cotton, yarn remained negative.
12 Likes
September 2022 update:
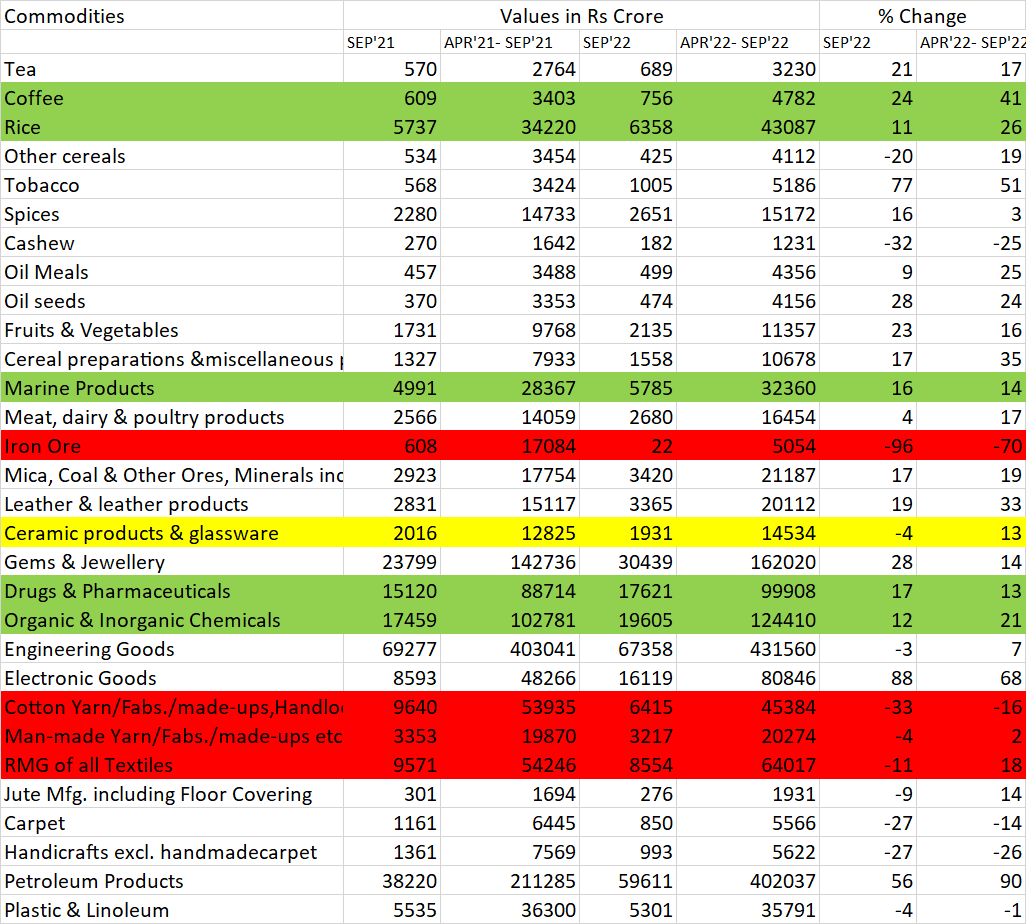
Merchandise exports in Sept-22 were USD 35.45 Billion compared to USD 33.81 Billion in Sept-21 registering a positive growth of 4.82%.
India’s overall exports(merchandise and services combined) in Sept-22 are estimated at USD 61.10 Billion exhibiting positive growth of 10.24% over Sept-21.
Coffee exports grow at 24% for September and 41% for the period of April to Sept-22
Rice exports continued positive growth( 5th month in a row) up by 11% for Sept-22 and 26% for 6months.
Marine products exports grew at 16% for the month.
Iron ore exports continue to decline -96% for sept -22 and down by -70% for 6 months of FY.
Ceramic products and glassware exports decline by -4% for the month.
Pharma exports grew at 16% for September month.
Chemicals exports increased by 12% for the month and 21% April to Sept-22
RMG of textiles, cotton, and yarn exports remained negative.
7 Likes
October 2022 update:
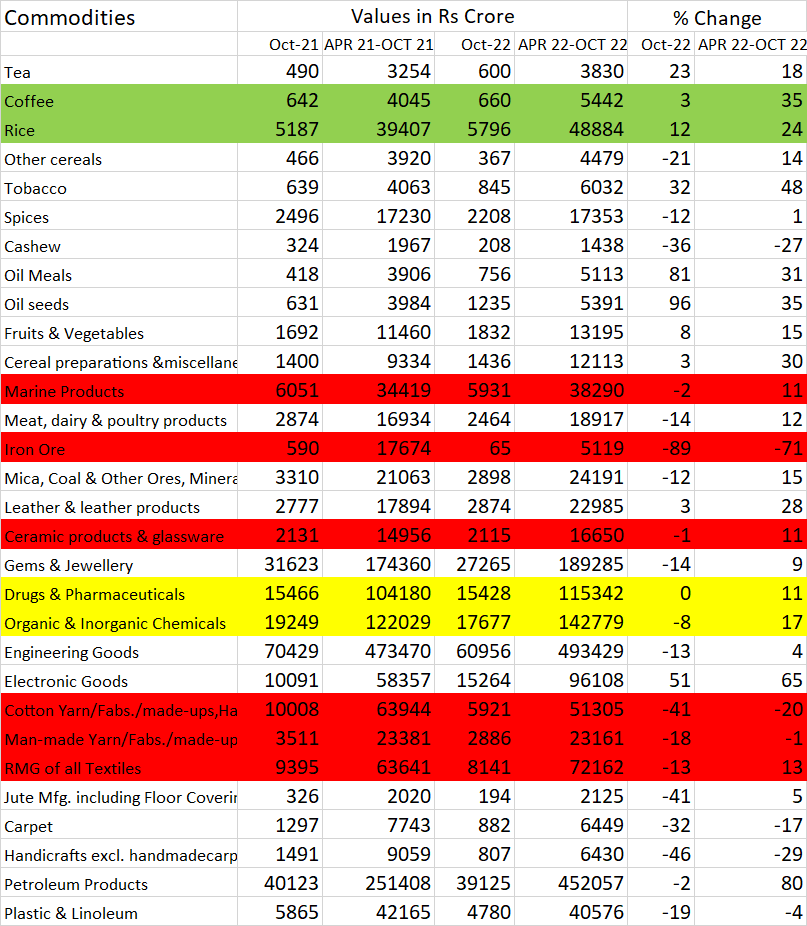
Merchandise exports in Oct-22 were USD 29.78 Billion compared to USD 35.73 Billion in Oct-21 degrowth of 5.95 Billion USD.
India’s overall exports(merchandise and services combined) in Oct-22 are estimated at USD 58.36 Billion exhibiting positive growth of 4.03% over Oct-21.
Coffee exports grow at 3% for October month and 35% for the period of April to Oct-22
Rice exports continued positive growth( 2 quarters of continuous growth) up by 12% for Oct-22.
Marine products exports de-grew by -2% for the month.
Iron ore exports continue to decline -89% for Oct-22 and -71% from April to Oct 22.
Ceramic products and glassware exports decline by -1% for the month.
Pharma exports remained flat for October month.
Chemicals exports reduced by -8% for the month.
RMG of textiles, cotton, and yarn exports remained negative.
7 Likes
November 2022 update:
(absolute numbers for commodities/sector is not released by Govt)
India’s overall exports(merchandise and services combined) in Nov-22 are estimated at USD 58.22 Billion exhibiting positive growth of 10.97% over Nov-21.
Merchandise exports in Nov-22 were USD 31.99 Billion compared to USD 31.80 Billion in Nov-21.
Overall imports in Nov-22 is estimated at USD 69.33 Billon,exhibiting a positive growth of 5.60% over the same period of last year.
Merchandise exports exhibited a positive growth in 15 out of 30 sectors in November compared to Nov-21 and imports have increased in 19 out of 30 sectors for the same period.
Commodities with positive growth and % for the month of Nov-22:
Electronic good: 54.48%
Gems and jewellery: 4.61%
RMG of textiles: 11.70%
Drugs and pharmaceuticals: 8.66%
Rice: 19.16%
Leather and leather products: 8.68%
Ceramic products and glassware: 22.64%
Fruits and vegetables: 25.01%
Cereal preparations & miscellaneous processed: 22.75%
Other cereals: 53.78%
Oil seeds:33.83%
Oil meals:17.55%
Tobacco: 101.02%
Tea: 27.03%
Coffee: 3.21%
More details on export/import can be found in below link:
https://pib.gov.in/PressReleseDetail.aspx?PRID=1883953
9 Likes
December 2022 update:
India’s overall exports(merchandise and services combined) in Dec-22 are estimated at USD 61.82 Billion exhibiting negative growth of -5.26% over Dec-21.
Merchandise exports in Dec-22 were USD 34.48 Billion compared to USD 39.27 Billion in Dec 21.
Overall imports in Dec-22 is estimated at USD 73.80 Billon, exhibiting a negative growth of -1.95%% over the same period of last year.
Merchandise exports exhibited a positive growth in 11 out of 30 sectors in Dec-22 compared to Dec-21 and imports have increased in 17 out of 30 sectors for the same period.
Commodities with positive growth and % for the month of Dec-22:
Iron ore : 185.76%( after many quarters iron ore exports have shown positive growth)
Oil meals: 53%
Electronic good: 36.96%
Other cereals: 16.87%
Tea :15.97%
Rice : 13.3%
Tobacco :13.7%
Ceramic products & glassware:11.67%
Fruits and vegetables:8.03%
Cereal preparation and miscellaneous:4.9%
RMG of textiles:1.02%
7 Likes
January 2023 update:
India’s overall exports(merchandise and services combined) in Jan 2023 are estimated at USD 65.15 Billion exhibiting positive growth of 14.58% over Jan-2022.
Merchandise exports in Jan-23 were USD 32.91 Billion compared to USD 52.57 Billion in Jan-22.
Overall imports in Jan-23 is estimated at USD 66.42 Billon, exhibiting a positive growth of 0.94% over the same period of last year.
Under merchandise exports, 14 out of 30 sectors exhibited positive growth in Jan -23 as compared to Jan-22.
Commodities with positive growth and % for the month of Jan-23:
Electronic goods:55.54%
Oil meals:48.89%
Oil seeds: 23.81%
Iron ore: 21%
Rice : 18.8%
Fruits and vegetables: 14.57%
Cashew: 10.34%
Tobacco: 9.41%
Ceramic products & glassware:8.25%
Petroleum products: 8.01%
Marine products: 6.61%
Other cereals: 3.92%
Spices: 3.79%
Tea: 3.76%
15 Likes
It is perhaps worth mentioning the scale of this. This is rs 2,70,000 cr of merchandise exports
Here we can see jan-20 exports at 1,84,000 cr. This is a cagr growth of 13.6% and includes 2 years of covid in between. This is nothing short of remarkable. Merchandise Exports will really start to contribute to GDP in 5-10 years of it can keep growing at 14% cagr.
5 Likes