Export data and learnings

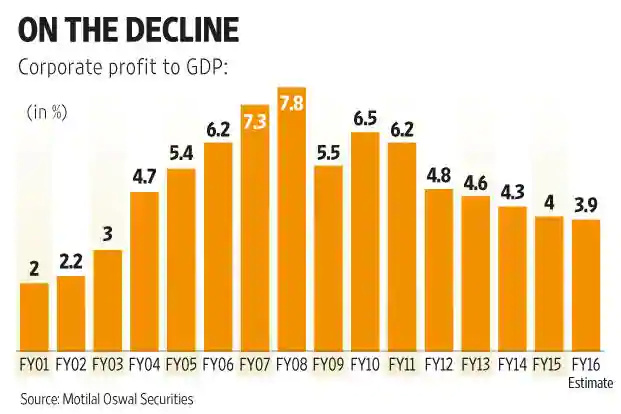
Exports play an important role in the country’s economic growth and India is no exception. If we look back at the data exports as a contribution to country GDP has grown rapidly during the period 2002-03 to 2008-09.

Those were the best years for Indian stock market to lead by exponential earnings growth for Indian companies. In general exports revenue has better margins also. From 2009-10 exports as % of GDP was almost plateaued and in declining trend. Subsequently even the corporate profit as a percentage of GDP has reduced.
image

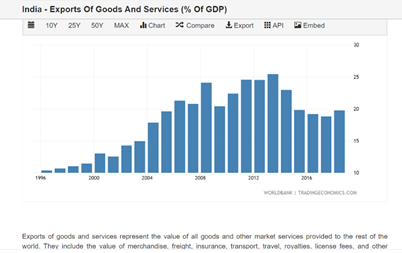
Drop in corporate profit to GDP from 2008-09 onwards.
image

During the last few years Indian chemical industry is getting benefited as global companies are shifting their sourcing from China mainly due to environmental issues. Ongoing Covid crisis and visible sentiment against China may further accelerate the shift in global outsourcing to other industries as well.
During the latest con-calls many companies across the sectors gave an optimistic view on export opportunities from Europe/US clients as they want to avoid China as a single source.

Other changes happened during the last few quarters as GOI reduced the corporate tax and offered various incentives for companies to set up manufacturing factories in India to become alternative source for global outsourcing.

Does the export pick up really happen on ground or not is to be backed up by data. Govt of India releases export import data of major commodities on 15th of every month (service sector data for previous month) along with macro view on total import, export, trade balance which is a reliable and practical way to track.

Using export import data we can substantiate some of the changes investors think as fundamental change happening in particular sectors/companies and build our conviction in what we track/invest. Exports have become more important in the present scenario of domestic slowdown due to Covid.
Also possible is first look at the data and if there is significant change (either positive or negative) in the trend of a particular sector, we can follow it up further to assess what has changed fundamentally, so that investment decision becomes easier.

Whole Idea is to identify the trend on what we think is changing fundamentally and substantiate it by nos. (Not to focus too much on macro data but to get limited and information for the investment purpose)

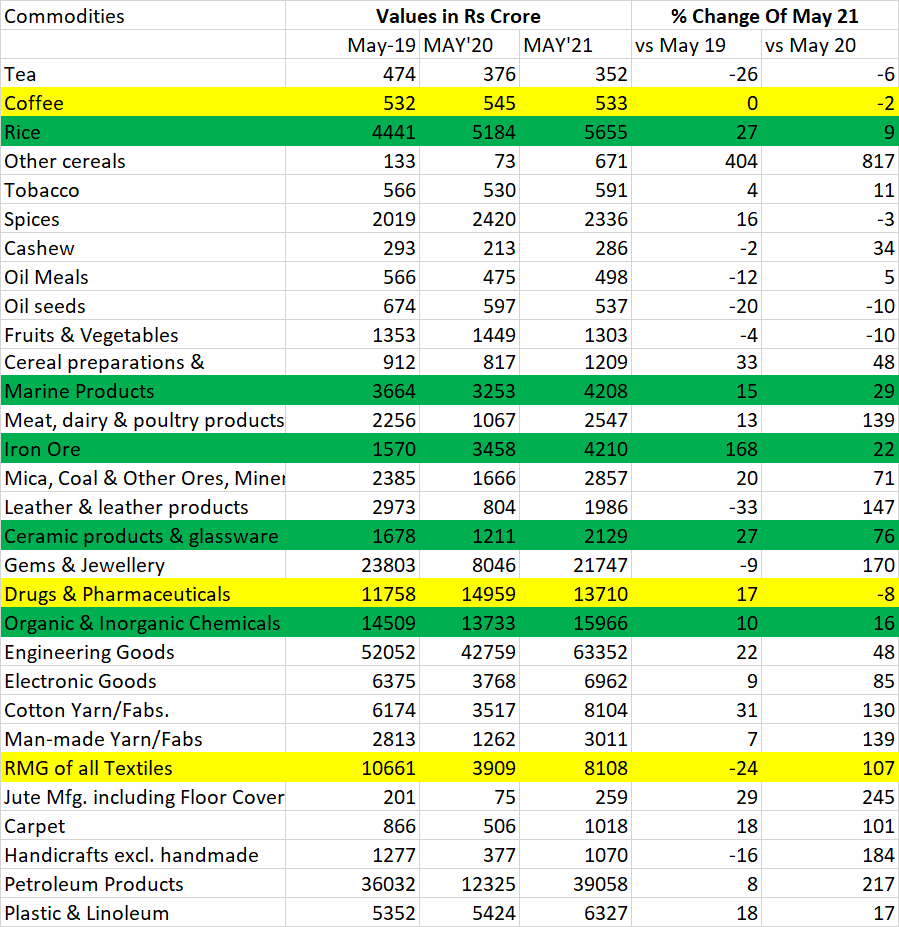
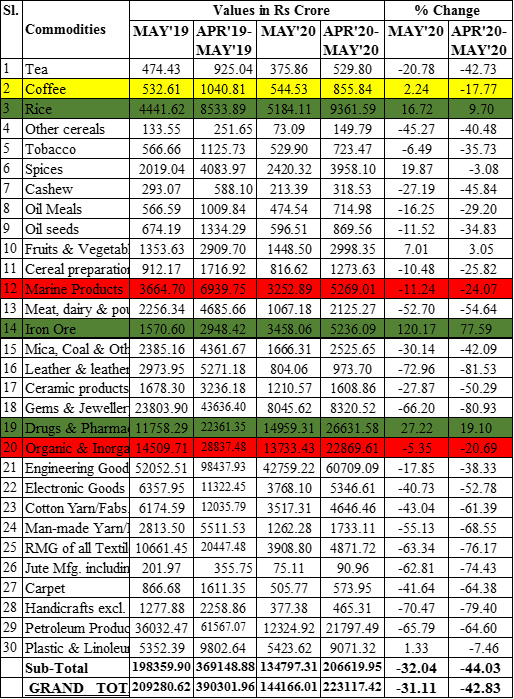
May 2020 export data:

Link for the details:
(http://164.100.117.97/WriteReadData/userfiles/Quick%20Estimates%20May%202020.pdf)

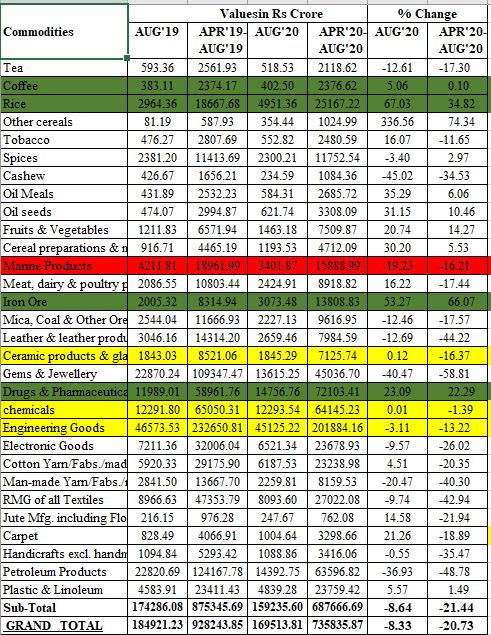
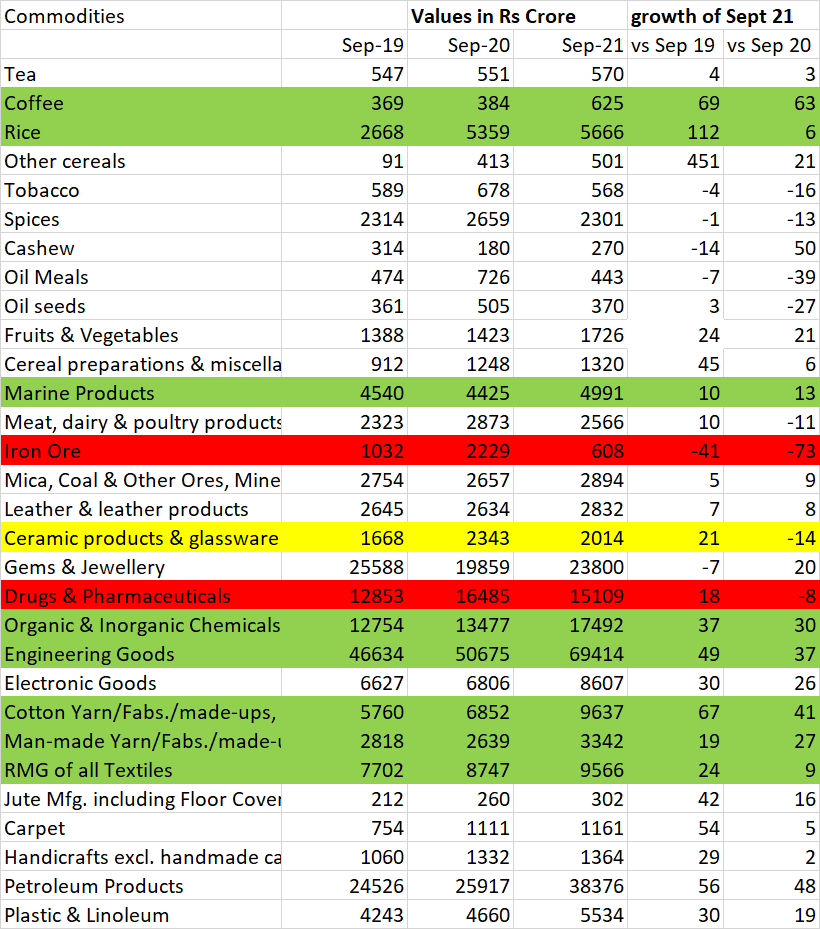
As expected most commodities have shown significant degrowth during the month of May-20 compared to May -19.

Coffee exports have shown slight uptick of 2% MoM but down by -17% for corresponding months of FY (April to May) ( related CCL products which gets majority of revenue from exports, may be even for Tata coffee ltd?)

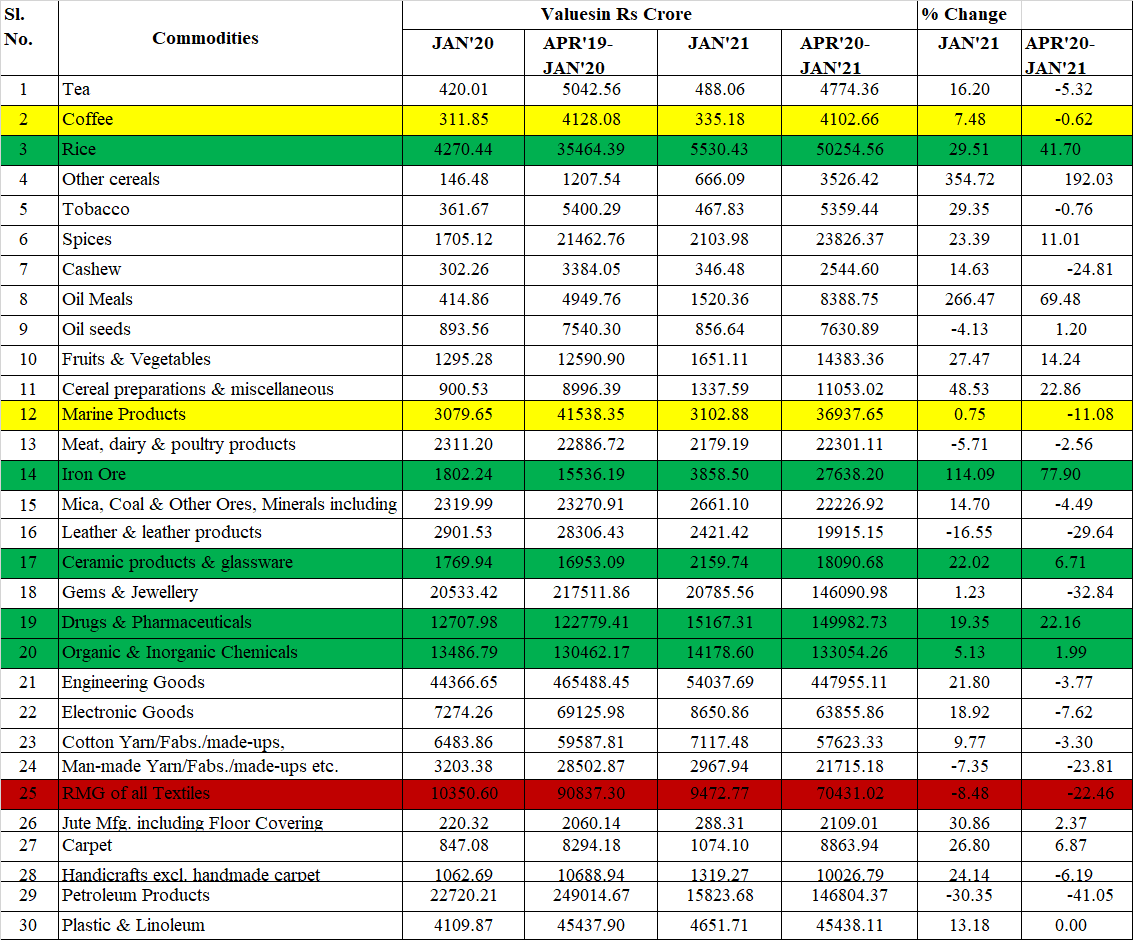
Rice exports have positive growth of 16% MoM and 9% for the corresponding months (April to May) of FY ( important data for KRBL, LT foods and Chamanlal exports)

Drugs and pharmaceuticals have registered growth of +27% MoM and +19% for corresponding months of FY (April to May) as anticipated.

Surprisingly Iron ore exports have shown a big jump of more than 100% MoM and +77% for FY.( Need to check what is changing here and which companies to benefit)

Chemicals exports degrown by -5% MoM and -20% for the year.

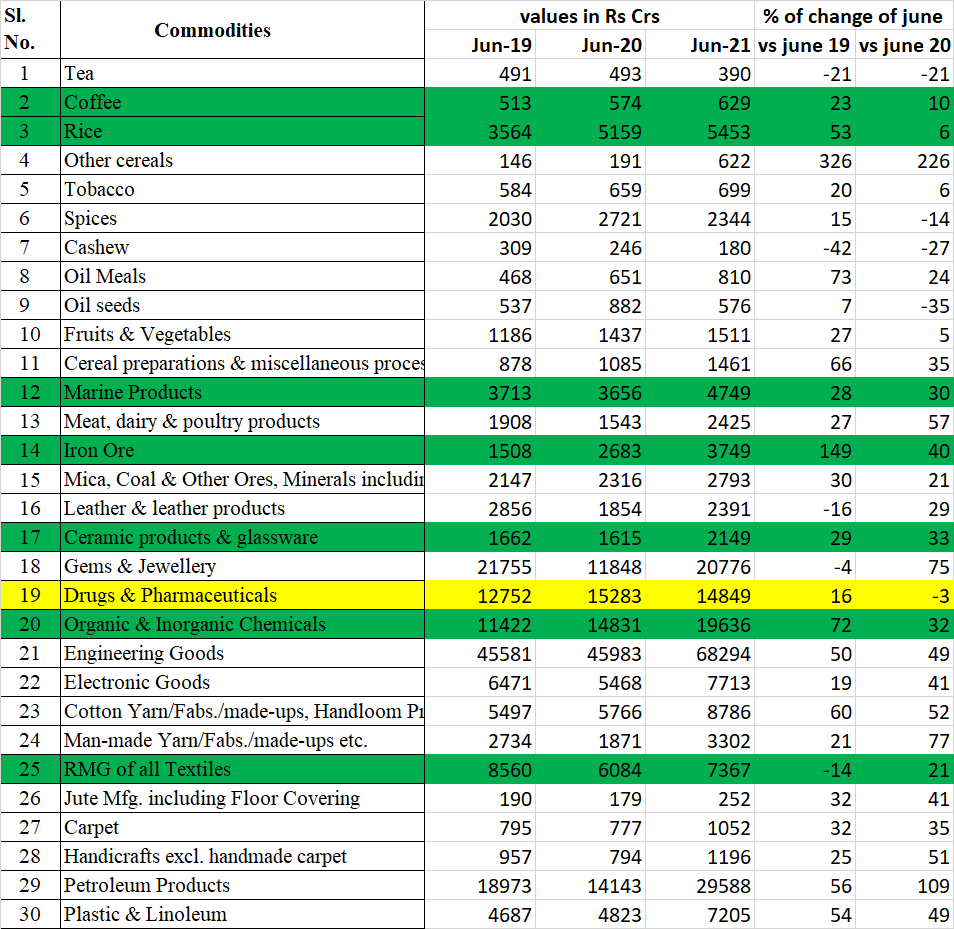
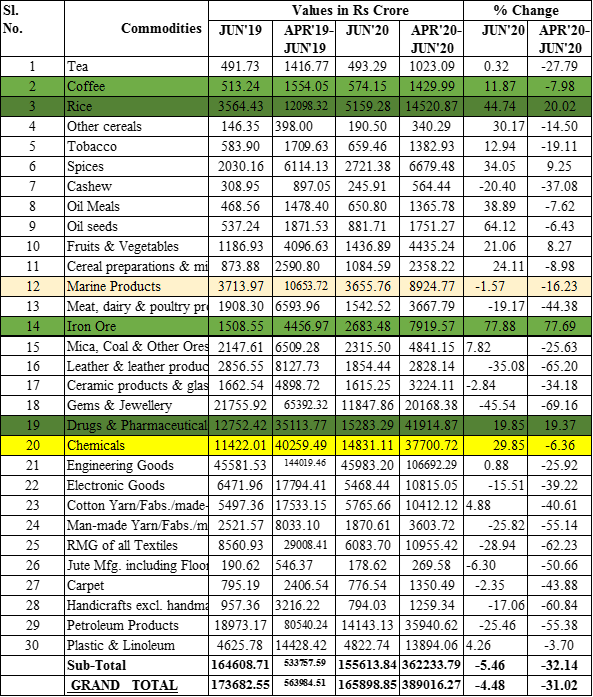
June 2020 export data:

link for June 2020:

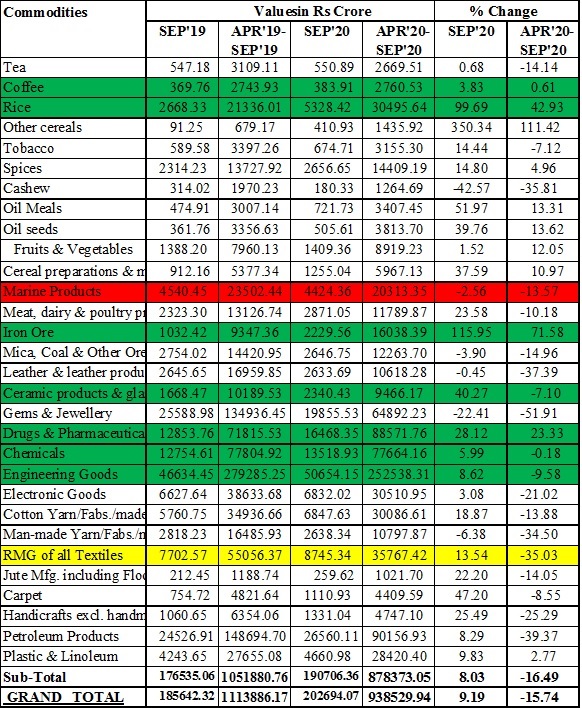
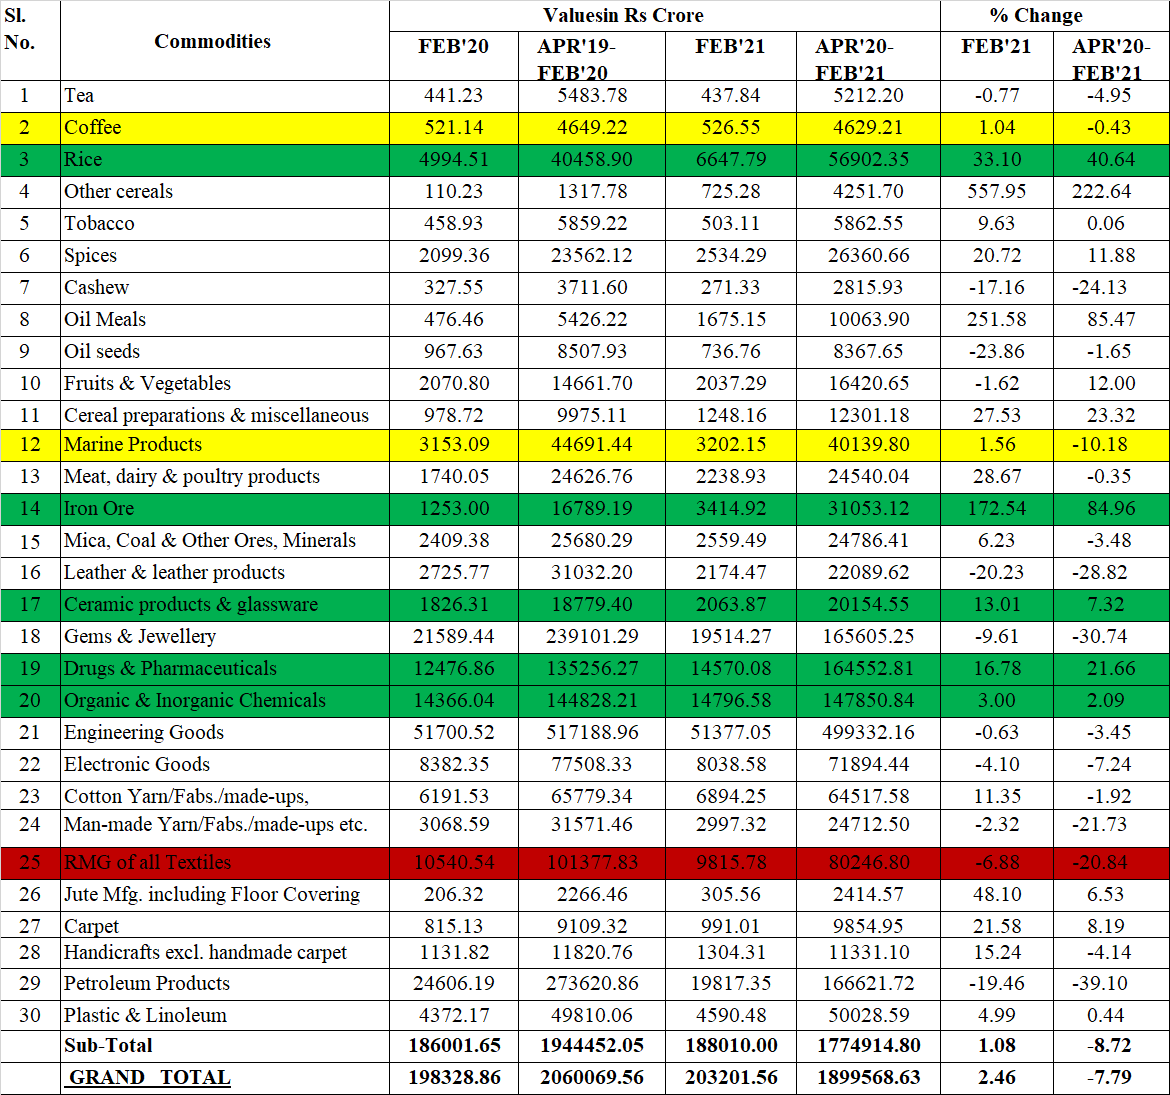
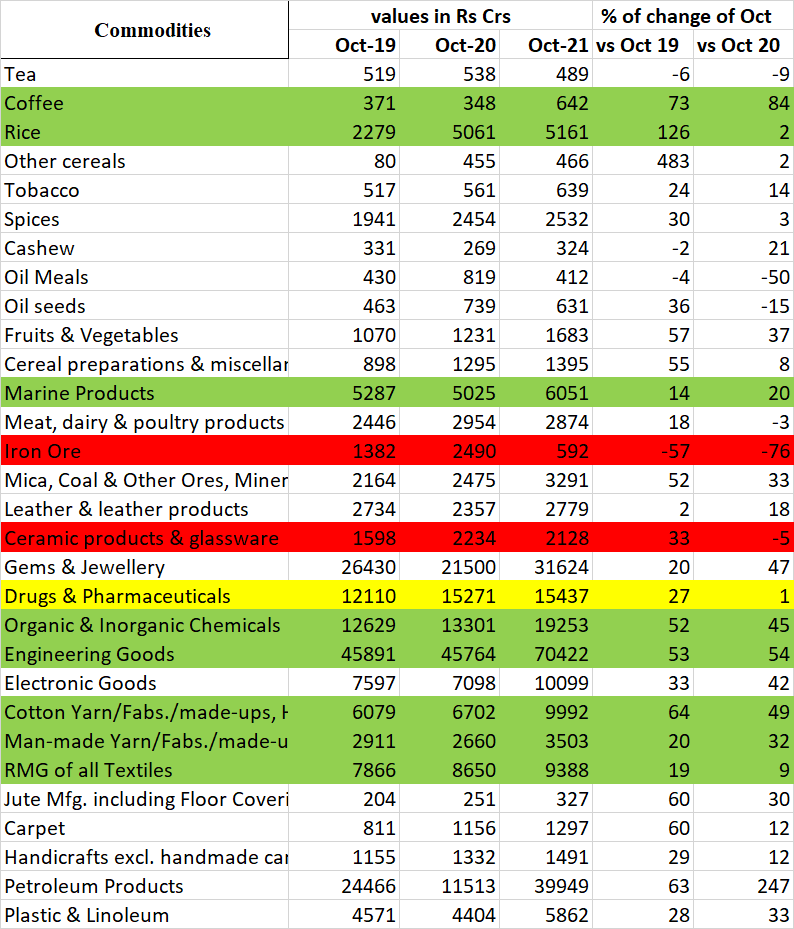
Coffee exports have strengthened further during the month of June (+11%) MoM (Down by -7% for 3 months of FY)

Rice exports also increased further with growth of +44% for MoM and increased by 20% for FY till June.

Pharma export continues good run with growth of 19% for MoM and till June of Fy20.

Iron ore exports have grown by 77% for the MoM and for FY (someone tracking the sector may share more insights on this. Godawari ispat and power ltd does iron ore exports as mentioned by vp member during offline discussion)

Export of chemicals are back in action after degrowth during the previous month. Impressive 30% growth for the month (down by -6% for Fy)

Many commodities like tobacco, spices, Oil seeds, cereals, fruits have grown positively compared to degrowth of the previous month.

Marine products exports still remain negative but better compared to May.(Helps in tracking Avanti feed,Apex frozen foods)

Overall trade balance was turned positive for the first time for India during the last decade.
Both import and export in absolute terms remains low.

Few points:
Data link of commodities exports for April-20 is not available.
There may be pent up in some of the exports like pharma during the month of May due to lockdown during the previous month.
Data will be more curated and presented as we learn further
Revenue is presented in Rs Crore. Follow the above links for further detail in dollar terms and import data also.
Going ahead we will try to get more insights on import statistics also which help in noticing certain changes in particular industries. (Eg: Coffee industry imports and it will be exported after processing)
More granular data will be available based on HSN code of particular material which is published by GOI with delay of 1-2 months.

Discl: Invested in KRBL,Apex frozen foods,recently exited Avanti, invested in few pharma and chemical comapanies

28 Likes

JULY 2020 UPDATE( in Rs crore):


Coffee exports continued to grow further showing impressive growth of 24% for July MoM (flat growth till July month of current FY). coffee prices were lowest in 2019 in the last ten years and seems to be recovering slowly.

Rice exports grew substantailly +61%% for MoM and increased by 29% for FY till July.

Marine product exports still remain negative(-13%).

Iron ore exports continue to grow impressively +52% for the MoM and 70% FY (present Iron ore prices are at highest price for last one year(Iron Ore - 2022 Data - 2007-2021 Historical - 2023 Forecast - Price - Quote - Chart) and China seems to be importing iron ore significantly. Godawari power ispat limited management interview was interesting https://www.youtube.com/watch?v=YgB7kA-3Au4

Pharma exports are one of the best with growth of 30% for MoM and 22% till July of Fy20.

Chemicals exports showed moderate growth of 9% growth MoM (down by -2% for Fy)

Engineering goods have grown 18% after de-growth in the last two months.

overall exports for July 2020 were Rs.1,77,305 crores compared to Rs.1,81,190 crores of july 2019 registering negative growth of -2% ( down by -10% in Dollar terms)
July 2020 imports are Rs.2,73,579 Cr down by -21% compared to Rs. 2,73,579 Cr for July2019.
Link for July 2020 data
Quick Estimates July 2020 exports.pdf (276.4 KB)

Discl: recently invested with GPIL as opportunistic bet.

13 Likes

August 2020 update:


Coffee exports for the month of August showed moderate growth of 5% MoM

Rice exports continue to grow substantailly +67%% for MoM and increased by 35% for FY till August.

Marine product exports still remain negative(-19%).

Iron ore exports up by 53% MoM and 66% FY (present Iron ore prices remains strong lead by good demand from China)

Pharma exports increased by 23% MoM and 22% till August Fy20.

Chemicals exports are flat for August MoM.

Engineering goods export de-grew by -3% for August

Agriculture products like cereals, fruits,vegetables,oil seeds…etc continue to have good export growth from the last few months.

Overall export registered negative growth of -8%( In Rs terms) for the month of August -20 compared to Aug-19.

Quick Estimates August 2020.pdf (276.4 KB)

13 Likes

Early data on agri commodities export for the period of April-Sept 2020:
(Complete details of exports for the September month is yet to announced)
Essential agri commodities for April-sept 2020 has increased by 43%.
Major commodities showing positive export growth in Q2:
Groundnut: +35%
Refined sugar:+104%
Wheat :+206%
Basmati rice: +13%
Non basmati rice:+105%
Trade balance for Q2 is positive at Rs.9002 cr vs deficit of Rs.2133Cr during Q2FY19
(Relatively lesser export growth in basmati rice is probably due to payment issue with Iran)

https://www.pib.gov.in/PressReleasePage.aspx?PRID=1663362

4 Likes

Export data update for September 2020 update ( In Rs.Crs)


It was broad based recovery in commodities export during Sept-20.
Total export during sept-20 were Rs. 2,02,694Cr, higher by 9% compared to sept-19 (6% in $ terms)

Coffee exports continue to grow at a low pace of 3.8% MoM and almost flat for the 6M of FY.

Rice exports are increased by whooping 99%% for MoM and increased by 42% for FY Sept 20

Marine product exports remain negative (-2.5%).but much better compared to August month.

Iron ore exports: superb with growth of 115% MoM and 71% for 6M of FY20.

Pharma exports increased by 28% MoM and 23% till Sept of Fy20.

Chemicals exports better than the previous month and grew at 6% for MoM and flat for H1FY20.
Eng goods, ceramic products have shown positive growth.

Most agricultural products like cereals, fruits, vegetables, oil seeds…etc continue to have good export growth starting from June month.

Finally it seems to turn around in the textile sector with RMG of textiles, cotton yarn…etc started showing positive growth.

september 2020.pdf (74.9 KB)

7 Likes

Export data for Oct 2020 update (In Rs.Crs)

Total export during Oct-20 were Rs.1,82,845 Cr, compared to Oct-19 Rs1,86,358 Cr exhibiting negative growth of -1.8%.

Coffee exports started declining(-6%) after low growth in the previous month.

Rice exports remains strong,growth of 120% MoM and increased by 50% for till Oct20.

Marine product exports remain negative (-5%%)MoM and -12% for period April-Oct 20

Iron ore exports trend remains strong, up by 80% MoM and 72% till April-Oct 20.

Pharma exports increased by 26% MoM and 24% till Oct of Fy20.

Chemicals exports grew at 6% for MoM and flat for period April- Oct 20

Agricultural commodities products cereals, fruits, vegetables, oil seeds ,oil meals…etc continue to have good export growth starting from June month.

Textile sector export with RMG of textiles, cotton yarn showing second consecutive month of positive growth.

Quick Estimates October 2020.pdf (75.5 KB)

8 Likes

November 2020 update:

Total exports during Nov-20 were Rs.1,74,559 Cr,compared to Nov-19 Rs1,84,142 Cr exhibiting negative growth of -5.2%.(-8.7% in USD terms)

Coffee exports marginal growth of (2.5%) compared to negative growth in previous month and remains flat for the year till Nov202

Rice exports remain strong, growth of 30% MoM and increased by 48% for FY till Nov 20.

Marine product exports continue to de-grew (-12.8%) MoM and the trend remains the same for the last few months.

Iron ore exports up by 74% MoM and 73% till April-Nov20.( Iron ore prices at multi year high last seen in 2013 Iron Ore - 2022 Data - 2007-2021 Historical - 2023 Forecast - Price - Quote - Chart)

Ceramic products exports are increasing from the last 2 months.

Pharma exports remain positive with growth of 15% MoM and 22% till Nov20. (some moderation in growth compared to last few months growth of more than 20-25%)

Chemicals exports de-grew by -4% for MoM and flat for period April- Nov 20

Agricultural commodities products cereals, fruits, vegetables, oil meals…etc continue to have good export growth.

RMG of textiles has shown some moderation in growth (2.6%) for Nov month.

Quick Estimates November 2020.pdf (276.7 KB)

7 Likes

December 2020 update(In Rs terms).

Total exports during Dec-20 were Rs.1,99,770 Cr, compared to Dec-19 Rs1,92,984 Cr registering a positive growth of 3.52%.

Coffee exports degrown by -13.5% compared Dec-19 month and -2% for period April-Dec-20.

Rice exports at growth of 14.5% for Dec month and by 43% for period April-Dec 20.( some moderation in growth after growing at more than 50% during last few months).

Marine product exports continue to de-grew (-12.8%) and the trend remains the same for the last few months.

Iron ore exports up by 74.9% for Dec and 73% for period April-Dec20.

Ceramic products exports are grown at 23% for Dec and last 3 months of positive growth.

Pharma exports showed good growth of 21% for Dec-20 and 22% for April-Dec20.
Chemicals exports back to growth by registering +14% for Dec and flat for period April- Dec 20

Agricultural commodities products cereals, fruits, vegetables, oil seeds ,oil meals…etc continue to have good export growth.
RMG of textiles have turned negative(-12%) for Dec after showing positive growth in the previous 3 months.

8 Likes

Janaury-21 update ( In Rs terms)

Exports during Jan-21 were Rs.2,00,661 Cr, compared to Rs1,84,369 Cr of Jan-20 registering a positive growth of 8.8%.

Coffee exports grew by 7%( previous 3 months of negative/flat growth) compared to Jan-20 month and -5% for the period April to Jan-21.

Rice exports at growth of 29.5% for the Jan-21 month and up by 41.7% for the period April-Jan21.

Marine product exports remain flat compared to de-growth during the last few months.

Iron ore exports increased by 114% during Jan-21 and 78% for the period April-Jan-21.

Ceramic products and glassware continue to grow at 22% for Jan-21(4 months of consecutive positive growth)

Pharma exports at 19% growth for the month and 22% for April-Jan -21.

Chemicals exports at moderate growth of 5% for Jan and 2% for the period April- Jan-21.

Agricultural commodities products cereals, fruits, vegetables, oil meals…etc continue to have good export growth.
RMG of textiles exports down by-8% for Jan 21.

7 Likes

February 2021 merchandise export date update(In Rs Cr terms)

Exports during Feb-21 were Rs.2,03,201 Cr, compared to Rs.1,98,328 Cr of Feb-20 registering a positive growth of 2.4%.

Coffee exports remained flat for the month of February and for the period April20 to Feb 21.

Rice exports continue to grow at 33% for Feb-21 month and up by 41% for the period April20 -Feb21.

Marine product exports have remained flat from the last 2 months.
Iron ore exports grow by whooping 172% during Feb-21 and 85% for the period April to Jan-21.

Ceramic products and glassware continue to grow at 13% for Feb-21(one of the sector to show consistent positive growth)

Pharma exports at 16% growth for the month and 21% for April to Feb -21.

Chemicals growth remains subdued at 3% for February and 2% for the period April to Feb-21.

RMG of textiles had degrowth of -7% for Feb(second month of degrowth)

9 Likes

March 2021 merchandise export date update(In Rs Cr terms)

(Almost all commodities recorded positive growth YOY on low base of March 20 due to lockdown imposed towards end of last FY)

Exports during March-21 were Rs.2,50,756 Cr, compared to Rs1,59,784 Cr of March-20 registering a positive growth of 57%.

Coffee exports had growth of 20% yoy for the month of March but overall growth for the period April20 to March21 remained flat at 2%.

Rice exports continue to grow like previous months with growth of at 63% for March-21 month and up by 43% for FY.

Marine product exports for March month at 37%(compared to flat no during previous months) and de-growth of -7% for the whole FY.

Iron ore exports continue at higher rate (+188% for the month) and 95% for FY. (Iron ore prices trades at higher level (Iron Ore - 2022 Data - 2007-2021 Historical - 2023 Forecast - Price - Quote - Chart)

Ceramic products and glassware had growth of 50% for March-21(another month of consistent positive growth)

Pharma exports at 45% growth for the month and 23% for April to March -21.

Chemicals growth had positive growth of 43% during March and 5% for the period April to March-21.

RMG of textiles exports grown at 24% for March and negative growth of 17% for April to March21.

14 Likes

April 2021 merchandise export date update(In Rs Cr)

(Considering April 20 had full impact of lockdown during last year, I have included April 19 data to compare with April 21 rather than comparing with low base of April 20)

India overall export (merchandise and service combined) during April 21 is USD 51.79 Billion)
Merchandise exports during April-21 was Rs. 2,28,071 Cr,(USD30.63 billion) compared to Rs 78,951 Cr of April-20 registering a positive growth of 188% and positive growth of 26% compared to April-19. (Export during April -19 was Rs.1,81,023 Cr).

Coffee exports grew at 5% against April 19 and 71% vs April 20.

Rice exports growth at 61% against April 19 and 58% compared to April 20.

Marine product exports had growth of 25% compared to April 19 and more than 100% against April 20.

Iron ore exports at +243% vs April 19 and 166% compared to April20.

Ceramic products and glassware had growth of 36% vs April 19.

Pharma exports remained consistently positive at 33% and 21% against April19 and April 21 respectively.

Chemicals at 5% growth compared to April 19 and 65% vs April 20 low base.

RMG of textiles had negative growth of -1% compared to April 19.

11 Likes

May 2021 merchandise export date update(In Rs Cr).
(added May 19 data also considering impact of national lockdown on exports during May-20. Even though various states have imposed lockdown during May 21 due to second wave of covid, it was not as severe as first lockdown)

Merchandise exports during May-21 were Rs. 2,36,426 Cr,(USD 32.27 Billion) compared to Rs 1,44,166 Cr of May-20 registering a positive growth of 64% and positive growth of 11% compared to May-19. (Export during May -19 was Rs. 2,09,280 Cr).

Coffee exports were flat against May19.

Rice exports growth at 27% against May19 and 9% compared to May20.

Marine product exports grew at 15% and 29% compared to May19 and May 20 respectively.

Iron ore exports at + 168% vs May19 and 22% compared to May20.

Ceramic products and glassware had growth of 27% against May19 and 76% vs last May.

Pharma exports at 17% against May19 and negative growth of -8% against May 20 (on large base)

Chemicals at 10% growth compared to May19 and 16% % vs May 20.

RMG of textiles had negative growth of -24% compared to May19.

10 Likes

June 2021 merchandise export date update(In Rs Cr).
(added June 19 data for better comparison due to lockdown of last year which was relaxed compared to April/May-20 )

Merchandise exports during June-21 were Rs. 2,39,047 Cr,(USD 32.50 Billion) compared to Rs 1,65,898 Cr of June -20 registering a positive growth of 44% and positive growth of 37% compared to June-19. India’s overall exports( merchandise and services) in June 2021estimated at USD 49.85 Billion showing positive growth of 32% and 17% over June 20 and June 19 respectively.

.

Coffee exports are higher by 10% yoy and 23% compared to june-19.( coffee prices are in upward trend due to low production in Brazil. Trend of international coffee prices can tracked using the link International Coffee Organization - Daily Coffee Prices)

Rice exports remain positive but the growth rate has been reduced from the last two months compared to previous quarters.

Marine product exports continue to grow at 28% compared to June 19 and 30% vs june 20.

Iron ore exports at +149% vs June19 and growth of 40% compared to June 20.

Ceramic products and glassware exports continue to grow at 29% and 33% compared to the same month of last two years.

Pharma exports at 16% against June19 and negative growth of -3% against June 20 (on large base)

Chemicals exports growth is getting better with +72% compared to june19 and 32% vs june20.

RMG of textiles had negative growth of -14% compared to June 19 and positive growth of 21% against last June. Cotton yarn, man made yarn/fabric related to textiles sectors has been showing positive growth in exports.

6 Likes

July 2021 update:

Merchandise exports during July-21 were Rs. 2,64,033 Cr,(USD 35.43 Billion) compared to Rs 1,77,302 Cr of July-20 registering a positive growth of 49% and positive growth of 46% compared to July-19.

India’s overall exports(merchandise and services combined) in July 2021estimated at USD 54.95Billion showing positive growth of 36% and 23% over July20 and july19 respectively.

Coffee exports are higher by 22% compared to July19 and marginally down by -2% vs july20.

Rice exports turned negative by -8% compared to July20. First time rice exports have de-grown in the last 12 months.

Marine product exports continue to grow at 28% compared to July 19 and 47% vs July 20.

Iron ore exports de-growth of -4% compared to July 20 and positive growth of 46% vs july19.

Ceramic products and glassware exports continue to grow consistently

Pharma exports marginal growth of 3% against July20 and 35% compared to july19.

Chemicals exports growth of 39% and 28% compared to july19 and july20 respectively.

Textile related RMG, Cotton yarn, man made yarn/fabric have been showing positive growth in exports from last few months.

11 Likes

August 2021 update:

Merchandise exports during August-21 were Rs. 2,46,863 Cr,(USD 35.43 Billion) compared to Rs 1, 70, 470 Cr of Aug-20 registering a positive growth of 45% and positive growth of 28% compared to August 2019.

India’s overall exports(merchandise and services combined) for Aug 2021estimated at USD 52.2 Billion showing positive growth of 34% and 16% over Aug 20 and Aug19 respectively.

.Coffee exports are higher by 49% compared to Aug 19 and 41% vs Aug 20.

Rice exports increased marginally by 6% compared to Aug 20.(on a high base )

Marine product exports continue to have good export growth of 20% compared to Aug19 and 50% vs Aug 20.

Iron ore exports degrown by -65% compared to Aug 20( significant erosion in iron ore price from peak)

Ceramic products and glassware exports continue to grow consistently over the last few quarters.

Pharma exports muted at 1% against last year Aug.

Chemicals exports growth of 35% compared to the same month of last two years.

Exports for RMG of textiles, Cotton yarn, man made yarn/fabric related to textiles sectors remains positive.

5 Likes

September 2021 update:

Merchandise exports during Sept-21 were Rs. 2,48,605 Cr,(USD 33.79 Billion) compared to Rs 2,02,508 Cr of Sept-20 registering a positive growth of 22.7% and positive growth of 33.9% compared to Sept-19.

India’s overall exports(merchandise and services combined) for Sept 21estimated at USD 54.06 Billion showing positive growth of 21% and 26% over Sept 20 and Sept19 respectively.

Coffee exports are higher by 69% compared to sep 19 and 63% vs sept 20.( international coffee prices are trading at high level due to reduced output from Brazil. Source: International Coffee Organization - Daily Coffee Prices)

Rice exports remained marginally high by 6% similar to previous month.

Marine product exports growth of 10% compared to Sept19 and 13% vs Sept 20.

Iron ore exports continue to degrow by -73% compared to Sept 20.

Ceramic products and glassware exports have turned negative for the first time after many months of continuous growth.

Pharma exports decreased by -8% against sept 20.

Chemicals exports continue to grow at 30% compared to the same month of last year.

Exports for RMG of textiles, Cotton yarn, man made yarn/fabric related to textiles sectors remains positive.

7 Likes

October 2021 update (data was released on 15/11/21)

Merchandise exports during Oct-21 were Rs. 2,67,056 Cr,(USD 35.65 Billion) compared to Rs 1,83,060 Cr in Oct-20 registering a positive growth of 45.8% and positive growth of 43% compared to Oct-19.

India’s overall exports(merchandise and services combined) for Oct 21estimated at USD 56.51Billion showing positive growth of 35% and 29% over Oct 20 and Oct 19 respectively.

Coffee exports remain high by 73% compared to oct 19 and 84% vs oct 20 supported by high global prices.

Rice exports remained flat compared to oct 20

Marine product exports continue to grow well at 20% vs Oct20

Iron ore exports fell by -76% compared to oct 20( global price of iron ore have corrected significantly)

Ceramic products and glassware exports have turned negative for 2nd consecutive month.

Pharma exports remained flat you.

Chemicals exports higher by 52% and 45% compared oct19 and oct20 respectively

Exports for RMG of textiles, Cotton yarn, man made yarn/fabric related to textiles sectors remains strong.

8 Likes

November 2021 update:

Merchandise exports during Nov-21 were Rs. USD 30.04 Billion compared to USD 23.62 Billion in Nov-20 registering a positive growth of 27% and positive growth of 16.5% compared to Nov-19.

India’s overall exports(merchandise and services combined) for Nov 21estimated at USD 50.36 Billion showing positive growth of 23% and 16% over Nov 20 and Nov 19 respectively.

Coffee exports remain high by 72% and 68% compared to Nov19 and Nov20 values.

Rice exports grew by 17% compared to Nov20. (High-teen growth compared to previous six months)

Marine product exports continue to grow well at 29% vs Nov 20

Iron ore exports remains lower by -93% compared to Nov 20

Ceramic products and glassware exports remained negative for the 3rd consecutive month.

Pharma exports are down by -6% and -7% compared to Nov19 and Nov 20.

Chemicals exports were higher by 28% and 33% compared to Nov19 and Nov20 respectively.

Exports for Cotton yarn, man made yarn/fabric related to textiles sectors remains strong.

12 Likes

This is very useful, thank you. Iron Ore should be red instead of green, or am I reading it wrongly?

2 Likes