January 2024 update:
India’s overall exports(merchandise and services combined) during Jan 2024 is estimated at USD 69.72 Billion, exhibiting positive growth 9.28% over Jan 2023.
Merchandise exports during Jan -24 is USD 36.92 Billion compared to USD 35.80 Billion in Jan-23 up by 3.12%.
Services sector export during Jan -24 is estimated at USD 32.80 Billion compared to 28.00 Billion USD during Jan-23.
Merchandise imports during Jan 24 is estimated at USD 54.41 billion compared to 52.83billion during Jan 23.
Overall trade deficit during April- Jan23 improved by 37.11% from USD 111.99 Billion to USD 70.43 Billion April-Jan 24.
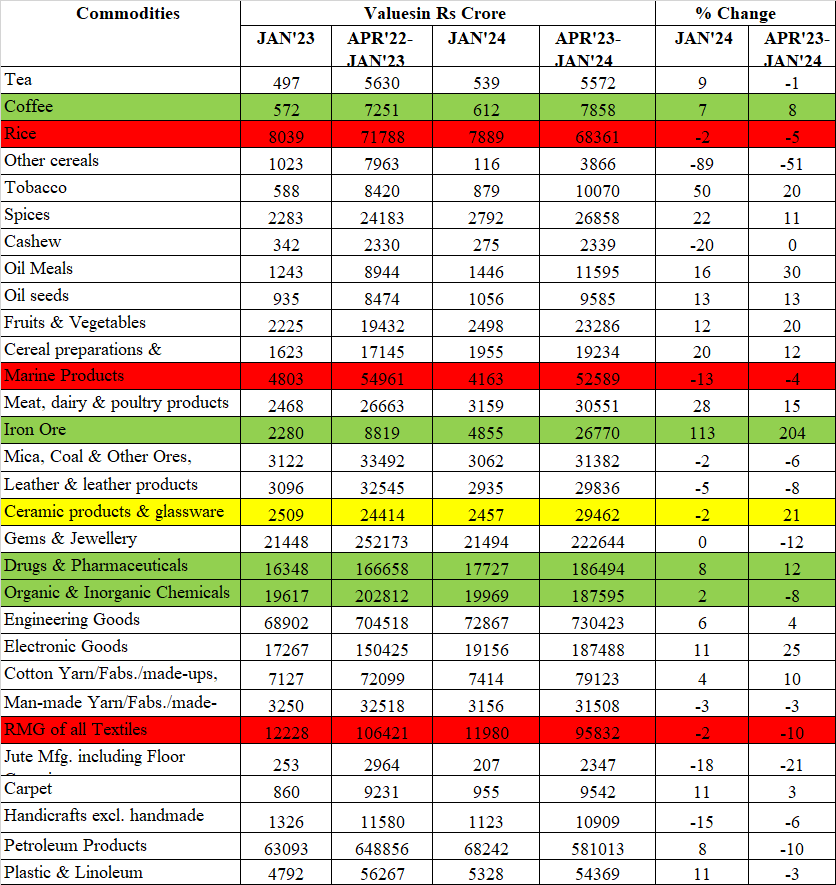
Coffee exports increased by 7% compared to flat no”s during previous month.
Rice exports’ downtrend continues during Janaury month.
Marine products exports down by 13%.
Iron ore exports increased more than 100% for the month.
Ceramic products and glassware export turned negative during Janaury.
Pharma exports continue to grow 8% for Jan month and 12% so far in FY24.
Chemicals exports grow at 2%( positive growth after many months)
RMG of textiles remains negative.
5 Likes
February 2024 update:
India’s overall exports(merchandise and services combined) during Feb 2024 is estimated at USD 73.55 Billion, exhibiting positive growth 14.2% over Feb 23.
India recorded the highest monthly merchandise export during the current FY at USD 41.40 Billion compared to USD 37.01 Billion in Feb 23 an increase of 11.86%.
The estimated value of service export during Feb 24 is at USD 32.15 Billion compared to 27.40 Billion during Feb 23, an increase of 14.7%.
Overall trade deficit during April- Feb24 is at USD 73.55 Billion compared to USD 116.13 Billion during April-Feb 23, an improvement of 37%.
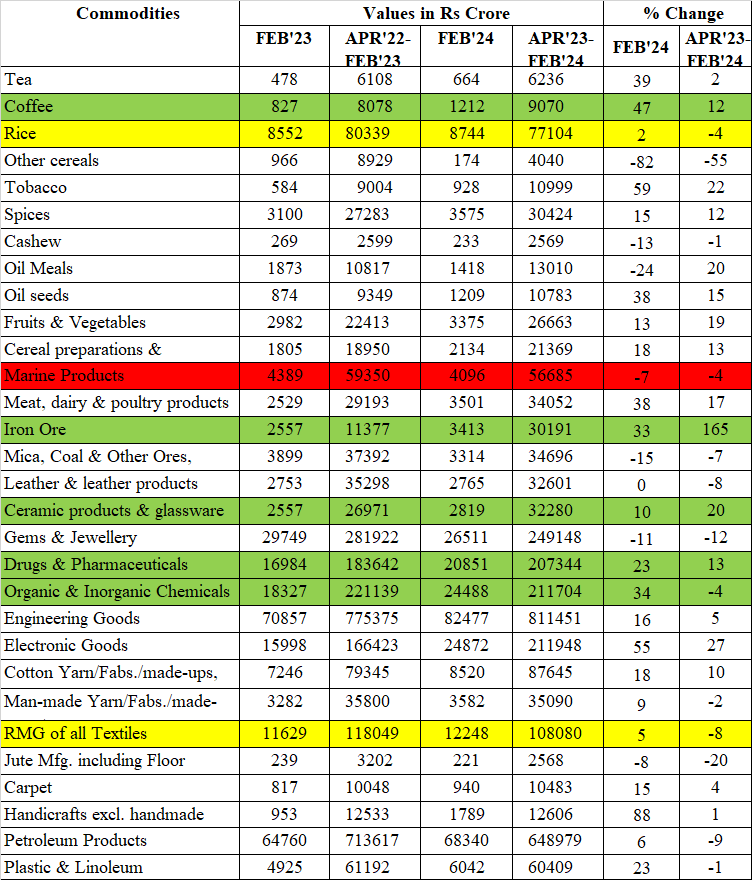
Coffee exports increased significantly by 46.56% for Feb month compared to flat/moderate growth during the last few months.
Rice exports which were in a down trend for many months grew by 2.2%.
Marine products continue to remain negative for the month and year so far.
Iron ore exports increased by 33% during February.
Ceramic products and glassware exports up by 10% ( were negative during Jan month)
Pharma exports grew at 22.7% for Feb month and 12.9% so far in FY24.
Chemicals exports increased by 33.6% which is a significant change compared to downtrend during the FY so far.
Engineering and electronics goods export remained positive.
RMG of textile exports also turned positive.
12 Likes
March 2024 update:
India’s overall exports(merchandise and services combined) during March 2024 is estimated at USD 70.21 Billion, reduced by 3% compared to USD 72.40 during March-23.
Monthly merchandise export during March-24 is USD 41.68 Billion compared to USD 41.96 Billion during March 23.
The estimated value of service export during March 24 is at USD 28.54 Billion, decreased by 6% compared to USD 30.44 Billion during March 23.
Overall trade deficit improved by 35.77% from USD 121.6 Billion in FY23 to USD 78.12 billion in FY24.
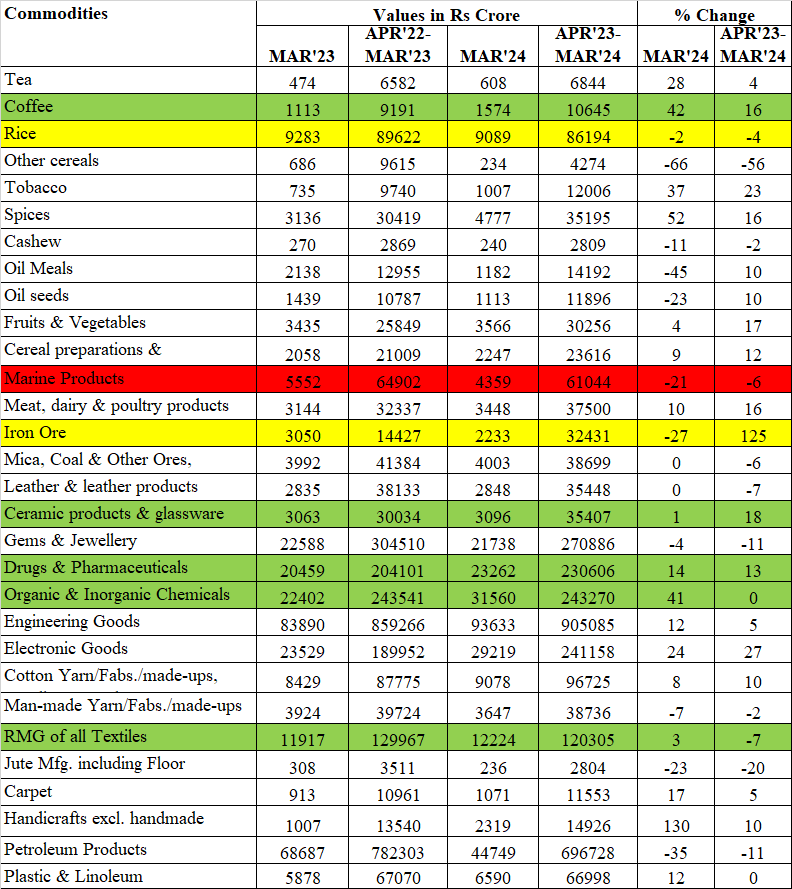
Coffee exports continue to increase significantly up by 42% during March and 16% for FY24.
Rice exports reduced by -2% during March.
Marine products continue to remain negative.
Iron ore exports down by -27% during March( previous few quarters iron ore exports had grown significantly)
Ceramic products exports were flat during the month.
Pharma exports continue to grow 14%for the month and 13% during FY24.
Chemicals exports rose by 41% during March.
Engineering and electronic exports continue to grow.
RMG of textile exports had the 2nd consecutive month of positive growth.
11 Likes
April 2024 update:
India’s overall exports(merchandise and services combined) during April 2024 is estimated at USD 64.56Billion, up by 6.8% compared to USD 60.40 Billion during April-23.
Total import during April-24 is estimated at USD 71.07 billion , exhibiting a positive growth of 12.78% over April-23.
Monthly merchandise export during April-24 is USD 34.99 Billion compared to USD 34.62 Billion during March 23.
The estimated value of service export during April 24 is at USD 29.57 Billion compared to USD 25.78 Billion during April 23.
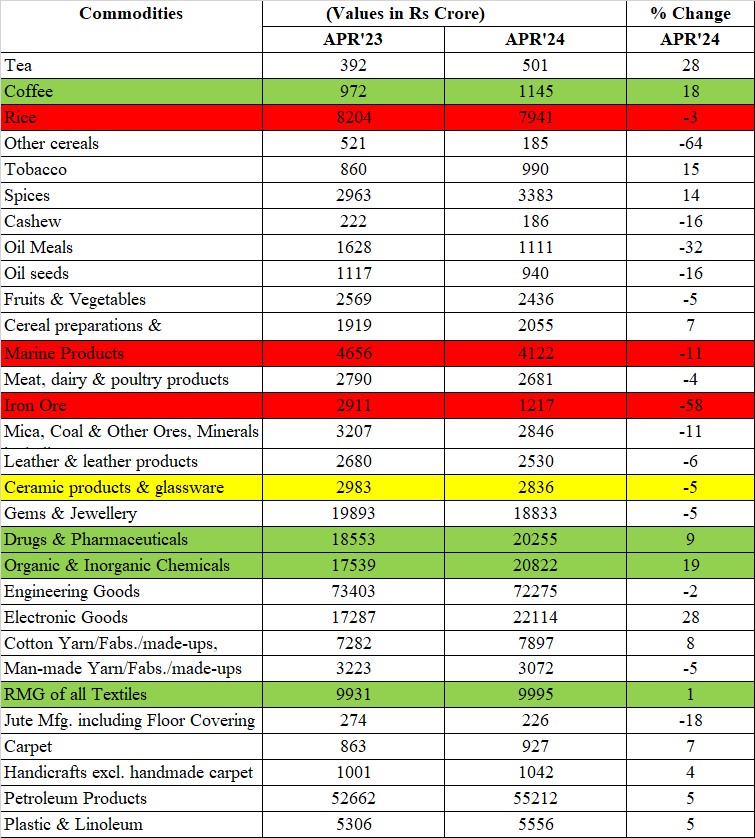
Coffee exports continue to be increase, up by 18% for the month of April.
Rice exports remain negative.
Marine products export was reduced by 11% for the month.
Iron ore exports fell significantly by -58%.
Ceramic products and glassware exports fell by -5%.
Pharma exports continue to grow by 9% during the month.
Chemicals exports increased by 19% during April.
Electronic goods continue to grow impressively by 28%.
Press Information Bureau
12 Likes
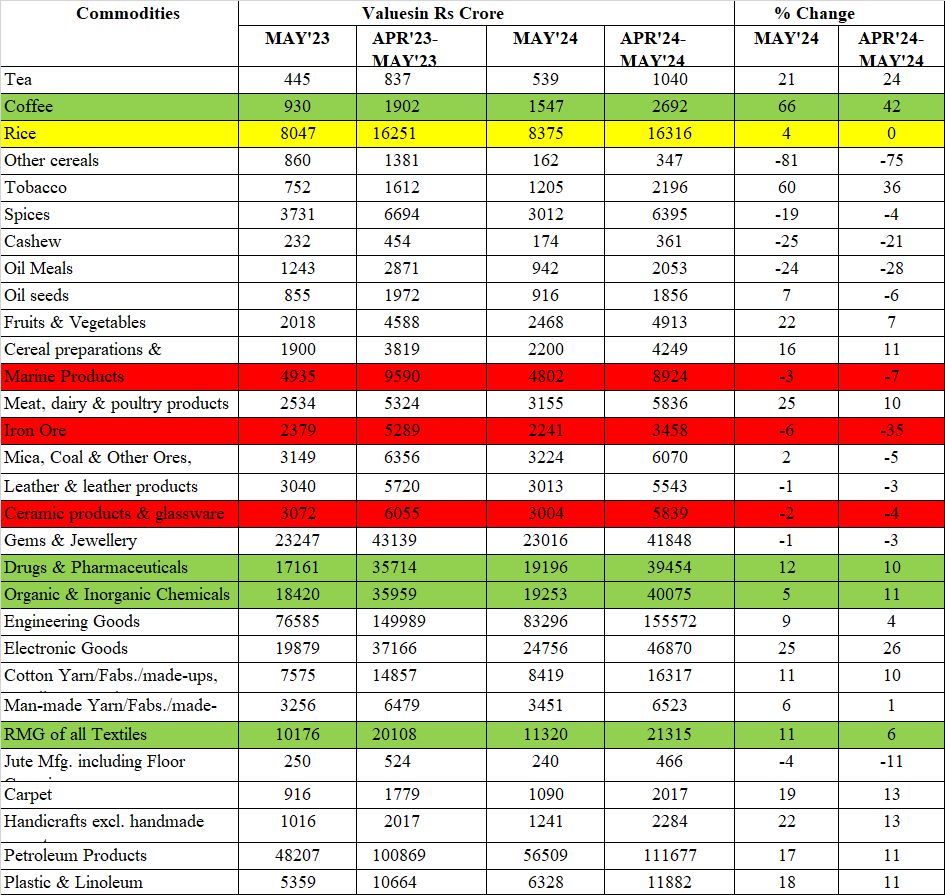
May 2024 update:
India’s overall exports(merchandise and services combined) during May 2024 is estimated at USD 68.29Billion, increase of 10.25% compared to May-23.
Total import during May-24 is estimated at USD 79.20 billion, positive growth of 17.95% over May-23.
Monthly merchandise export during May-24 is USD 38.13Billion compared to USD 34.95Billion during May 23.
The estimated value of service export during May-24 is at USD 30.16Billion compared to USD 26.99 Billion during May-23.
Coffee exports grew significantly, up by 66% during May-24
Rice exports grew in low single digit at 4%.
Marine products export remains negative.
Iron ore exports fell moderately compared to previous months…
Ceramic products and glassware exports continue to fall like previous month.
Pharma exports continue to grow by 12% during the month.
Chemicals exports increased by 5% during May-24.
Engineering and electronic exports continue to grow.
RMG of textiles exports up by11% for the month.
5 Likes