
Entering and Exiting Cyclicals
One of the key arguments I have heard against cyclicals is:
- One cannot predict when the cycle will turn.
- Making money in a cyclical requires one to correctly time the entry and the exit, since these are typically not ‘buy and hold’ type companies. This increases the scope for making erroneous decisions thereby reducing returns.
These are both correct. The first one, imo is difficult to predict because the cycles are not uniform (same length or amplitude) and there can also be nestled cycles in specific industries (similar to the nestled cycles in economy, as pointed out in Ray Dalio’s video which Harsh talks about in first post). I will try to make some progress on the second point. Are there “no-brainer” entry and exit points one can think about, from a data-driven analysis? I think the answer is yes.
I will take a case study of National Aluminium Company and Sobha Ltd both in cyclical sectors. Their respective threads contain very good information for how to analyze them from fundamental aspects. I only probe the question of “no brainer” entry and exit points.
National Aluminium Company
Fundamentals
I superimpose the price movement with the fundamentals (Operating Margins, Gross Margins, Sales) to see what we can learn from the data.
Note for Fundamentals graphs: All Prices and Fundamentals are scaled to fit better when comparing relative fluctuations. Raw data is at this google sheet.
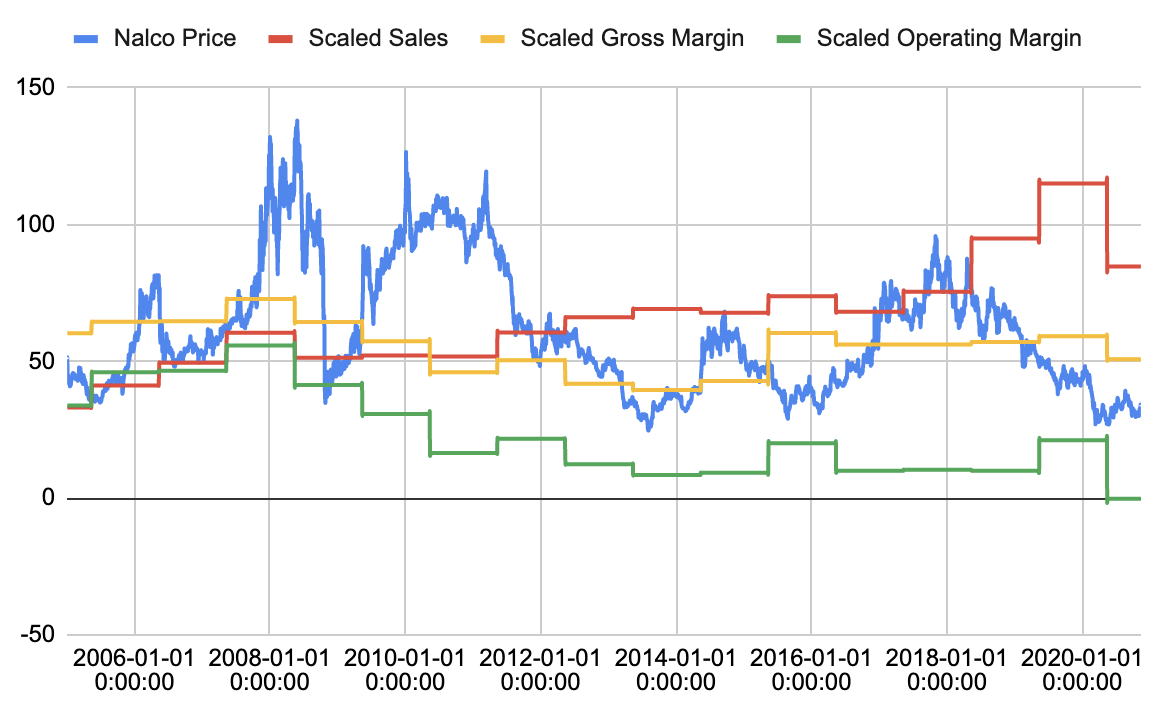
Inferences:
- Despite the Margins and Sales Collapsing between 2008 and 2011, the stock price came back to previous highs in 2010 (possibly in anticipation of improvement in fundamentals). When fundamentals didn’t improve, it collapsed again.
- The two times that margins and sales expanded post 2011 were in 2016 and 2020. Both times, the stock price moved in anticipation of the improvement and the price high preceeded the fundamentals high by roughly 1-1.5 years in 2016 and 1.5-2 years in 2020.
- This clearly demonstrates the difficulty in timing cyclicals. The price appreciation happens in anticipation of fundamentals improving. If we wait for TTM numbers to show a margin or sales expansion, a lot of upside might already be off the plate.
- I did investigate more granular fundamentals data (Quarterly) but that proved to be too noisy with margins fluctuating a lot.
Technicals
I also investigate whether it might be possible to enter these cyclicals in a price-chart/technical indicator based manner. I look at RSI. Since we’re talking about multi-year cycles, I look at the monthly RSI (1 data point is represented by 1 month).

Inferences:
- When RSI dips below 40, it presents a good buying opportunity (eg: Nov 2008, Jun 2013, Jul 2015, Mar-Now 2020).
- However, we also observe that RSI has to decisively break the resistance of 40 on the way up, for there to be a sustained price appreciation. In Dec 2011-Jun 2012, RSI did go below 40 (and even touched 30) but sustained below 40, resulting in price erosion.
- From these, I conclude that if one can make a subjective judgement as to whether RSI has broken above 40 then it presents a good buying opportunity. Note that this has not yet happened in 2020. RSI tested 40 in Aug 2020 and Nov 2020 but hasn’t decisively broken above 40.
- The RSI peaks above 60 and 70. This has happened multiple times. 2002, 2003, 2006, 2008, 2017 at RSI of 70 and 2009, 2014 for RSI of 60. From this, I conclude that an RSI of 60 possibly represents a good time to start unwinding a cyclical investment/trade.
Sobha Ltd
Fundamentals
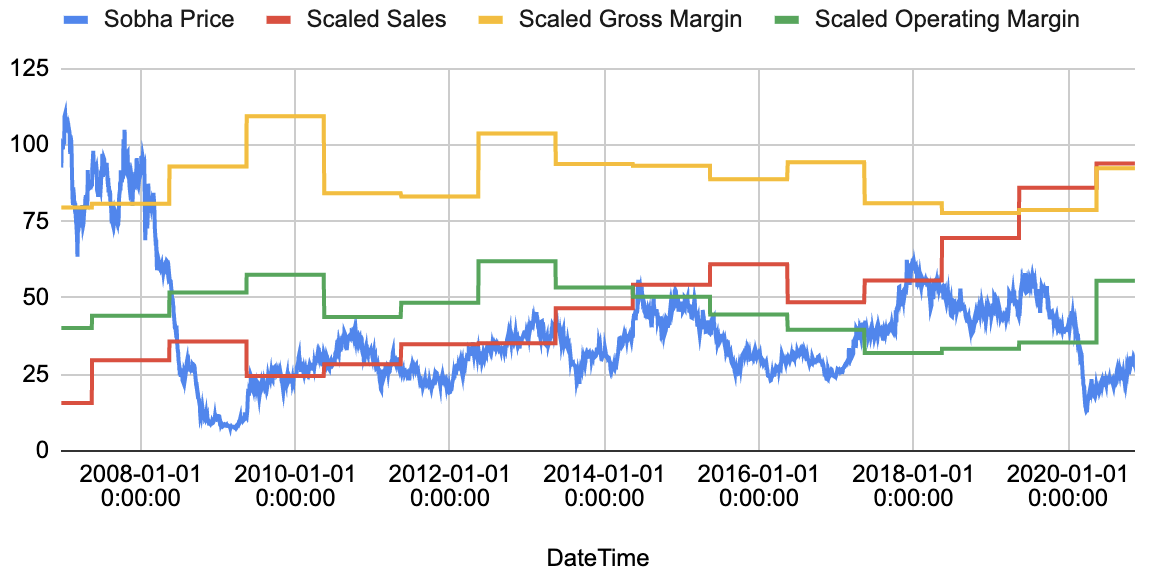
Inferences:
- Sales have been non-cyclical for Sobha (almost ever increasing).
- Margins wise, the only clear pattern is that operating margins have been under pressure since 2014 until 2020 and yet, prices have moved in anticipation of the improvement in fundamentals in 2017 & 2018. If an investor had waited for the margins to bottom out, a lot of price appreciation would already have happened.
Technicals
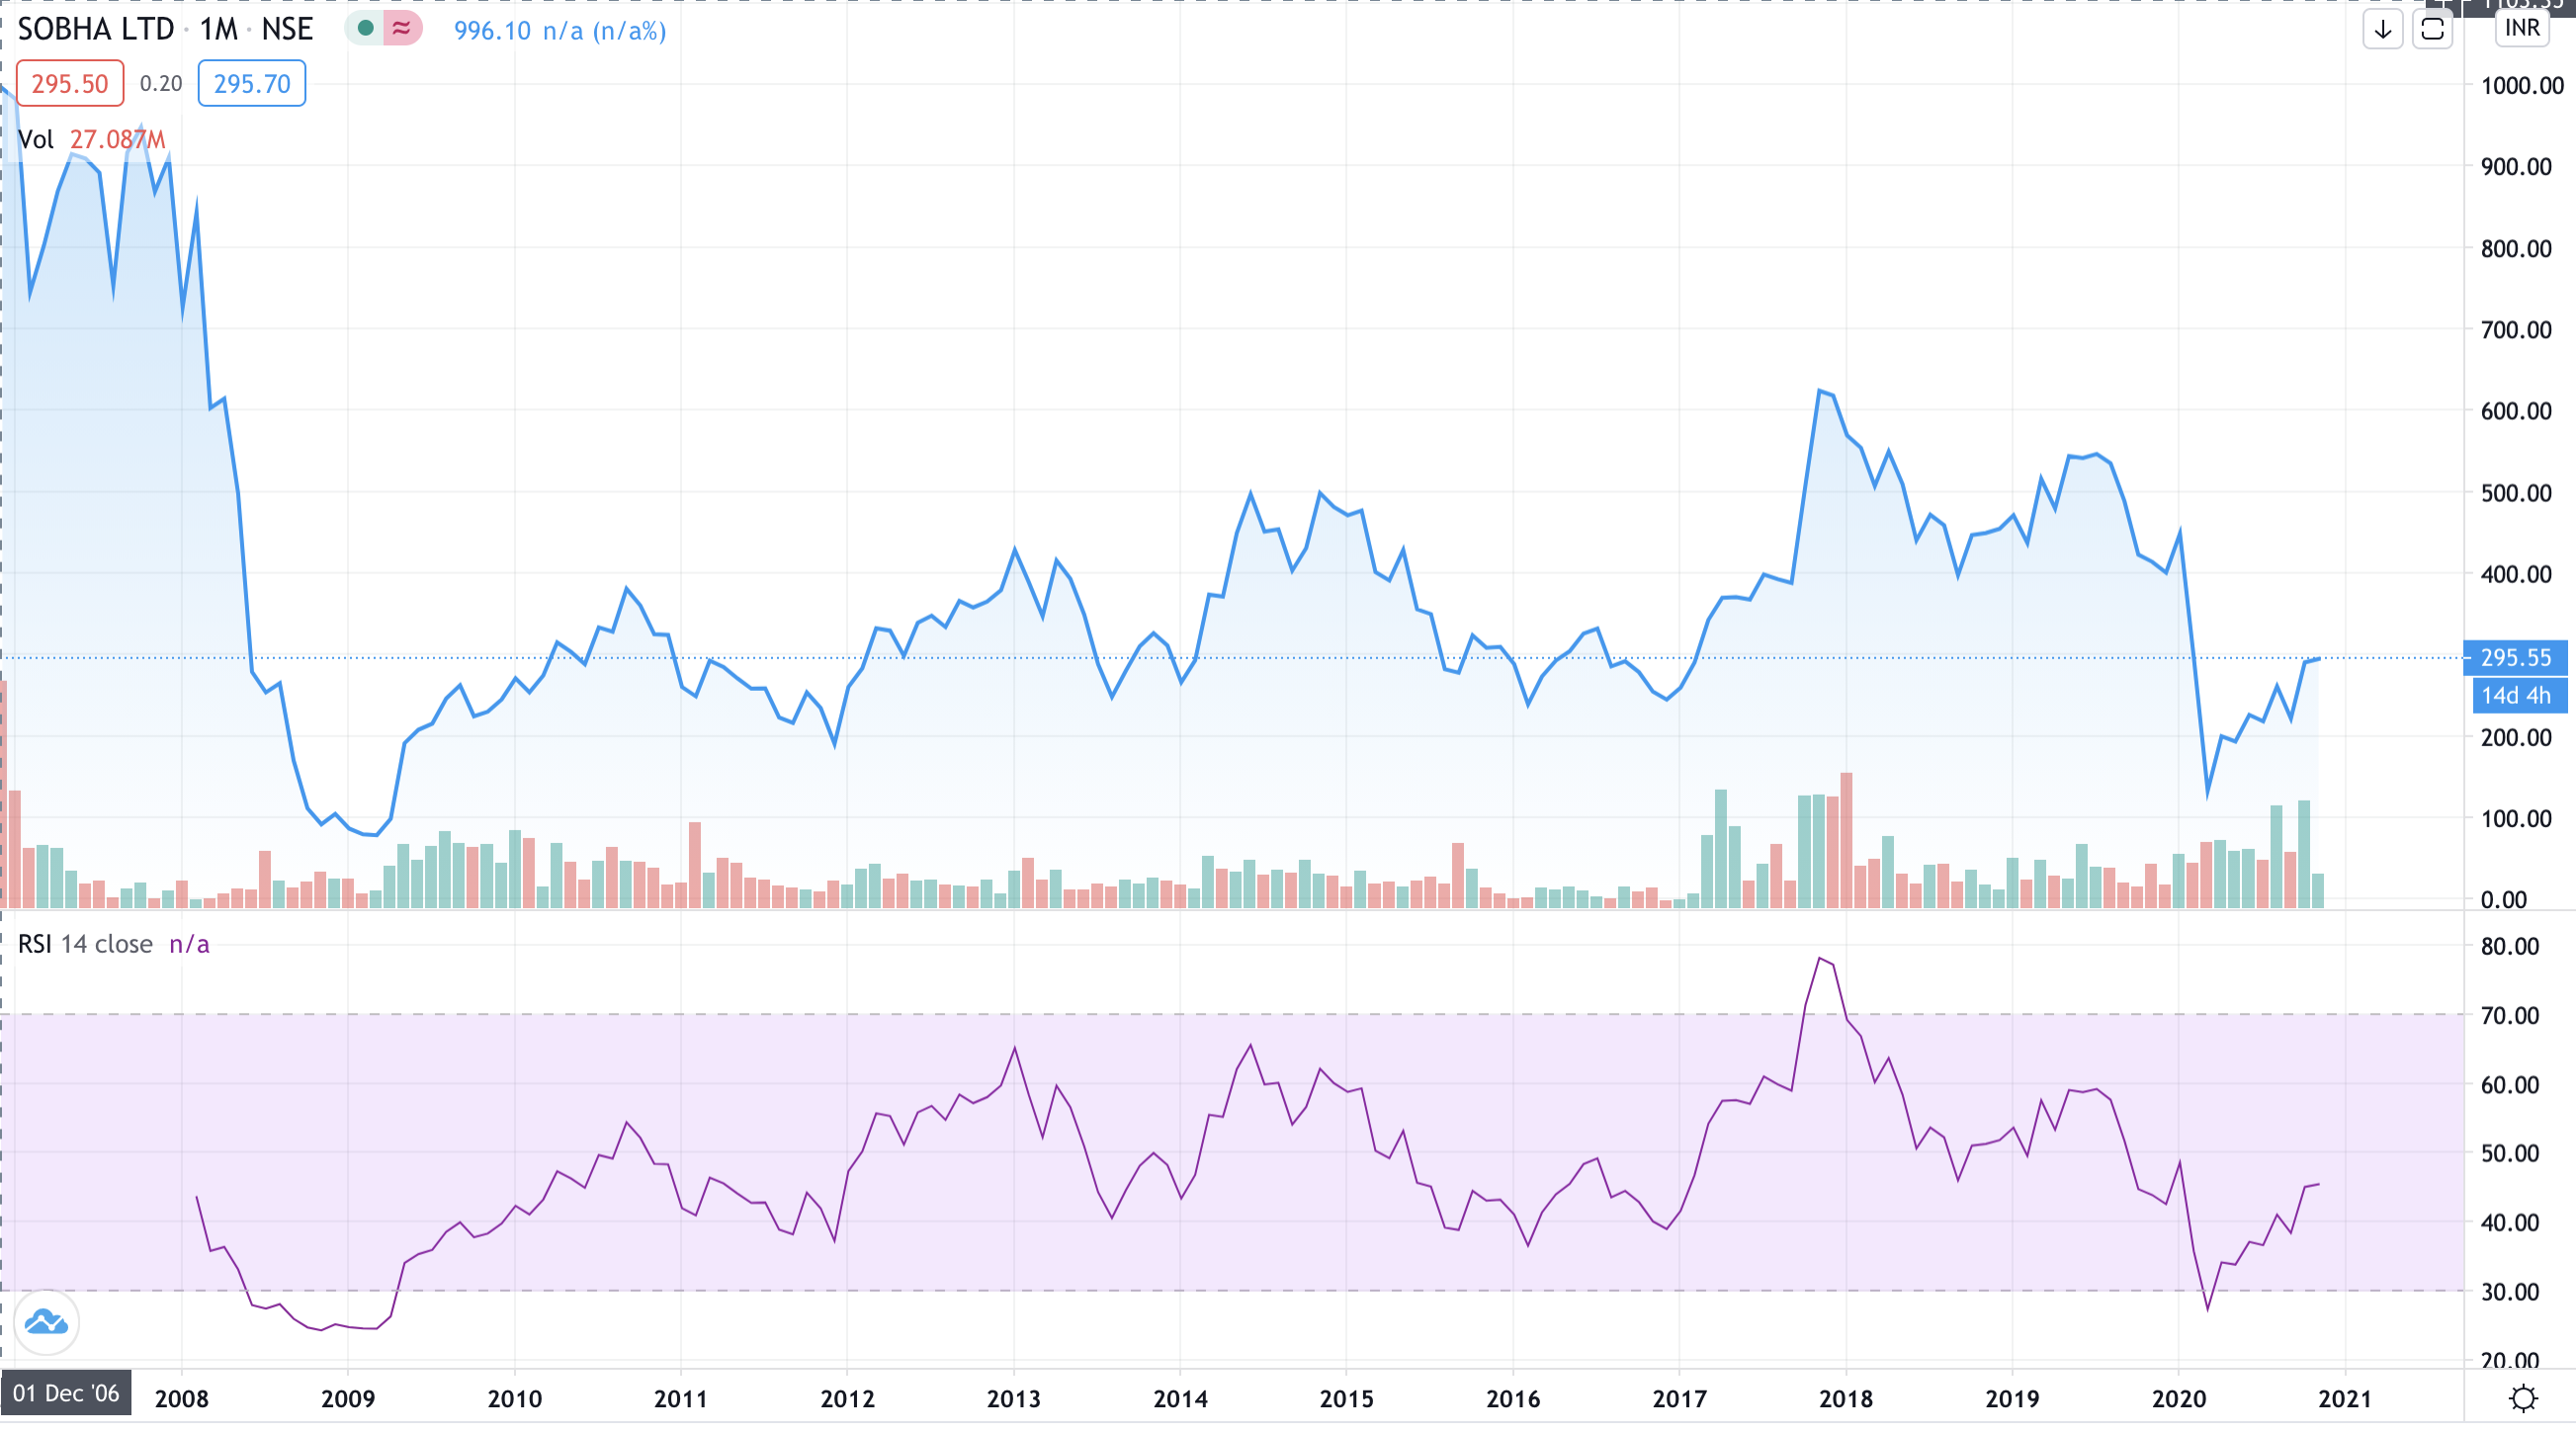
Inferences:
- Similar to Nalco, Sobha presents buying opportunities below an RSI of 40 and peaks near RSI of 60 and 70.
Conclusion
In my understanding, utilizing technical indicators in addition to monitoring the fundamentals enables the investors to time entry and exit decisions better, because the prices often move in anticipation/speculation of improvement in fundamentals.
Sources:
- tikr.com for fundamental data
- in.tradingview.com for technicals data
Disc: Small position in Nalco, no position in Sobha.