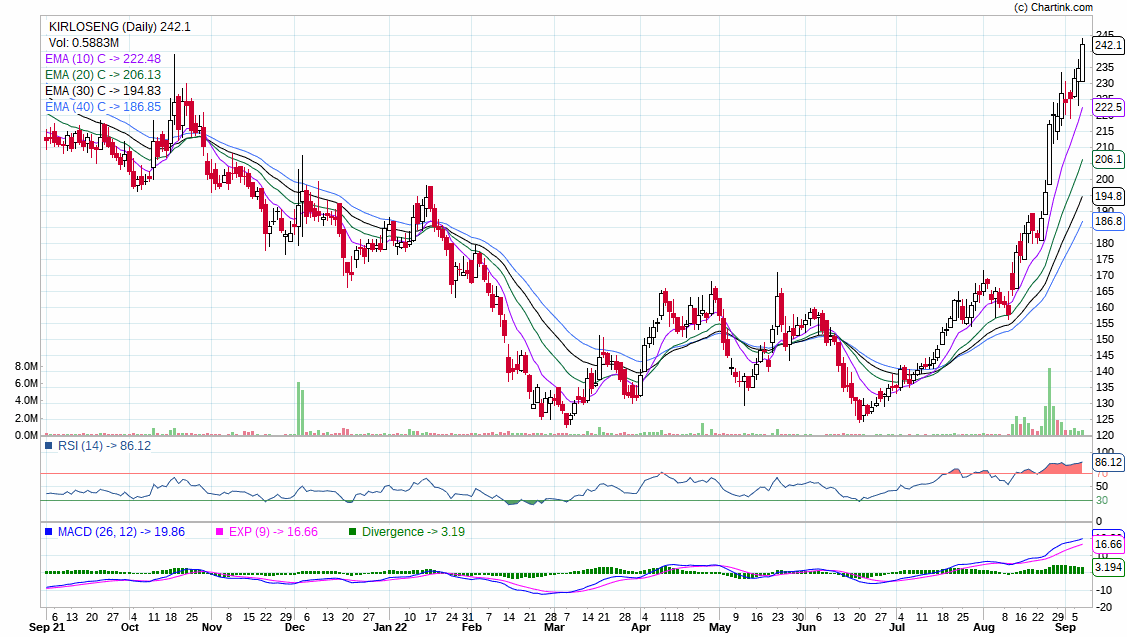
Attached a chart for Kirloskar Oil Engines. Crossed YH couple of days back. Strong company, little laid back. Market did not liked their foray into NBFC and investing 1000 Cr and therefore the stock WAS extremely cheap. Now the Industrial cycle is in upswing so getting back into favor. Valuations are still not demanding though obviously the management is not to the calibre of Cummins etc. However I believe valuations kind of factor in that inefficiency.
Disc: Invested and transactions in last 30 days
1 Like
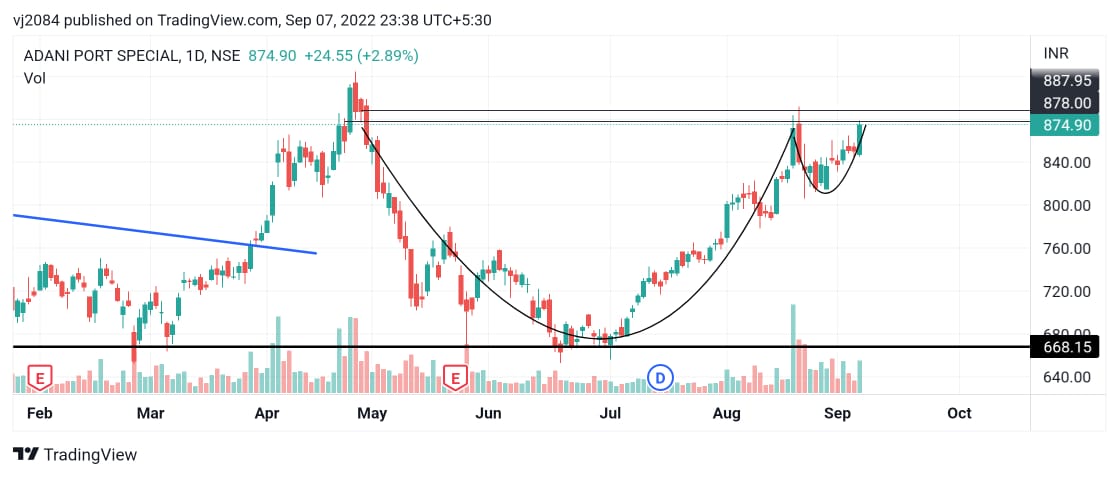
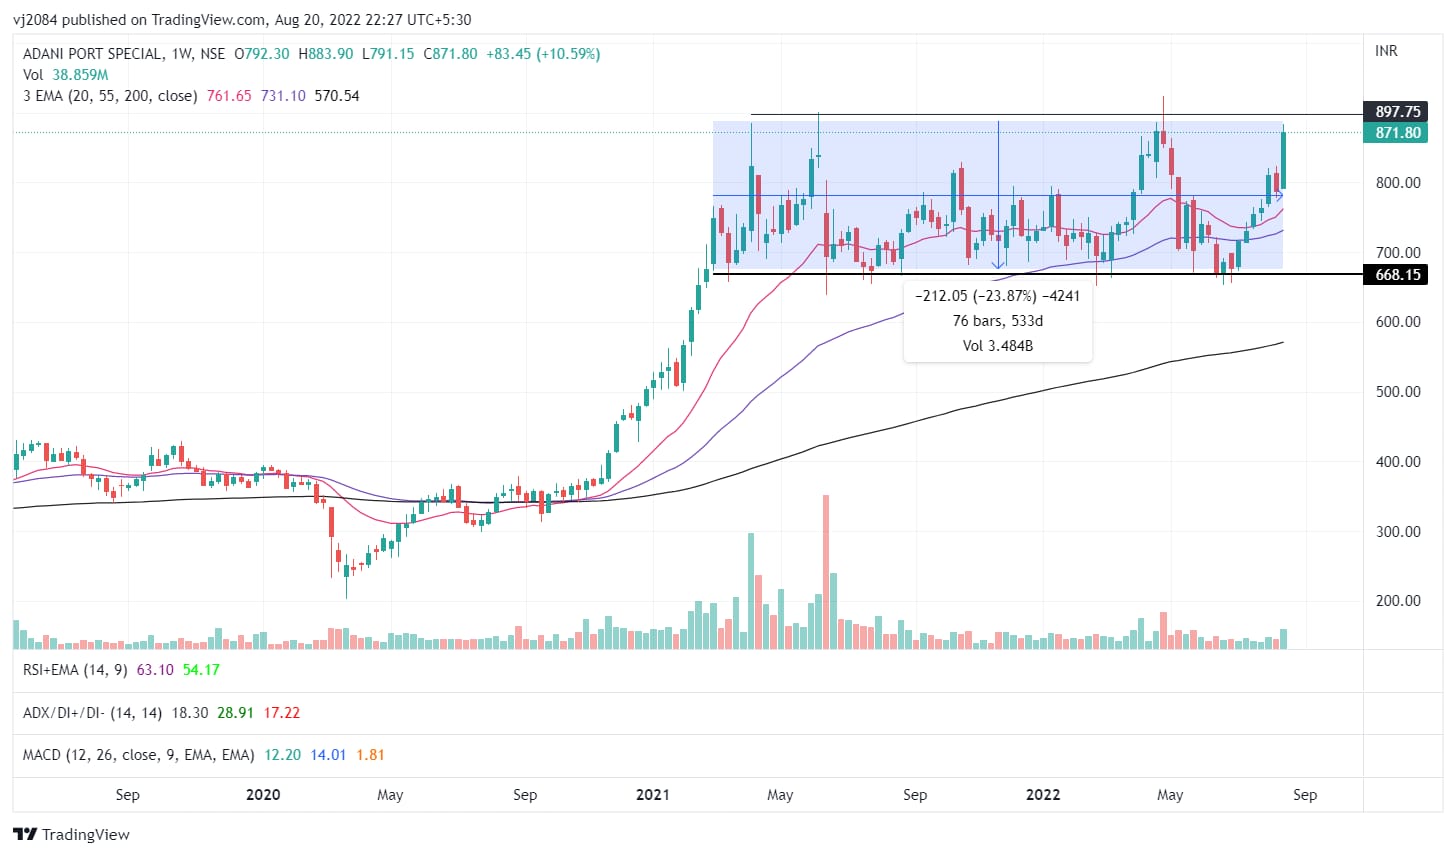
#Adani Ports near to highs CMP 880…formimg cup and handle pattern and breakout above 890-900 range. It has trading in 660-900 range for almost 15 months…depth of cup is Rs.200 so technically tgt should be Rs.1100…
Fundamentally it has posted highest cargo volumes in Jul 2022 and handles major trade volumes of trade for India.
2 Likes
@phreakv6 All the companies you’ve been tracking in this thread recently are consumption themes and have high PEs like VBL, Manyavar, Devyani etc.
I am actively into markets for a little over a year and find it comfortable to invest in themes/stocks where valuations are low or reasonable (By any metric, be it P/E or EV/EBITDA or P/S) and capturing gains either as the company re-rates or earnings grow. One area I have been quite uncomfortable in and haven’t done well is wrt buying/selling consumption themes which are trading at what I feel are insanely high PEs (For what its worth, the insanity is borne out in my personal DCF calculations and isn’t merely eyeball insanity). To give an example, I was a long time holder of Asian Paints and Pidilite but sold them off in April when I felt crude was going to keep them under pressure for a long time and they were anyway trading at “insane PEs” (high divergence in pre and post covid PEs). But to my utter surprise they bounced and one of them is trading at lifetime high PEs (I’d put this on Twitter a few weeks ago - https://twitter.com/nirvana_laha/status/1562441986237681665)
Given you seem quite comfortable in playing high PE consumption themes, I am hoping to get a few insights from your style. My questions are:
-
What is your investment horizon when you enter such stocks and what is it dictated by?
-
While its relatively easier to gauge upcoming tailwinds/headwinds in these themes if one keeps an eye out for the economy, how do you evaluate whether entry valuations are decent enough to give you a respectable CAGR over your horizon?
-
Or is it that you play these themes strictly with the help of price-volume and other technical indicators and respect them during entry-exit and don’t bother so much about entry and exit valuations?
And one general question if you’re ok answering : What is your investment framework at the moment? If there’s already a thread where you’ve spoken about this, please do point me to it. Thanks!
8 Likes
@nirvana_laha I am just a trader - discretionary & systematic - mostly discretionary as I rely on what “feels” right - the feel is essentially a 1:5 risk:reward (lose 10% max or win 50%, downside of 20% for 2x and so on) within 3-6 months, based on charts, fundamentals and some perception gaps. This has worked exceptionally well in the last 3 odd years especially and most of those charts are in this thread. When I don’t see too many such 1:5 risk:reward trades, I simply sit out like I did mostly between Oct '21-Jun '22. This did exceptionally well and the gains were simply too much to waste on middling trades. I don’t consider myself skilled enough to find great trades when the odds of finding them are slim (Fish where the fish are).
Now most of the trades are in micro/small caps in the last 3 years because that’s where the perception gaps are and where these 1:5 trades often appear (mids/larges are well-covered), especially when liquidity is high and caution is thrown out as most of these that trade at 10x earnings get to 25-30x without the business doing anything special, or pretending to do something special.
I extensively use Kelly Criterion for position sizing (which means most bets can get to 15-20% allocation mark easily when the risk:reward is in favour) - again this is not math driven but intuition driven (you know in your gut when your position size is off), going by liquidity, along with the risk:reward as mentioned above.
With that background - in '20 and '21, there were lot of 1:10 trades that offered 2x or even more with just 10% downside. In '21 there were only 50% sort of upsides I could find but with almost 20% downside. In '22 barely any with the same risk:reward in small/micros. This system works OK and you can have a splendid CAGR, but your turnover is almost 4-6x your capital when you are aggressive and you end up paying a lot of tax as well (which is absolutely fine - good problems to have)
But at some point of time, your capital is bound to grow where the same strategy can’t work. You can’t find enough micro/smallcaps with the same sort of risk:reward in the same 3-6 month time period (again, I speak as a trader - a novice at that). Also there’s a watermark in most of our minds in terms of what’s a good capital base post which we want to take lesser risks. I think I have crossed that limit sometime in the last year and would want to extend time horizon for the same risk:reward of 1:5. This means I churn less, take lesser risks in a overheated market in illiquid scrips.
That’s where this strategy change came in - the only way I could convince myself to get back in the market was to see a bigger picture of where we are heading as a country, in terms of per capita incomes and consumption. Also, our market being a smallcap in the global scheme of things meant a flood of capital coming in due to narrowing of global markets (which I think is bound to happen) was going to go into most liquid midcaps/largecaps (which are global smallcaps). Also, it gives me the opportunity to allocate more of my capital per scrip - which means lesser ideas to hunt for in a dwindling ideas market - and lesser decisions to make, when your hit rate is bound to be poor due to market conditions.
So that’s what it is. I don’t know if its the right thing. I may change my mind as I am also trying to experiment and find out what works best for my temperament and capital. This is probably not the right way and I think everyone should find their own process and see what works.
Disc: I am a novice. Those consumption stocks were bought in early July and unless your horizon is long, now is perhaps not a good time to touch them.
60 Likes
Hi, I have a question. How do you identify risk and mainly reward from the chart? Risk or downside could be identified from some resistance level, but I dont know how to get approx idea about reward. Would it be possible to explain through any technical chart? Example could be from any past/current holding. Thanks
1 Like
Thanks for sharing your thought process here. Insightful. Though my own style is not that of a trader (even if I end up trading occasionally anyway when something dents my risk-reward assessment), the way you have articulated your approach is something for me to think about. I also did not know of the Kelly Criterion. It’s been a slow journey for me to build the confidence to increase my position sizes. As you put it, I have relied more on what “feels” right. A framework like the Kelly Criterion could help me be more structured about it. I will study this further. Is there some excel calculator on that available that you are aware of?
1 Like
Quite interesting!
Can I pick your brain on some of the liesure plays - note that I have not seen the fundamentals for all except Lemon tree and Eicher.
Inox Leisure, PVR, Wonderla, Imagica, Ajwa Funworld, Nicco parks, Lemon tree and Eicher
Your thoughts please.
@phreakv6 I’m novice in TA, how do you define 1:5 risk reward? What parameters define that?
Risk:reward can’t be identified with just the chart I feel. Although pure TAs might disagree. Chart is good for identifying supports, which act as natural stops - however, there should be a valuation comfort as well in terms of support to bet big. As for reward, this varies - in '20 it was easy to buy at a big discount to long-term valuations due to Covid crash - this meant a reward was simply P/E reaching back to long-term median. Towards late '20 and early '21, there were several winners from Covid in healthcare (Poly Med, Laurus etc.) and also due to disruptions to supply chains (lot of Chemicals businesses - TAN, PAN etc.) - here more than re-rating to long-term P/E the reward was in figuring out possible growth in future earnings. Sometimes its re-rating due to perception gaps, along with earnings growth (like Deepak Fert) and sometimes its commodity plays (like GPIL). So there’s no easy way out to figure out reward, unlike risk.
@asarun
Kelly Criterion is something we use intuitively. Have positions large enough to make sure your research matters and not too large that it makes you feel uncomfortable. We do this all the time - we are good at pushing to the limits. The math is very straight-forward and most good investors use a version of this. Pabrai talks about it in Dhando investor for eg. and Ed Thorp swears by it. You can read about it in Fortune’s formula and several other math/investing books. Not aware of any excel calculator. If we have to calculate, I feel we might be doing it wrong. Understanding the intuition alone should be sufficient. Poly Med for eg. was a 20% position and at one point of time was over 45% of my net-worth. You have to let it run until its clearly over-valued which happened around May '21 around 1150 levels. My valuation of it at the time was ~900. It was a clear sell and I booked out almost all of it.
@iyeron - I have no view on most of these. I held Royal Orchid for sometime and also traded Indian Hotels last year in the hotels space. These were nobrainer buys last year. There’s a clear lack of capacity and operating leverage is playing out beautifully in this sector. I think that might continue for sometime. Other leisure plays, I have no view
@S.A.B - I have addressed risk:reward bit above. Hope that helps
I am no expert and there are better market veterans on VP like @hitesh2710 who are doing a wonderful job explaining how they go about doing things. I highly suggest you all go through his wonderful thread which is full of insights. I have learnt most of what I know by observing and absorbing what he does and adding little things of my own based on my temperament. None of this is original.
24 Likes
Equitas SFB
A note on the Volumes and Fundamentals
-The first red cycle shows the resignation due to charity reasons (first time a banker is resigning voluntarily) of P. Vasu and subsequent loss of trust which is reflected in heavy volume bars.
-Second circle represents the re-entry of institutions as a bank which can do 2%+ ROA and 15% ROE was at 1.1x Price to book valuation. This year, credit cost also normalizes.
This chart is an example of the war of volumes that happens between bulls and bears+why market can be a voting machine in the short run and weighing machine in the long?
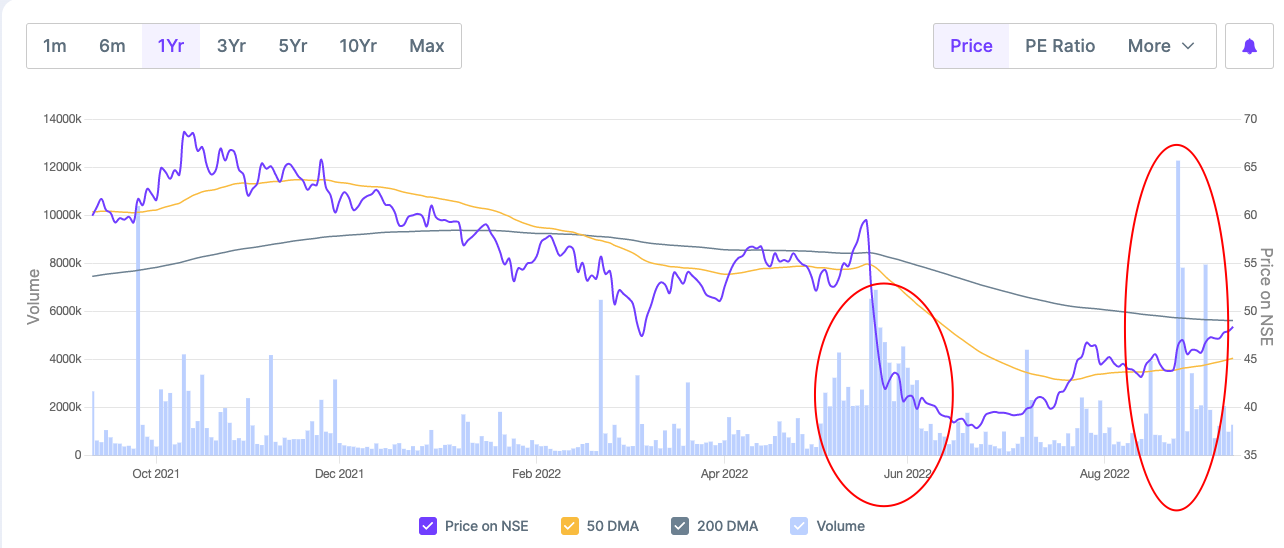
Disc:- Invested.
15 Likes
Thank you. I read up a bit today. Interesting that the Kelly Criterion does not actually consider a probability assessment on the specific stock (per my understanding). Should see what I get as Win Probability and Win/Loss ratio, when I apply it to my performance last year. I looked at this page to know more about it - Kelly Criterion for Asset Allocation and Money Management.
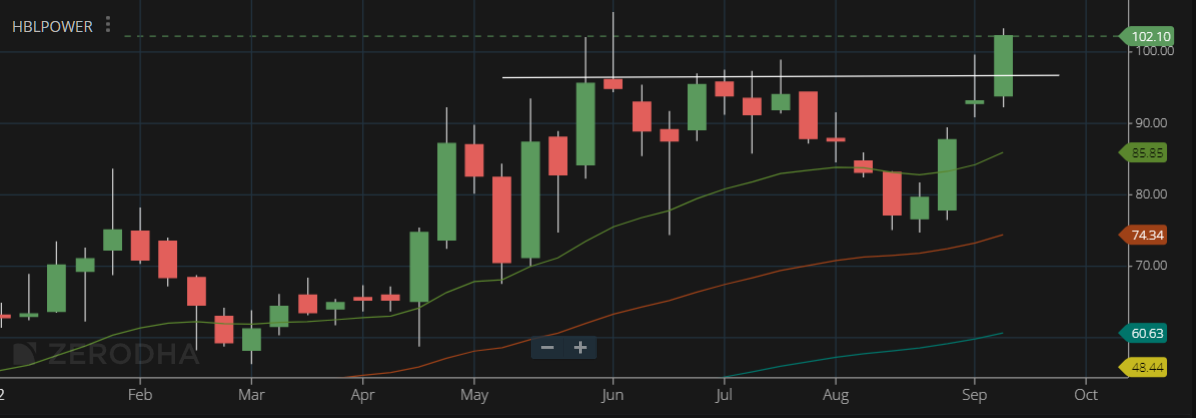
Some decent charts to play the manufacturing, auto, capital goods, govt. capex and railway infra themes
I do not know much about these businesses to know what the upside can be but have taken some positions so that I have the incentive and motivation to understand. All these seem to be on strong uptrends or getting started on strong moves
HBL Power, Weekly - If it manages above 100 this week, it could be a strong close. Has been struggling to do so for few months now. Recent order wins seem to be giving some impetus. There is however supply in the market from a large seller (Banyan Tree) but it might be drying up finally going by the strength.
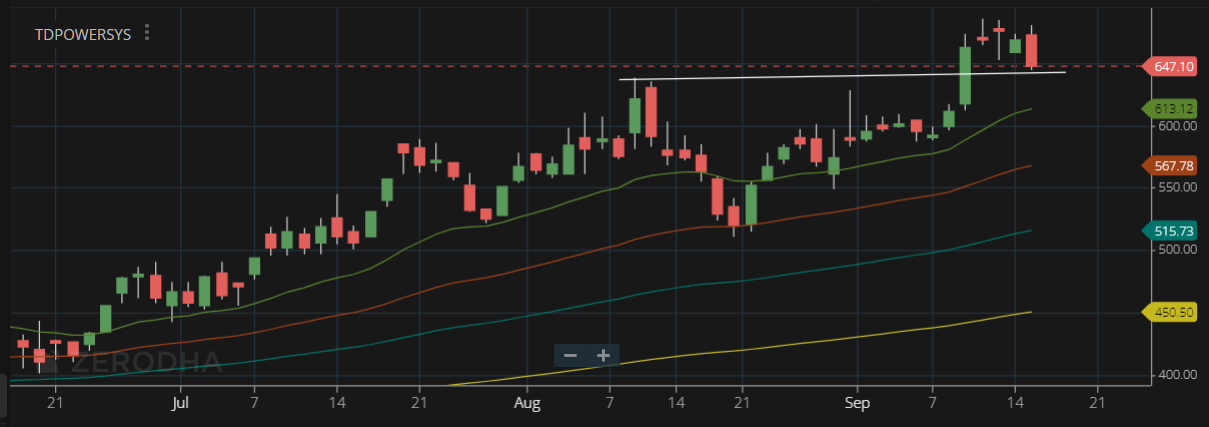
TD Power, Daily - Has been trending strongly from 200 levels. Strong order book powered by capex recovery and also from railways. Valuation perhaps not too much in favour but the order tailwind might sustain for sometime. They do have some sort of moat in the kind of businesses they are in.
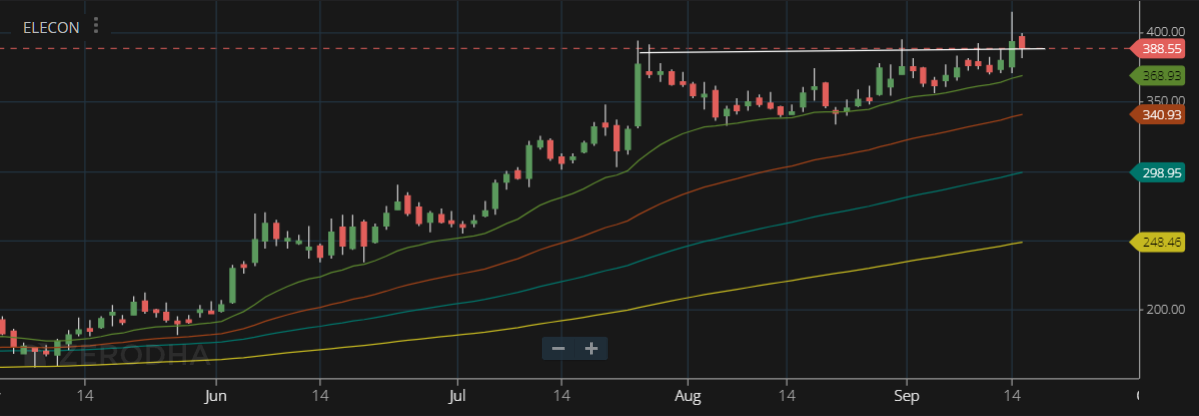
Elecon,Daily - Appears to be retesting the breakout from 2 month consolidation. Has been on a strong uptrend for several weeks
Sundaram Clayton, Weekly - Seems to be a long-term breakout.
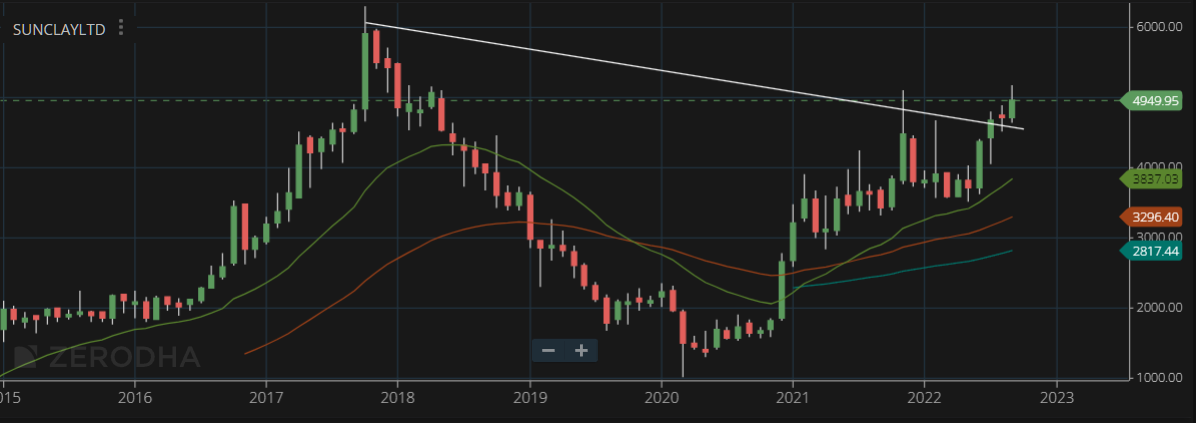
Disc: Have small foot-in-the-door positions in these so that I don’t get blinkered into sticking to the consumption theme alone. HBL Power from 90 levels (somewhat bigger position), TD Power from current levels, Elecon around 380, Clayton from 4900
29 Likes
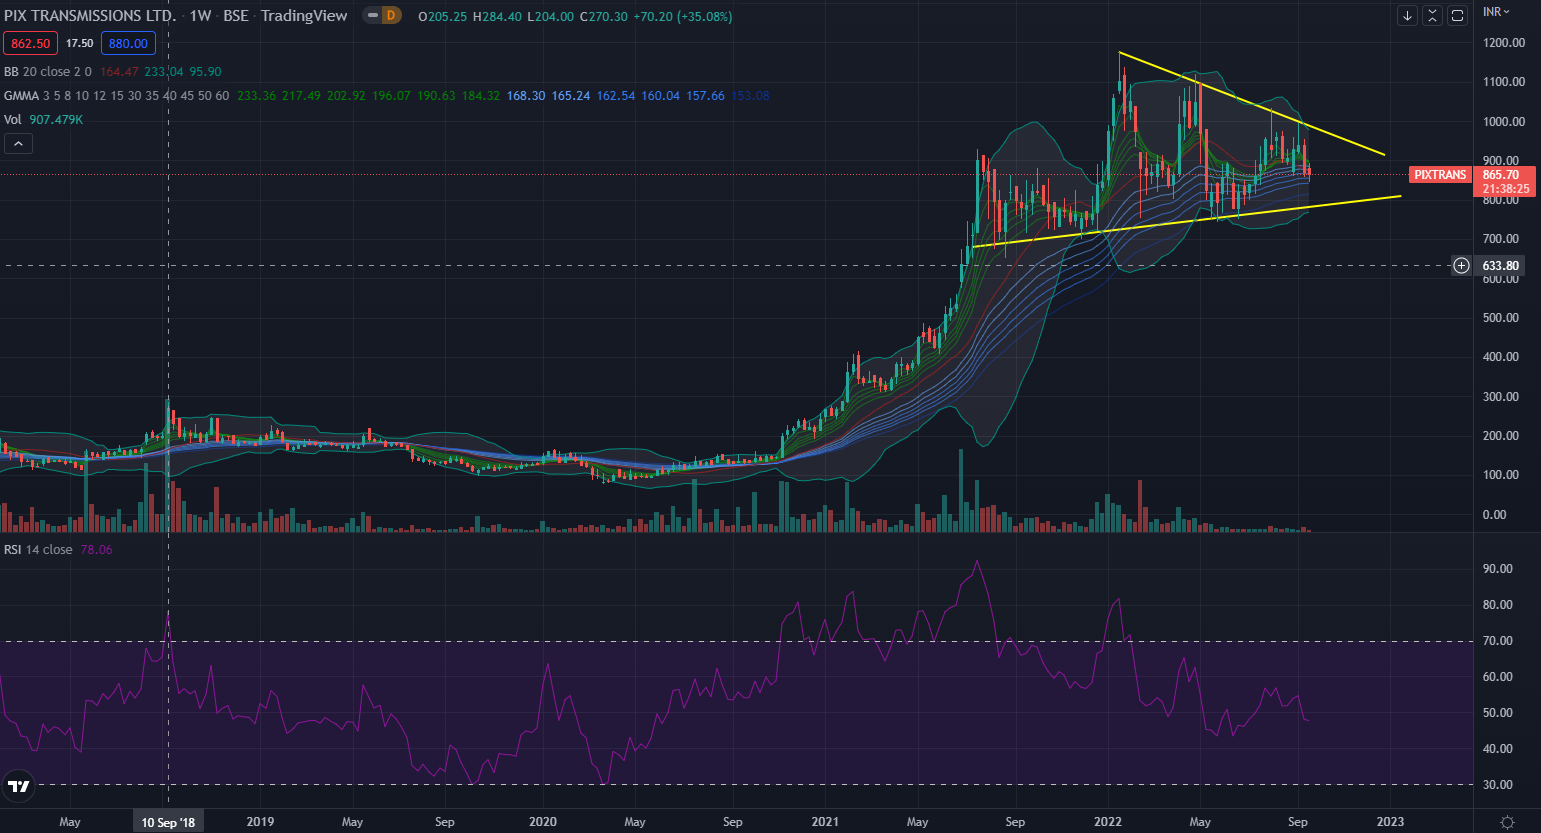
Pix transmission , weekly -
Pix has been in a symmetric triangular pattern since Jan 2022 ( Basically a consolidation pattern). Falling volumes towards the right of the image, point to a classic VCP pattern.
From a stage perspective, stage 1 looks over ( it got over when it peaked out in jan 2022) and stage 2 is ongoing.
Breakout on either side of this pattern should be a good indicator of the next trend ( Stage 3 fall or continuation of stage 1 )
From a guppy perspective, both long term ( blue ) and short term ( green) appear to be converging, confirming the consolidation .
[My take on how the market is viewing Pix ] : Pix is taking a pause as the expected capacity expansion benefits are just about to start trickling in towards the end of this year.
Something to be watched out is the impact of the upcoming US recession , given that the main growth driver for Pix is expected to be on the export side.
[Disc ] : Invested at current levels
7 Likes
@phreakv6, looks like the pattern didn’t play out. Do you still hold HOEC?
No I booked a loss on this after wasting a lot of time following the roller-coaster for few months. I had wanted to scale it aggressively after both B-80 wells came online - I did scale it a bit as well in June after the D2 gas well was brought online and was producing but that position got stopped out as my 10% stop got hit. Then I heard that they had to stop production due to issues in evacuating the oil which also gets produced with the gas in D2. D1 which is the Oil well still has issues and won’t get fixed for while. It has been plagued with lot of issues - turns out this is how Oil & Gas business is and I learnt it paying a fee and wasting some time. I still follow it closely though but no bets until clarity emerges.
13 Likes
Pix Trans
Well your assesment is right. It is taking pause and should consolidate between 650 to 800 levels.
Next support is lower line of BB which also coincides with lower line of the rising channel -between 750-60.
If it breaks further, it can go to 650 and beyond.
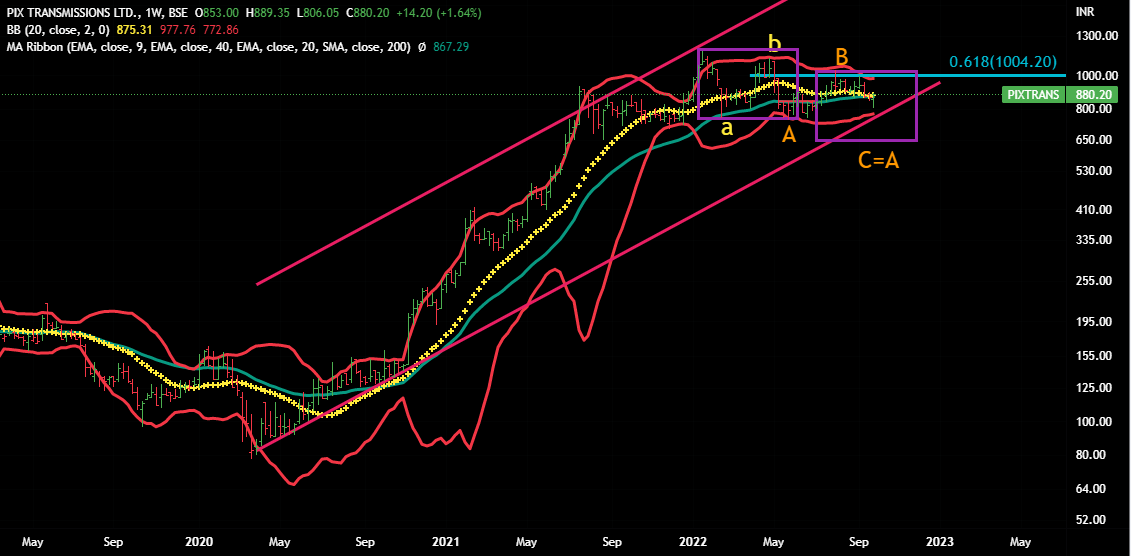
Disclaimer : These are probability studies based on historical-patterns study, can go completely wrong .
1 Like
GPIL
Respect deeply @phreakv6 understanding of stocks.
Was just studying GPIL - saw your 6 months old chart here. Hence sharing my views for your reveiw.(thanks in advance)
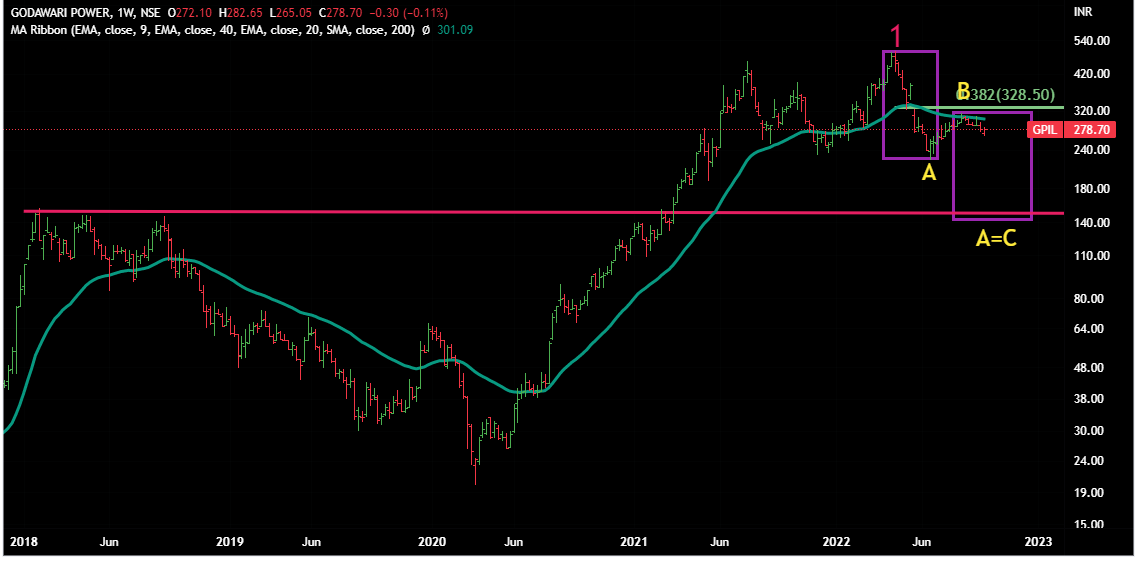
Our view is that GPIL can go to much lower levels from here.
It seems to be doing a Zig Zag correction.
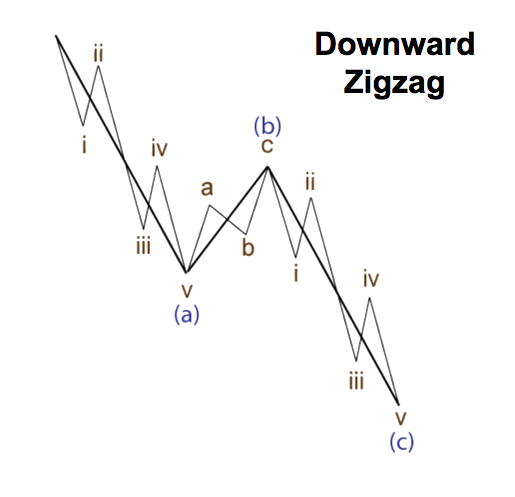
Wave A was clear 5 waves down and recent bear-market -rally bounceback was not even 38% at Fibo levels ( a sign of weakness).Another sign of weakness is that it could not close above 40 weeks moving average.So it completed 5 waves in A, retraced in B and it should do 5 waves in C as per Zig Zag pattern.
Seems that it should go to near 220 in coming weeks that is where A ended and it also coincides with lower BB line.
Little further it can go 210 that is 40 months moving average . BB and moving averages are moving targets as they keep going up and down alongwith the price movement.
If it does not stop there (worst case scenario ) then it can go to 2018 high - where A=C .
Overall it does not any confidence.Look forward to your views.
Disclaimer :These are probability studies, can go wrong.
AURIONPRO - ATH all time high Monthly closing
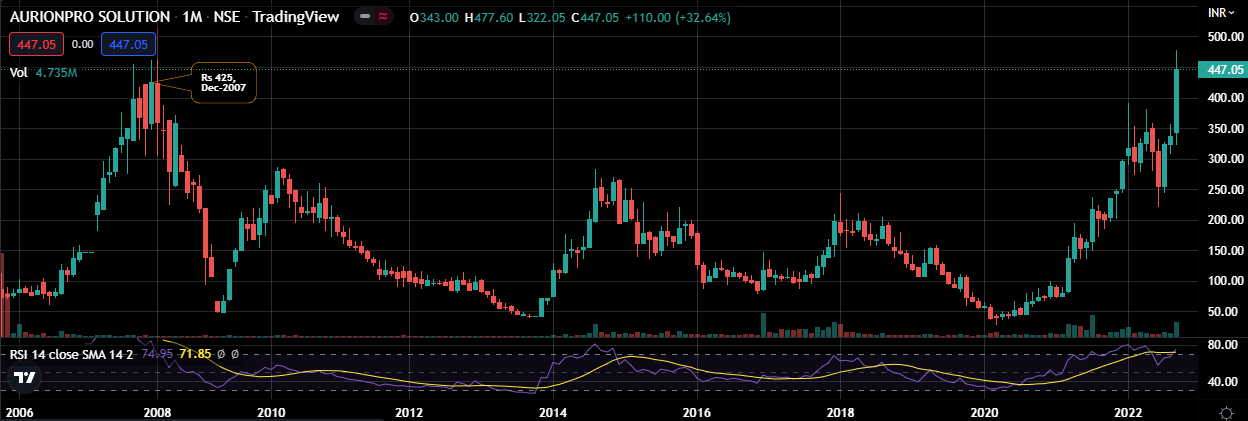
Fundamental
Annual Revenue Rs 500 Cr
Market Capitalization Rs 1000Cr
3Y Revenue growth flat
PE 13
RoCE 22%
OPM 22%
NPM 15%
3 Likes
@StageInvesting - I only know and use trendlines (support & resistance) along with RSI and MACD. I don’t like GPIL chart much and I too think it can breakdown. Looking solely at the chart, it looks like 150 levels is where the support is (2018 top + 50 Month MA), but then this is trading at 3x earnings fundamentally and that’s where I wouldn’t know what to do.
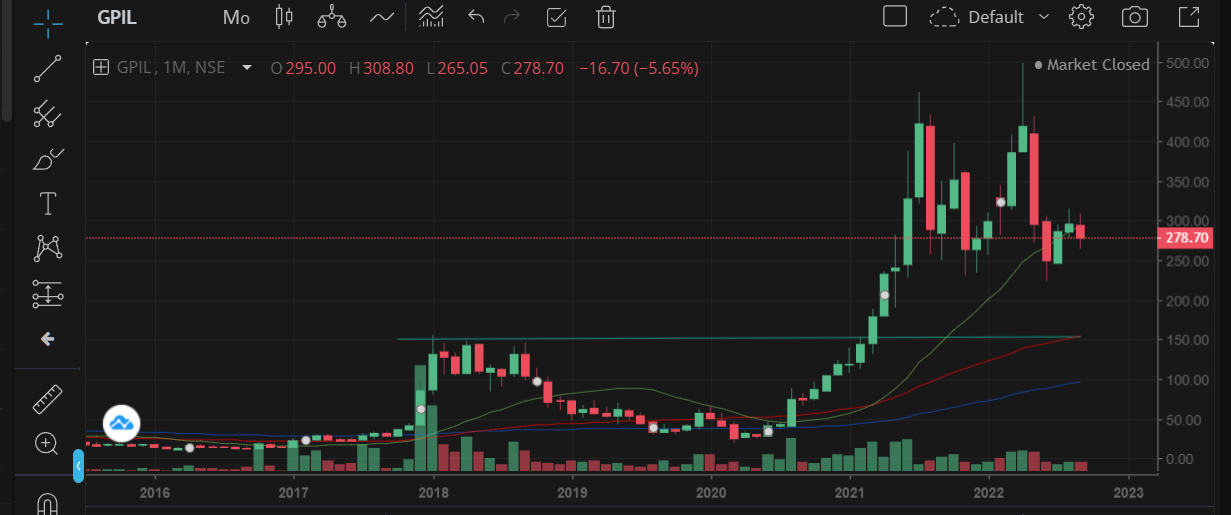
I can’t bet on something going to 1.5x or so earnings from 3x (though such things do happen in cyclicals as it did in Graphite India). I was looking to go long on this if it held 300 levels and if macro factors were in favor. But now with slowing global growth and strengthening dollar, commodities will be weak in general - which means going long is betting against the tide. Also the Steel capacity China has built will hit the world if they can’t find viable absorption with the country. It could work out very well for us if that’s the case as a country but Steel makers will go back to their sub 20% EBITDA margins pre-Covid. Overall I think likely-hood of this going sideways with a downward bias is high even if it doesn’t breakdown overnight.
Disc: Had an earlier trade and exited GPIL around 450 levels.
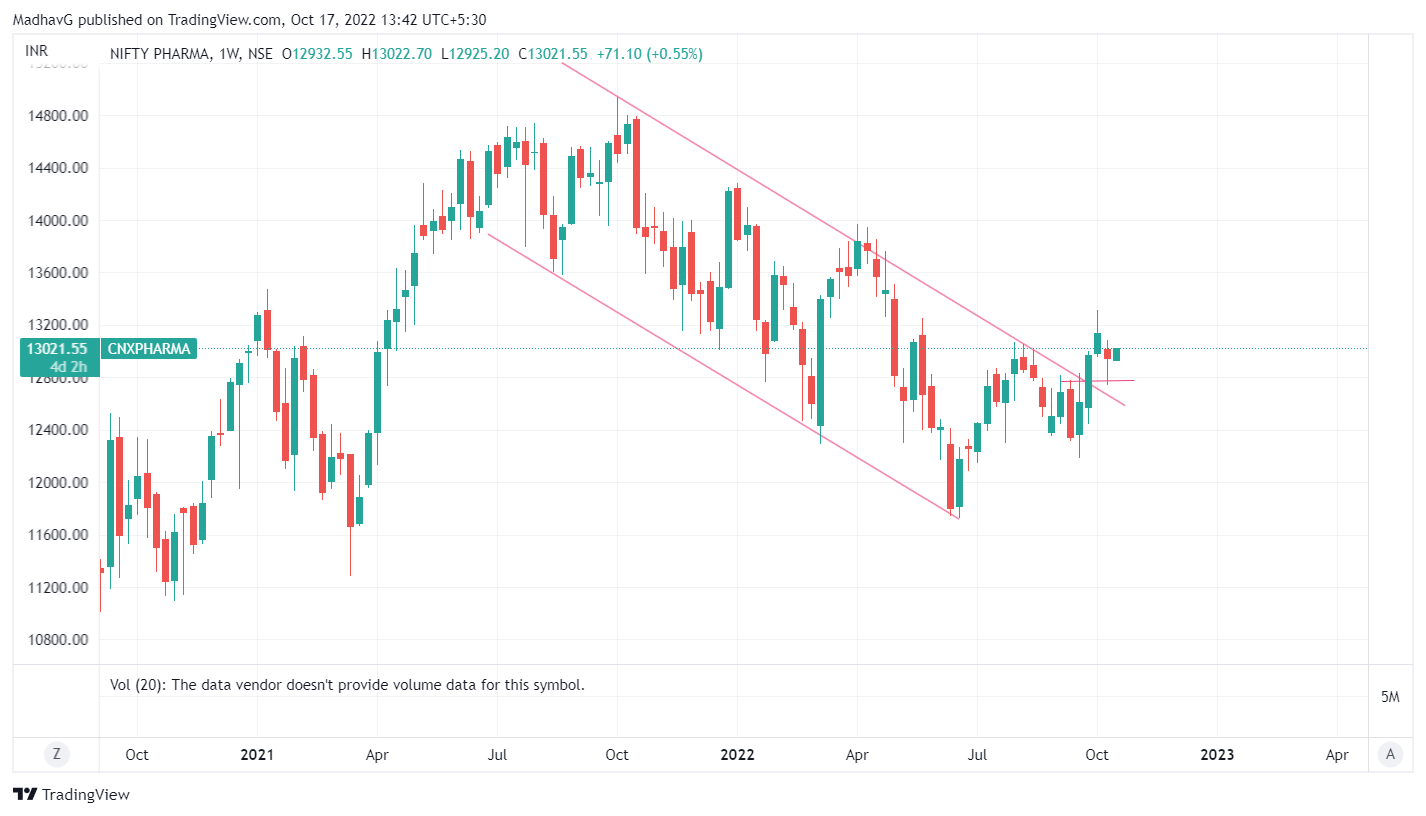
Some updates (No change in views and no trades in the month)
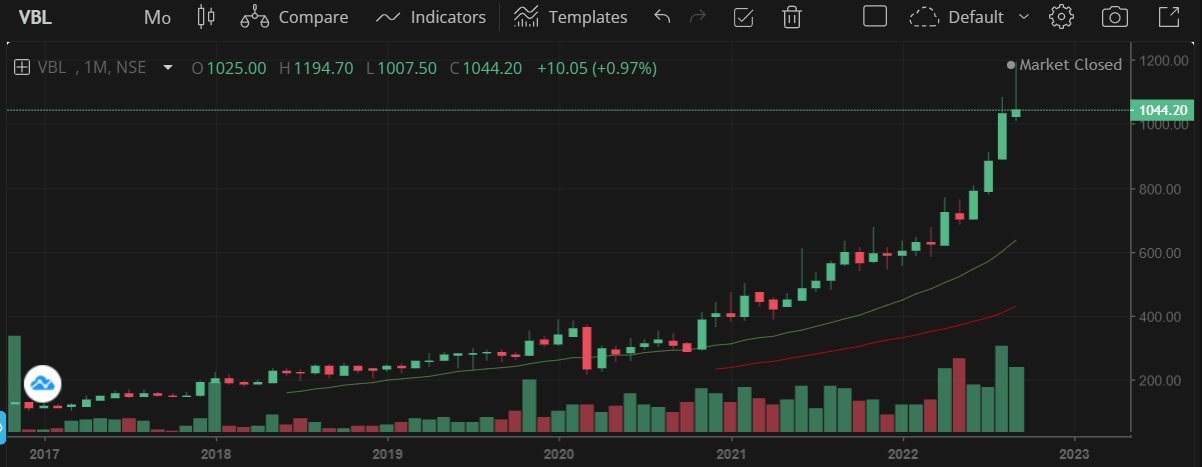
VBL - Probably the weakest of the lot although it started the month the strongest but retraced and lost most of the gains. I suspect there is FII selling here leading to weakness but its trading at 50x earnings with stellar growth (20% sales and 123% profits - 3 Yr CAGR) and is probably the cheapest of the stocks I own ![]() so in no hurry to do anything. Seasonally weak quarters are ahead though as summer has passed so might be the reason?
so in no hurry to do anything. Seasonally weak quarters are ahead though as summer has passed so might be the reason?
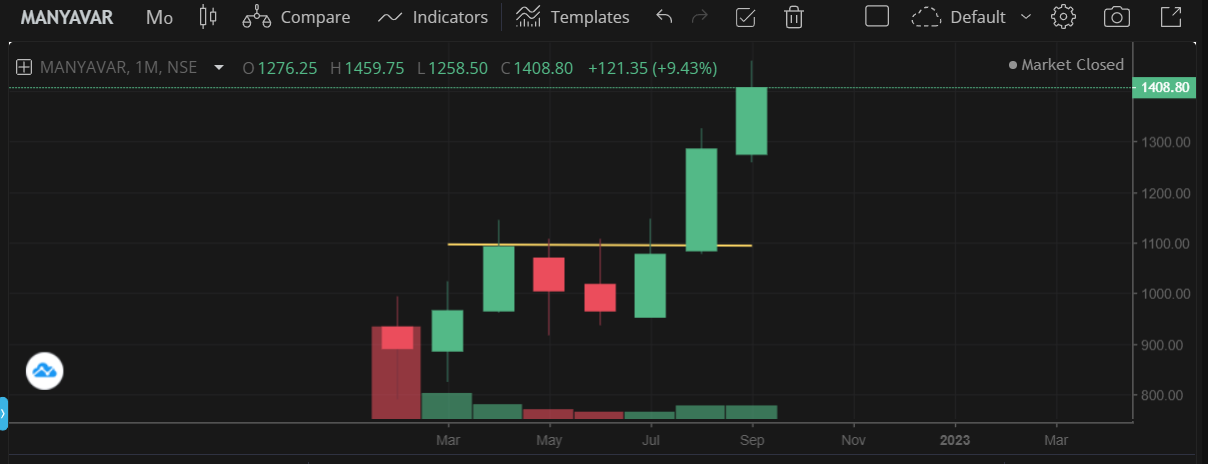
Manyavar - Strong chart has built one more strong month. Fundamentally I think this business should do well with the discretionary spends. Started a thread on the business. Festive season should aid sales and hopefully these earnings multiples will sustain
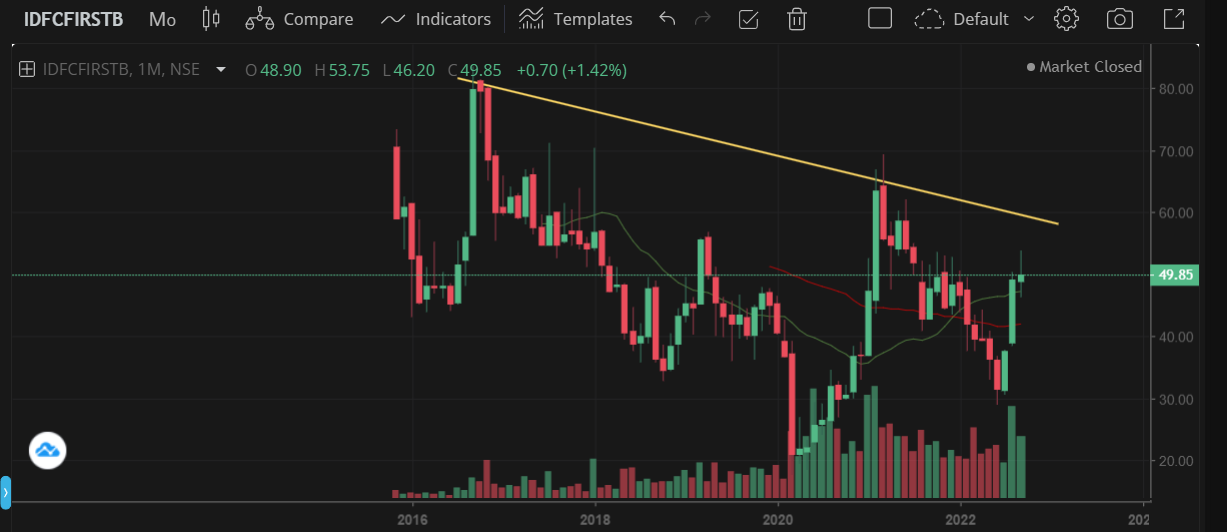
IDFC First Bank - Another weak performer for the month, though this too like VBL ended the month in green but unlike VBL which started strong and ended weak, this one picked itself up to close strongly. Results on 22nd and if the numbers am seeing on the economy are anything to go by, I think we should see a similar quarter as the last one in terms of most metrics. Technically I think it could test the trendline around 60 levels if results are strong and if there is steam can break it in the next month. Hoping for a re-test of ATHs of 80 levels here by end of year.
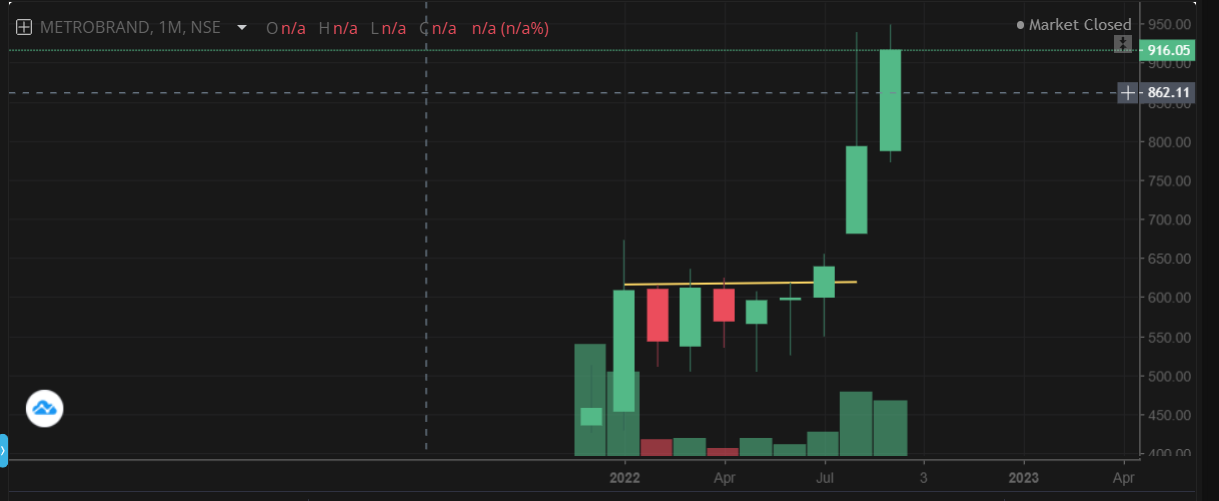
Metro Brands - Probably the best performer alongside Manyavar. I think its trading cheap relative to Campus and that differential should narrow in the coming months. Festive season should be a big plus here as well
Devyani - Tested 200 levels intraday during the month but it could take some more consolidation to take 200 out convincingly after Dunearn’s 2.6 Cr share supply hit the market in August. I suspect most of it is absorbed and there hasn’t been a price weakness that would take it under 185 levels.

Even NR Agarwal and HBL Power which make up large part of the tail allocation have closed the month strongly so overall good month despite all the noise and volatility. I think monthly charts help provide direction during these volatile times.
Some additional data that seems to support domestic consumption is found in RBI’s payments and settlements data
It looks like UPI Q2 FY '22 vs Q2 FY '21 is 32 lakh crore vs 19 lakh crore - which is up 68% YoY. We can’t read much into this data as it includes P2P transfers as well alongside P2M and UPI itself has been gaining market share but it does show a very healthy economy.
Credit Card + Debit Card spends at PoS and e-Commerce as well is up 28% from 3.35 lakh crore to 4.3 lakh crore. I think this is a stronger indicator for consumption plays I am interested in above. Within this, Credit Cards are up from 1.79 lakh crore to 2.74 lakh crore - a 51% increase. This might be indicative of a larger credit uptake and could be a positive for all financials including IDFC First Bank.
(If the charts look different from usual, its because I am trying Tradingview instead of ChartIQ in Zerodha for a change.)
Disc: Have positions in all these as disclosed earlier.
35 Likes