
would you mind to share your invention with vp community
1 Like
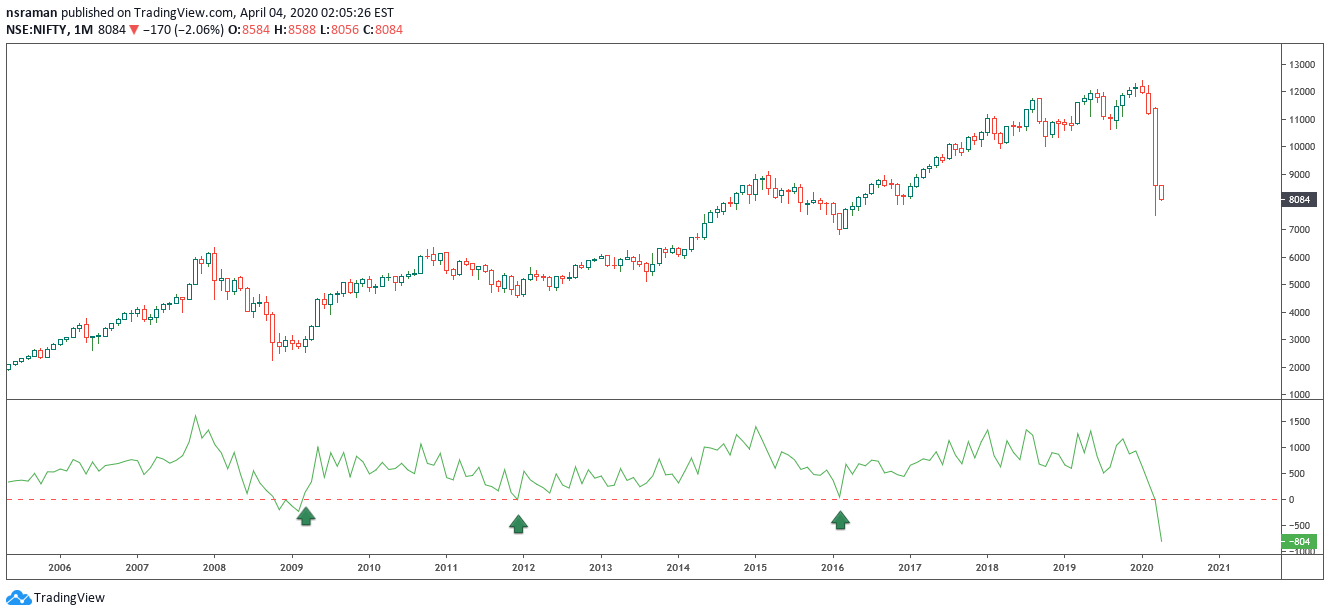
This is my 2 cents for the Index Nifty. Please refer the chart. The Line is below zero. Now it has to cross zero and a possible retest will establish the low for Nifty Till then fingers crossed. If you look at the slant of the line now - it is very steep. Going by the velocity of the fall, one can expect a V shaped recovery???. Comparing the past patterns but that is not a surety for the future but only a probability.
1 Like
Here I’m watching that another Bollinger band median kind of indicator is missing. apart from that if I compare with earlier charts then ur proprietary indicator need to reverse fast then the price will follow & confirmation will come if this indicator sustains zero line. You are the best person to explain it.
yes. I have omitted the top indicator which you are mentioning as the focus is on now on lower one. In what way it will behave I don’t know but please note it is on the monthly time frame.
My initial investment is in ajanta pharma. All longs need to be cautious and have sl as Nifty bottom is yet to establish. I am putting this as an example to study how the system works and it is not a buy recommendation from my side. Will update as and when things unfold.

2 Likes
2 Likes
https://in.tradingview.com/chart/wueoSL7B/
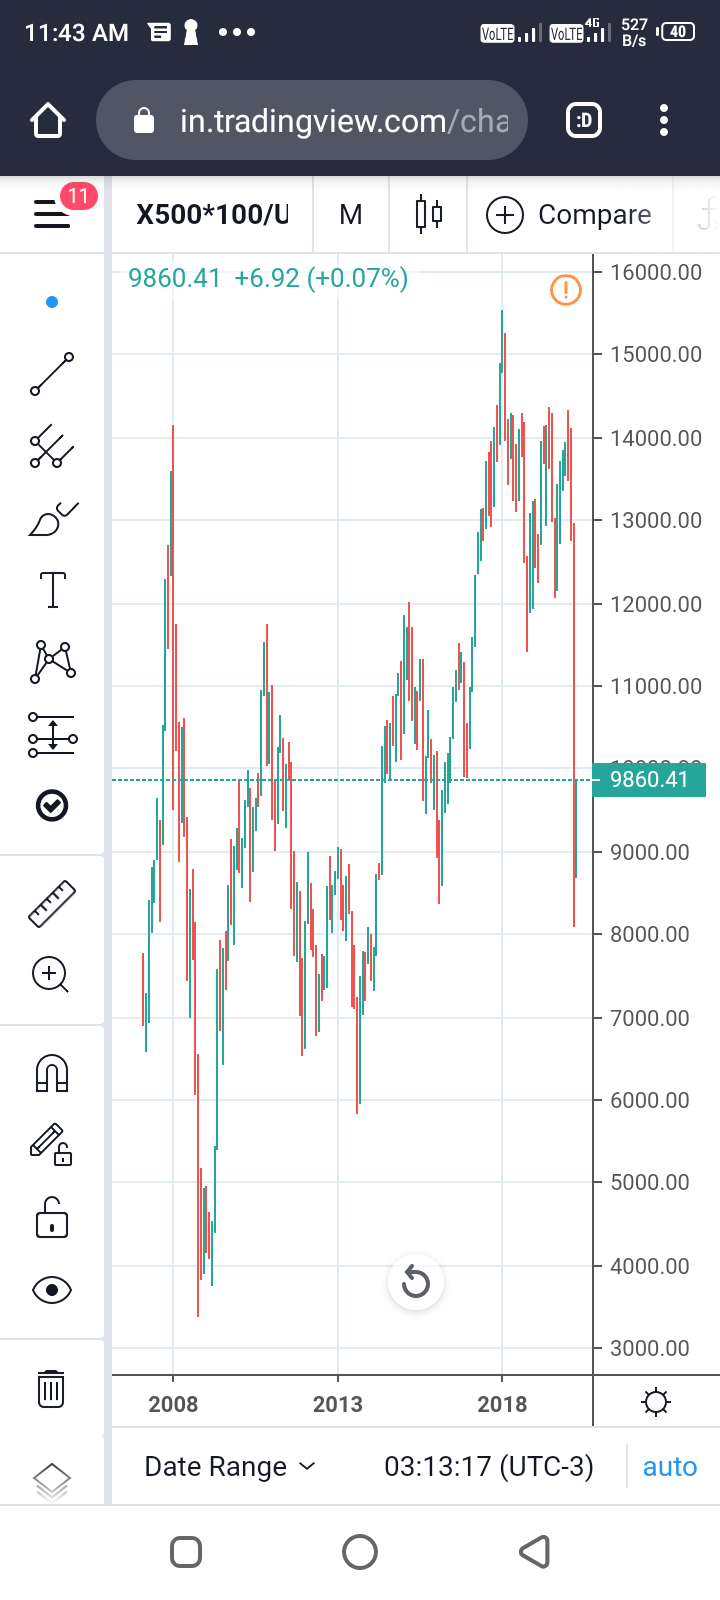
This is cnx500 in USD terms. (CNX500 * 100/ usdinr)
In 2009, Indian gdp was $1.19 trillion. 2019 it is Arnd $2.9 trillion.
Gives us a fair comparison of mcap to gdp ratio.
2 Likes
Well, prices roared back into the uptrending channel of 2008 giving an unconfirmed indication that it may have been a false breakout on the downside. Confirmation of the same will happen after prices test and higher highs and lows are created.
Already we have seen a higher high and a higher low on the daily ( but that was outside the channel except the last high which took prices into the channel after prices retraced to 61.8%). If the level of 9583 is taken out which is what an ABC type movement would normally take the prices to in a regular market, then i think we can expect a good market rally. If not then i would expect the market to resume its downtrend.
1 Like
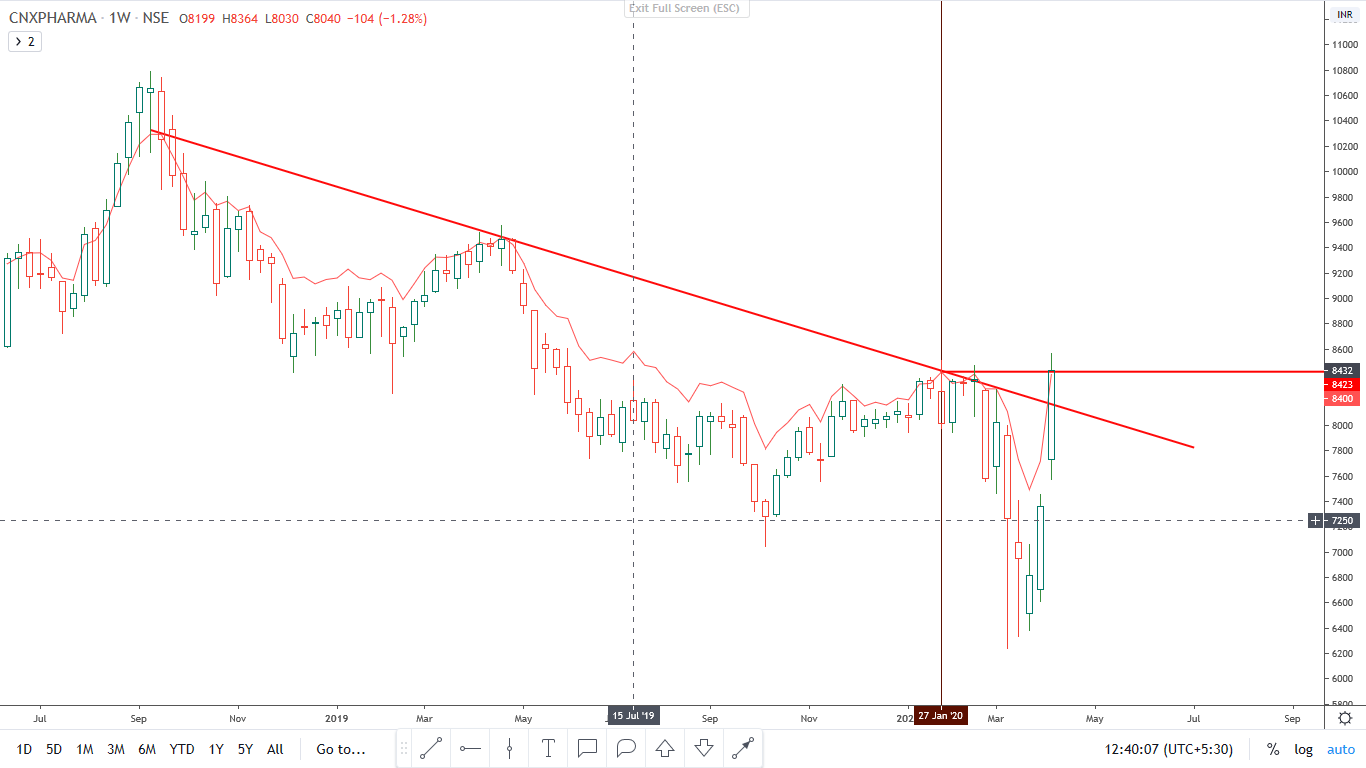
Pharma is a good buy now in dips for long term when the Index comes to 8200-8000. I feel both technical and fundamental factors are aligning.
3 Likes
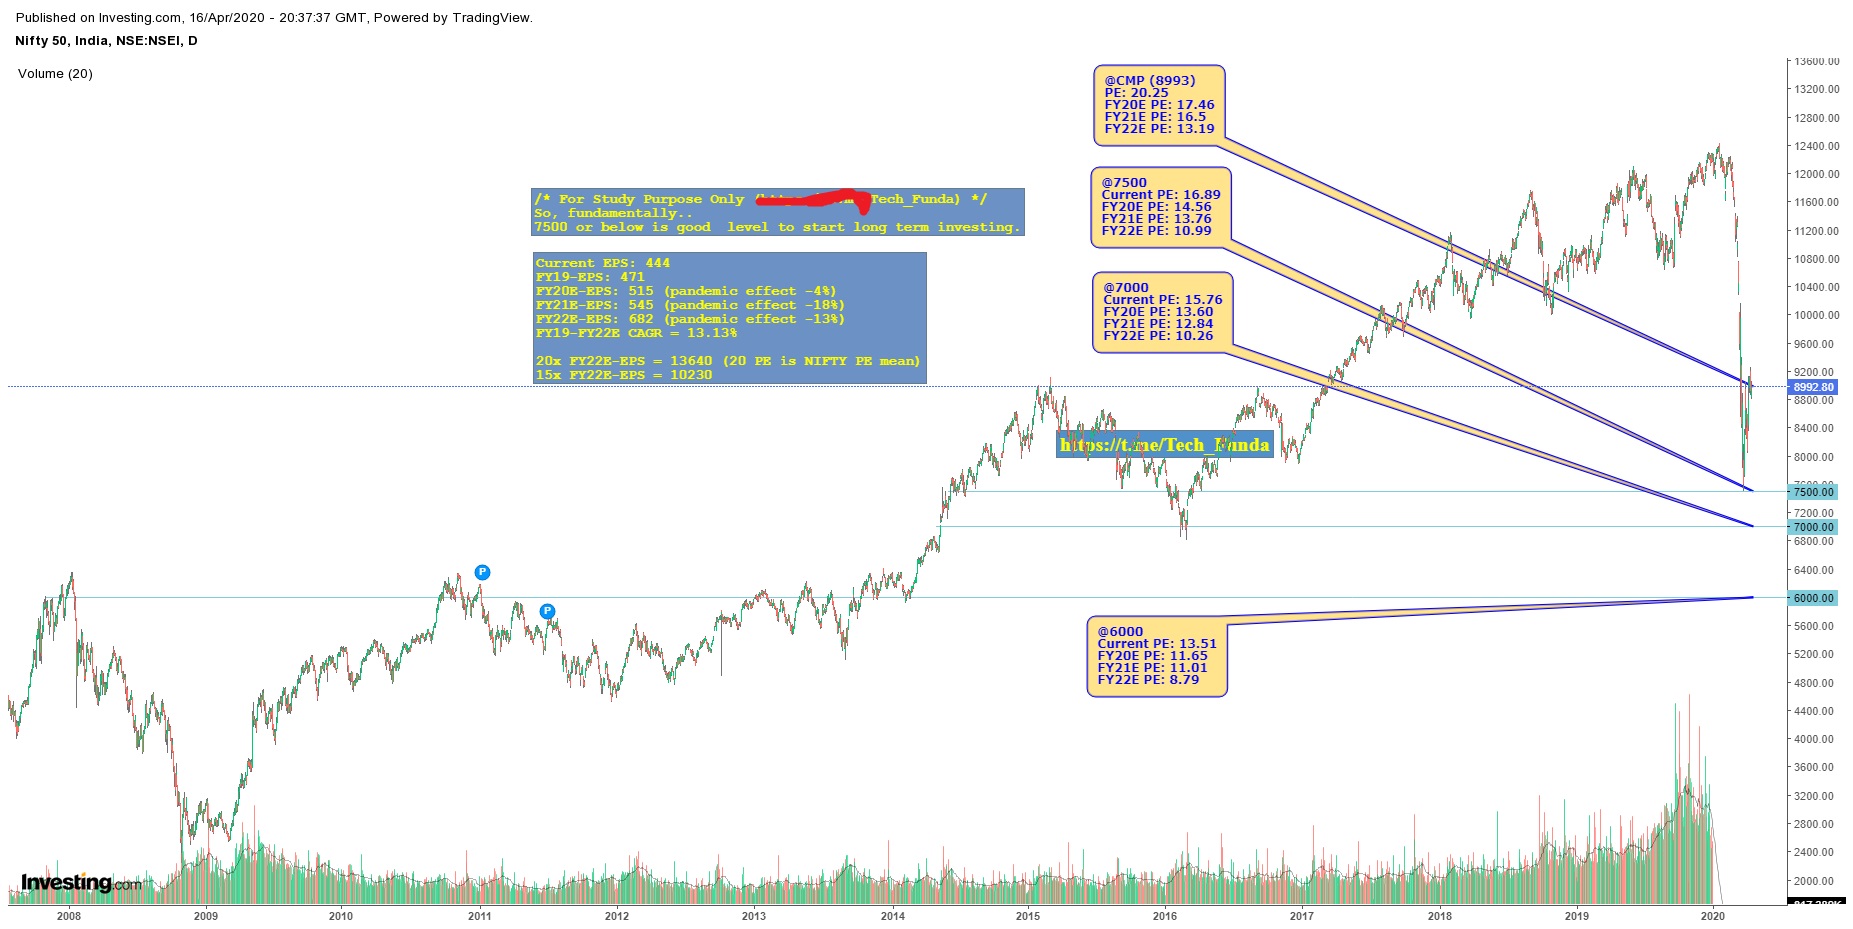
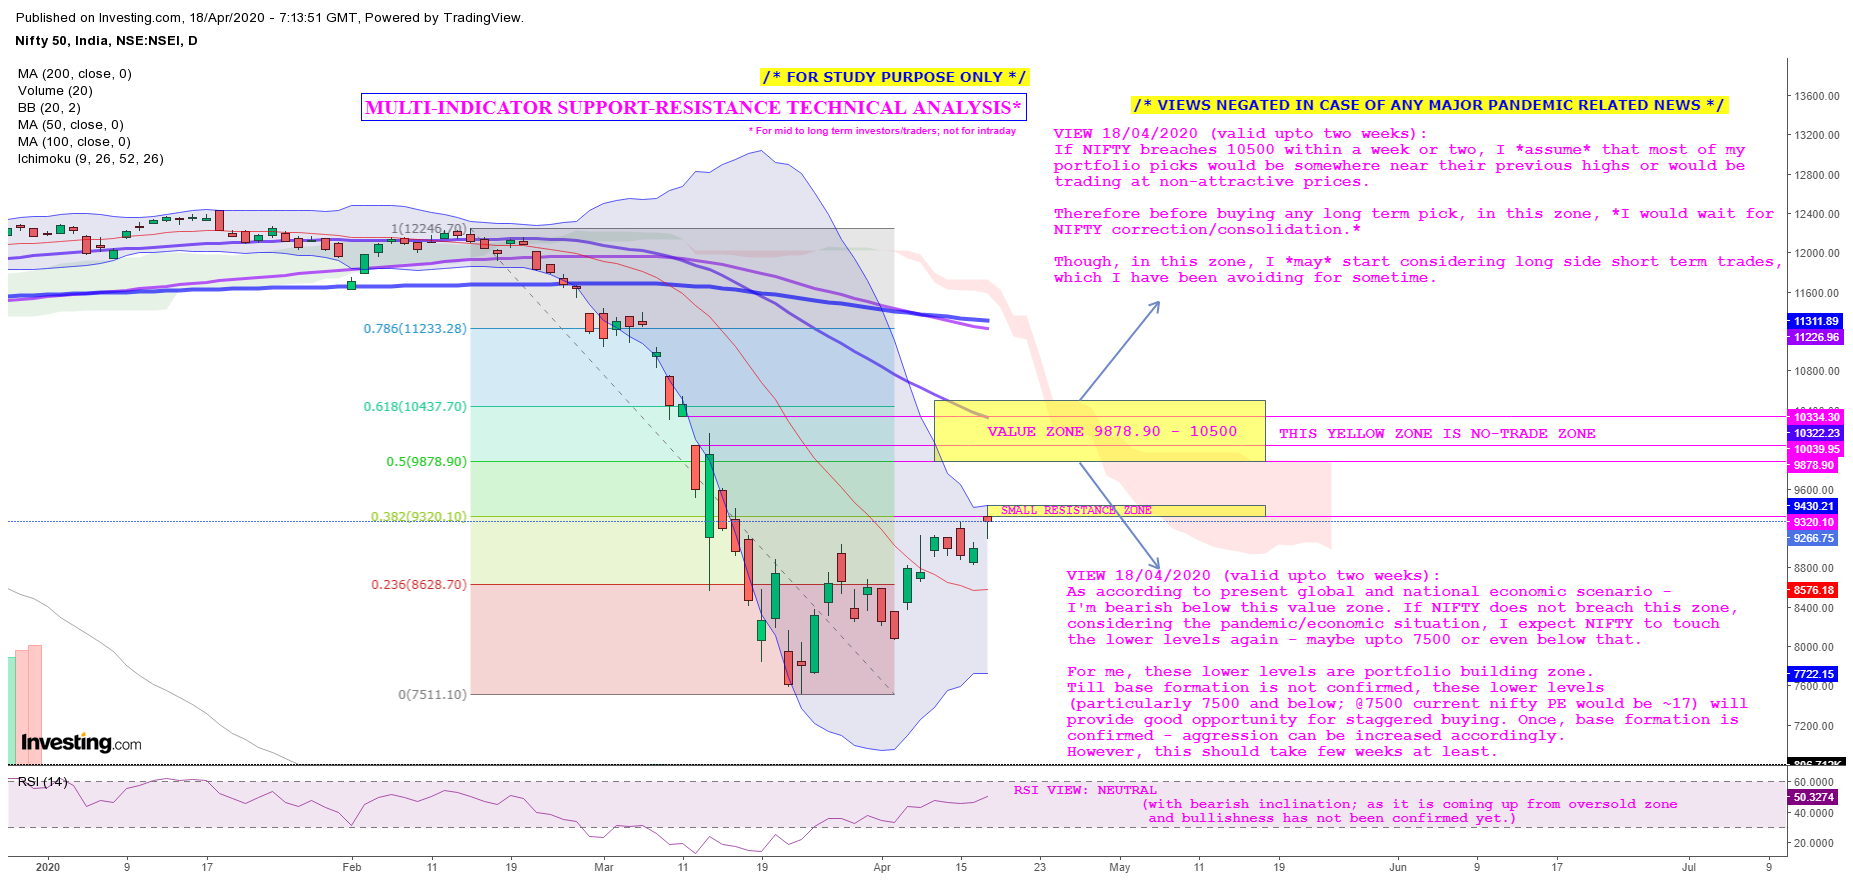
If a picture is worth a thousand words, here’s my two-thousand word NIFTY analysis. ![]()
First one is NIFTY PE and Forward PE depiction on NIFTY (D) chart and the second one is multi-indicator technical analysis with my views. I hope, its useful for all.
9 Likes
Thyrocare - Looks poised for a breakout on the daily. There was decent volume as well on Friday near the resistance trendline. The volume still looks dwarfed against the two days from March when Nalanda increased their stake. Fundamentally has been doing very well pre-Covid. Unsure how the numbers will be post. Has re-tested this trendline multiple times as well recently and has consolidated close to it, which shows strength.
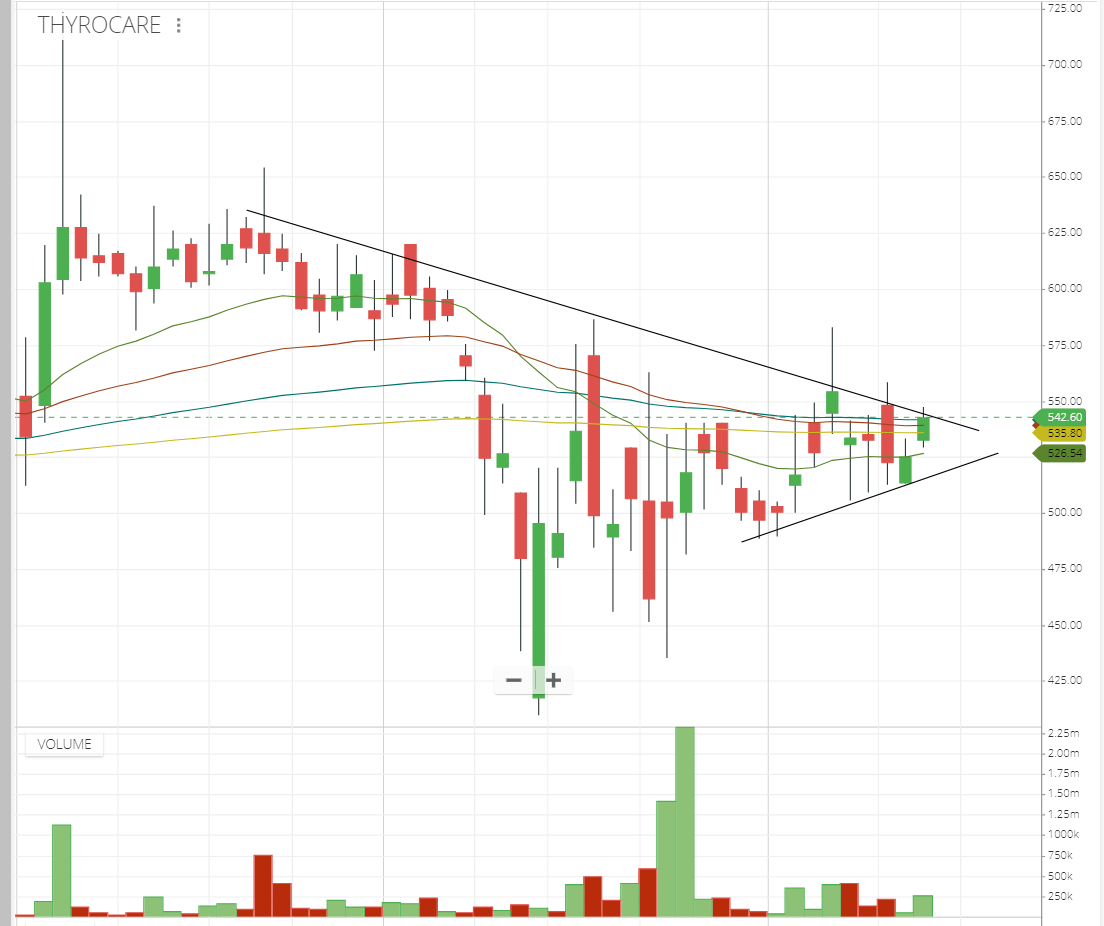
Disc: Invested
4 Likes
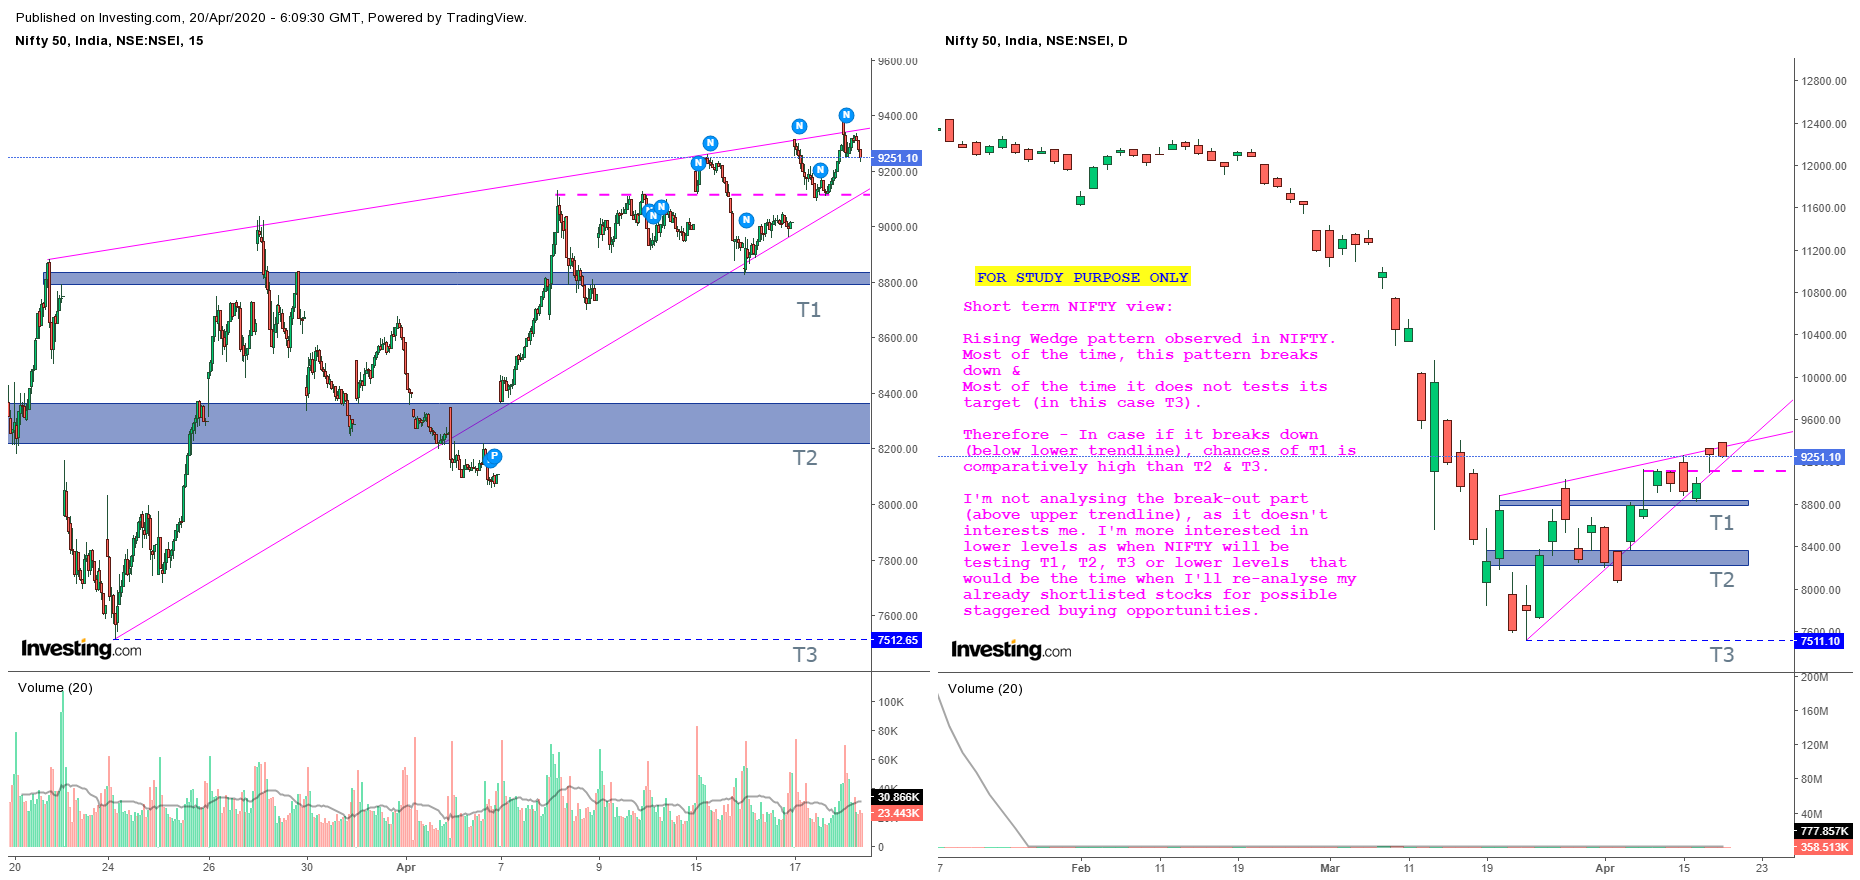
Short term NIFTY view: Rising Wedge pattern observed in NIFTY.
Most of the time, this pattern breaks down &
Most of the time it does not tests its target (in this case target is T3).
Therefore - In case if it breaks down (below lower trendline), chances of testing T1 is comparatively higher than T2 & T3 being less chance.
NOTE: I’ve not analysed the break-out part (above upper trendline), as it doesn’t interests me. I’m more interested in lower levels as when NIFTY will be testing T1, T2, T3 or even lower levels. When NIFTY will test these levels - that would be the time when I’ll re-analyse my already shortlisted stocks for possible staggered buying opportunities.
Hope, it helps! ![]()
7 Likes
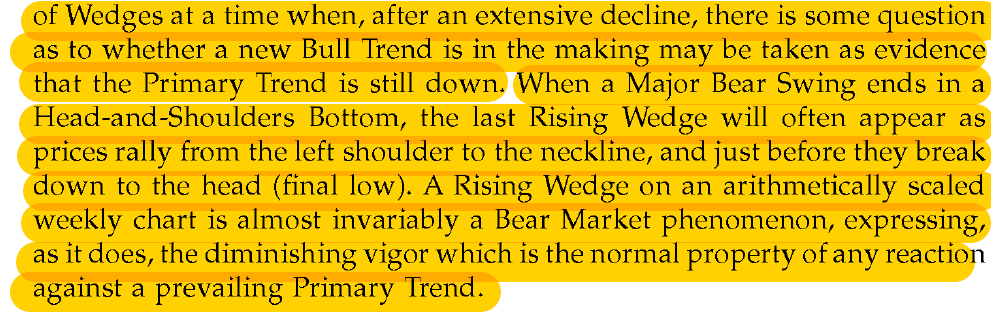
Yeah, true…saw this in book technical analysis of fin trends…

I feel that T2 should be achieved as per your chart and a up move should start from there…8590 is 20 dma…
9 Likes
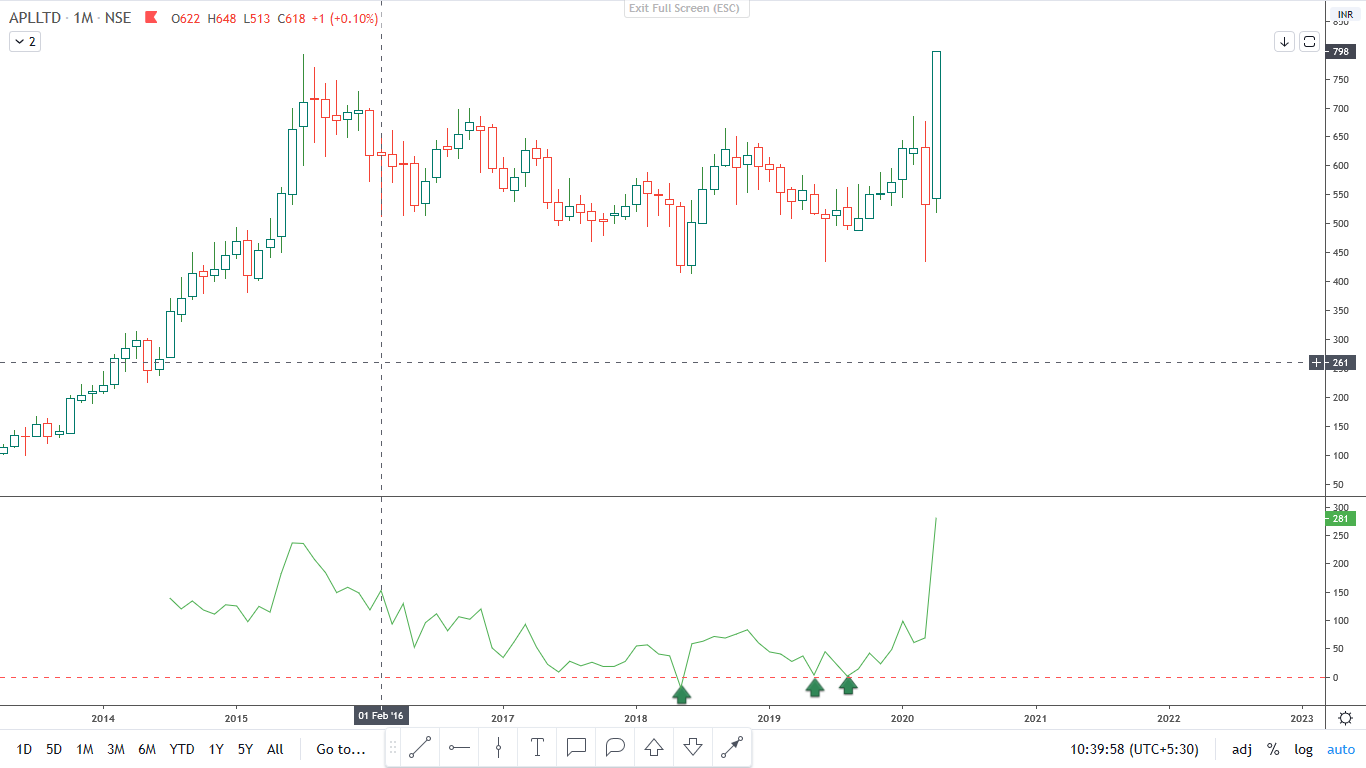
Alembic Pharma - Flag breakout on the monthly. This is a nearly 10 year chart, where the consolidation part has gone on for nearly 5 years.There is support with volumes, valuation (well below median valuations) and fundamentals (great numbers consistently last several quarters) as well.
Disc: Invested
10 Likes
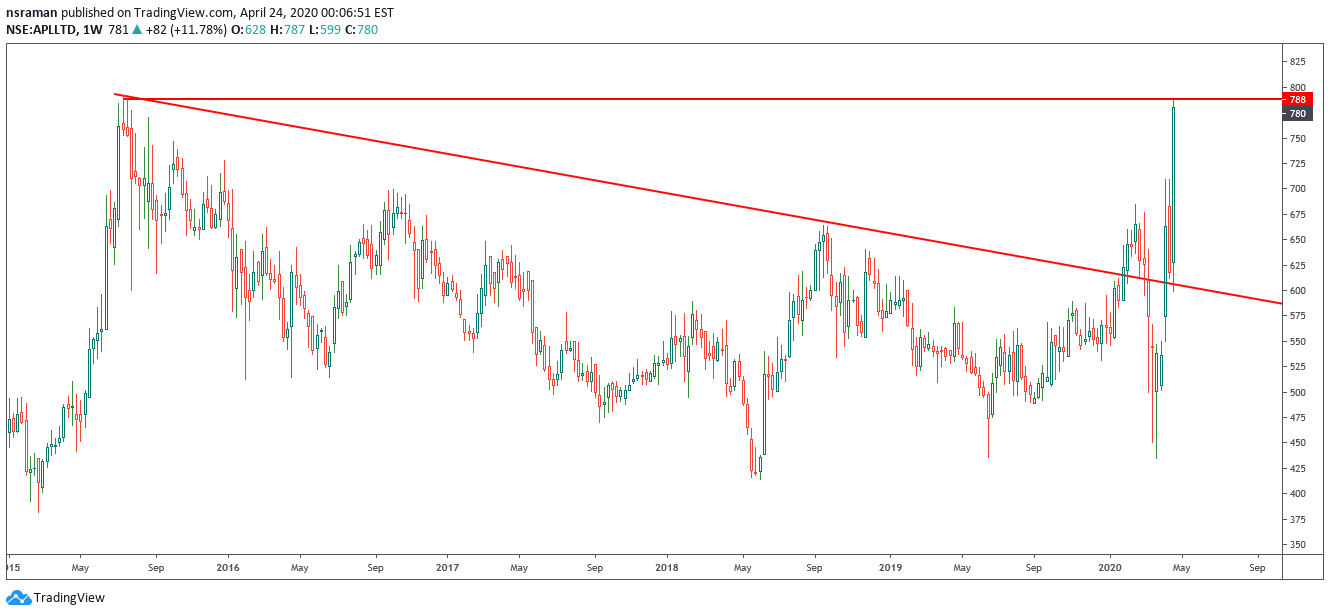
This the Five year Chart I am not seeing any BO on Five year scale. It is on a five year High now. Right time to get out
3 Likes
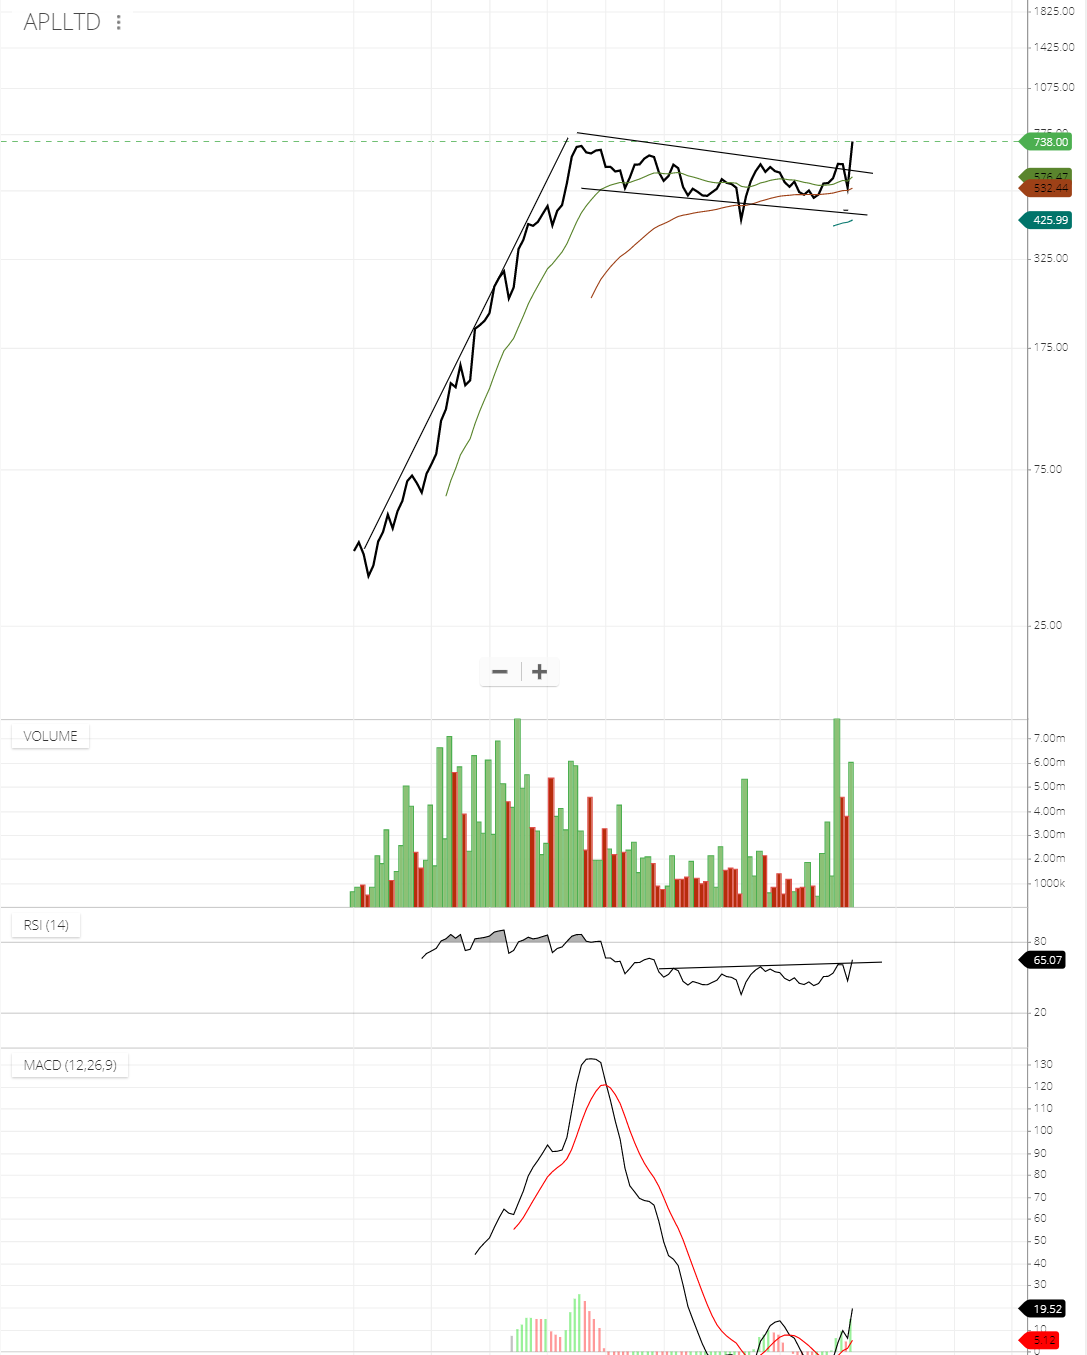
This is another chart I follow for my LT Investments. You can see examples above. I have market where and all I have invested in alembic. Will monitor closely now as it is a bear market.
1 Like
@sethufan…What is LTL divergence? As a long term investor how this indicator can be use in Bear Market?
I think a lot has changed in the last 5 years top - P/E then was close to 50, while now it is about 17 (after today’s runup). Earnigns of the company is up about 3x but market has ignored this as a one-off due to Sartans for sometime now but a string of one-offs can make market update its opinion. Recent Earnings reports are already baking this in (as compared to reports from last quarter). Lockdown impact is less, guidance is good as well and pharma is the flavor of the season - all this has to be considered too.
As for not using 780 levels as high for the breakout, I generally use closing prices for breakout when using long-term charts like monthly, weekly - Reason is the psychology behind the technicals - I doubt people who bought it at 2015 top are still holding it. It is this that causes resistances to build. But here I doubt if that will be the case. Maybe I am selectively building a case because of my bias, but I have generally always consider closing prices.
To me this looks like IPCA at 1000 levels post numbers where market suddenly sat up and took notice. Hoping same thing happens. If not, well thats OK too.
9 Likes
Moderator can delete this post.If I am wrong.
@sethufan Is it not quite easy to say “I’ve bought/sold on or just before the reversal” after plotting some Indicator (which people doesn’t know).
Here is some query
1)what will happen on price if your indicator remain below ‘0’ line for few days/week/month & the vice-versa??.
Though you don’t have the set up any sell zone like your buy zone.Then
2) What giving you the idea to sell??
In my view this forum is all about the sharing of knowledge where lot of stalwarts sharing their deep dive finding without any hesitation but somehow you are not ready to share which you are posting.
Last philosophical word “try to share knowledge on curiosity or if anyone wants to learn/know from you. Sharing your idea won’t harm you rather you will get multiples of it by some immaterial thing which is priceless”
Not tried to hurt you. Pls don’t mind
6 Likes
Hi I agree with you. I can only show this as my hands are tied. Hereafter , I will stop posting this. You are right there is no point in posting this . I am posting this only to give a view. May be I should have refrained from saying I bought this. You see my Nifty chart warned guys well before this fall. I think I will do like that instead of disclosing positions.
2 Likes