
That high P/e can be comparable to 52 of Infy in 2000. Those due to euphoria. PE contraction will always happen in every sector after initial euphoria. I don’t think Infy has reached that pe anytime after that. Same thing will happen here also.
3 Likes
Hi,
I am a newbie in technical analysis. Does the Alembic daily chart fit the cup and handle pattern?
Seems u r trying to say about this post but if I go through the chart here I am not getting any significant message neither from the chart nor from your words. Even your LTL(proprietary) indicator is also missing here.
From my last10 yr experience on various instruments around the globe I must say any indicator doesn’t predict the future of price.
In a single line.“price doesn’t follow the Indicator rather Indicator follows the price” Indicator can only increase the conviction of trend.Only price can (few candles specially some strong reversal candles can give early I dication)give confirmation. May be I am wrong but it’s my view.
3 Likes
Alembic pharma:
One thing I am noticing for the last few days is that Moneycontrol has been consistently highlighting that Alembic pharma rose this much percentage points today… one should be careful as some big daddy might exit at higher levels in Alembic pharma… Usually I stay away from the stock which is being advertised by one of the most visited platforms in the stock market domain…
Disc: not invested
3 Likes
Buddy the charts and indicators are only as good as the person looking at them.
If you got nothing from the charts, the reason is maybe you havnt asked enough questions or simply chosen conclude TA is a fools errand.
TA is not be all end all of picking a buying or selling price but it is a tool which can help you time your entries better into scrips weather long term or short.
If I can devise a system which helps me 6-7 times out of 10 save me 10% or makes me 10% more, surely its better than having no system at all. My system doesnt have to be spot on but any savings I make will be well earned.
3 Likes
Well said. TA shows the path of least resistance. If somebody thinks he can capture the movements by a Chart he is at fault. One cannot capture the complicated world of Investing and Trading by lines/Chart.
1 Like
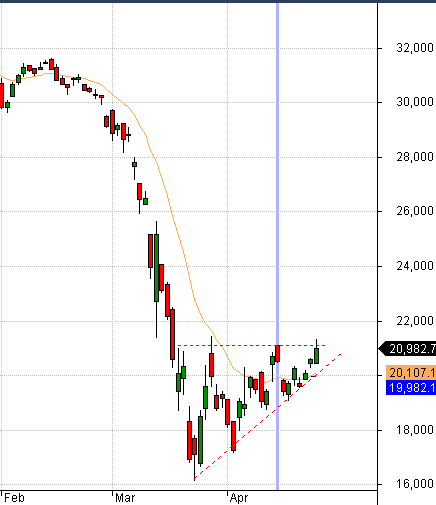
BankNifty has formed a strong pattern.
But Nifty is threatening a breakout…
Case 1: Nifty is at a strong resistance, and goes back down, then this breakout will have failed.
Case 2: BankNifty joins the bulls, and it too breaks out.
I think the coming days are going to decide the short term trend. There are wide gaps on the Nifty chart on the lower side… notably:
8083 to 8446
8748 to 8973 (partially filled)
It is likely that the bulls have run their course, and its time for the bears to show their presence. This pattern breakout will decide. Any international bad news is likely to motivate the price to fill the gaps.
Note: I am holding a trading position that is currently Delta Neutral (Long NF, Short CEs)
2 Likes
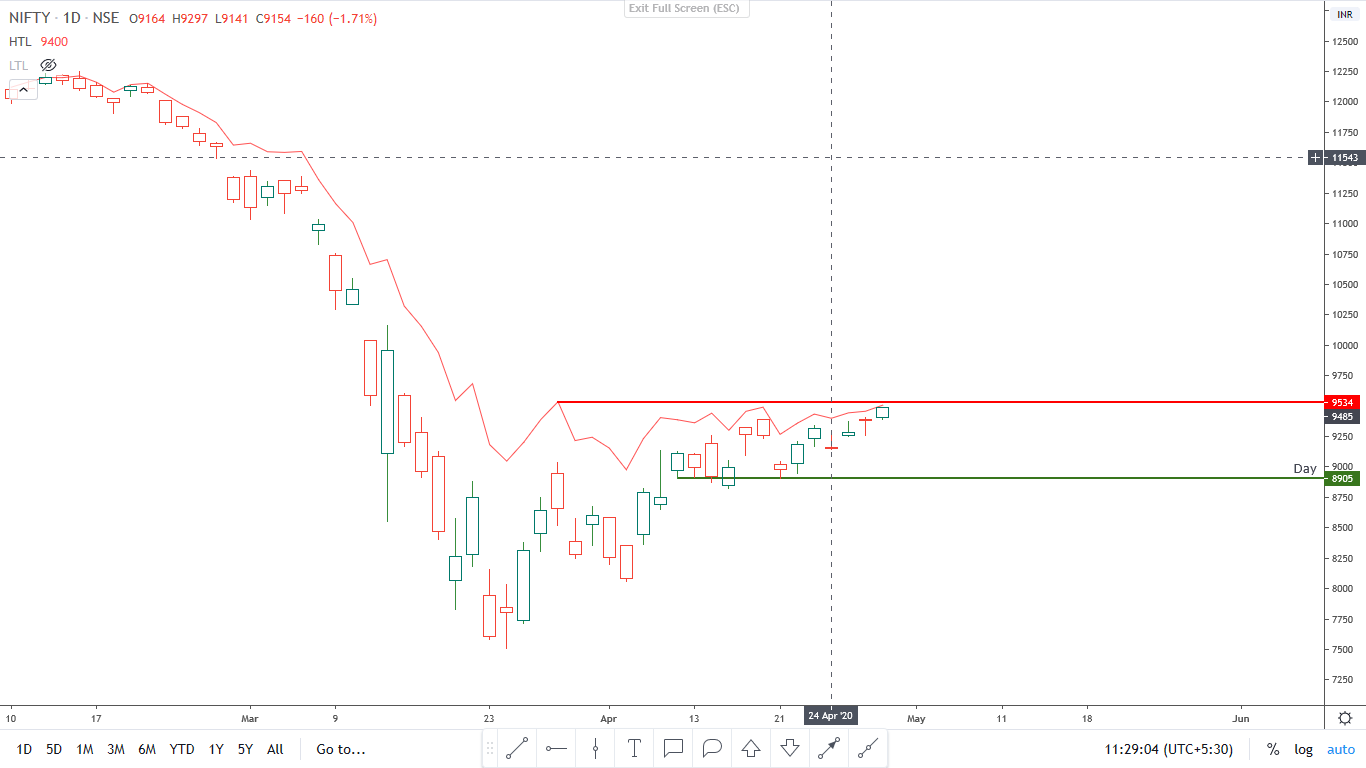
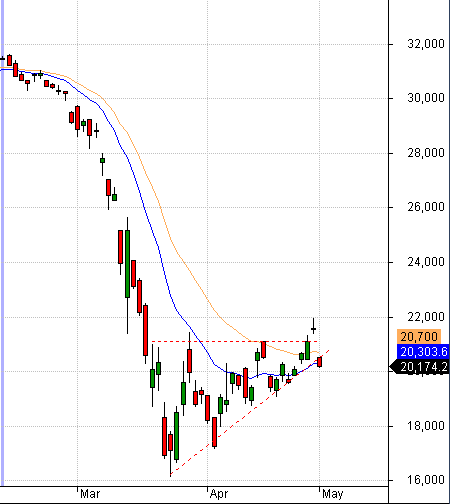
Pl see the attached charts. Lets see whether Both sustain above the red lines, Sustaining above lines is very important now. Otherwise , the downtrend starts
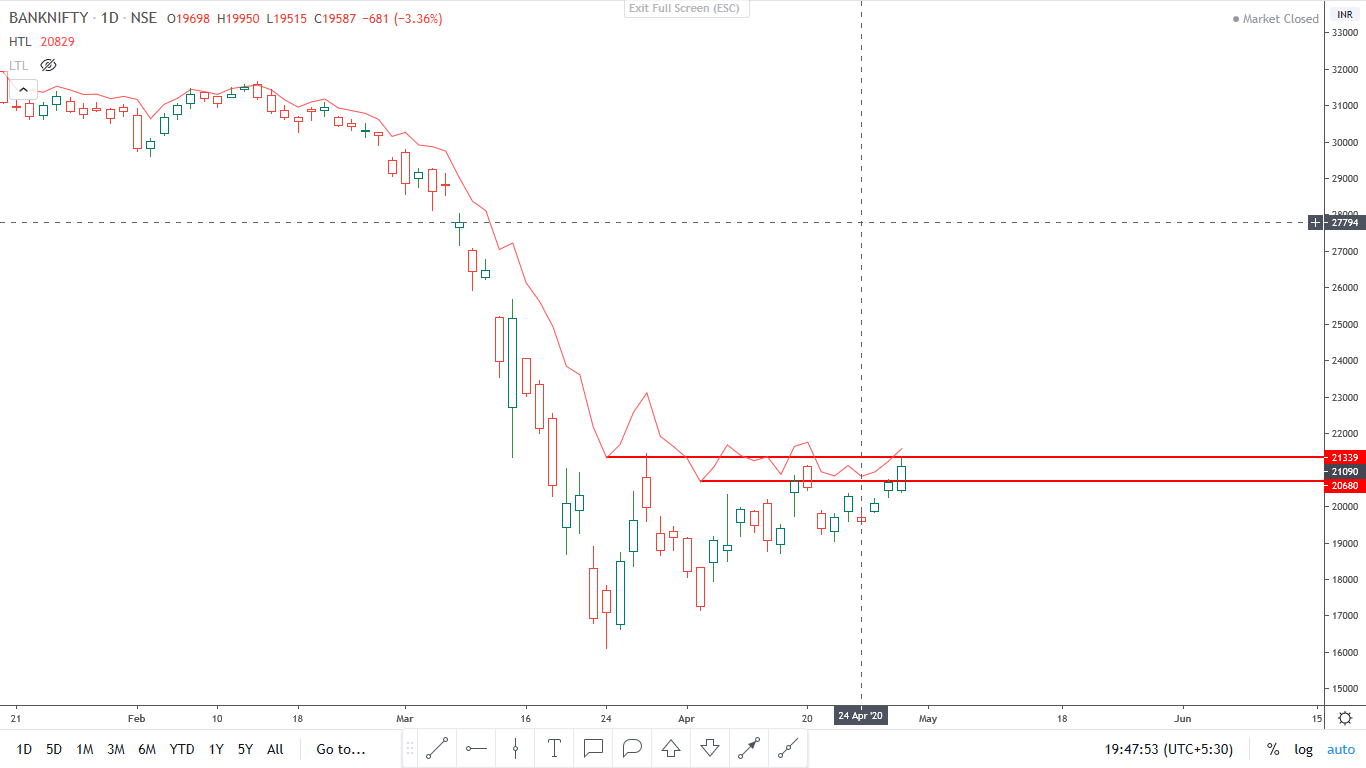
2 Likes
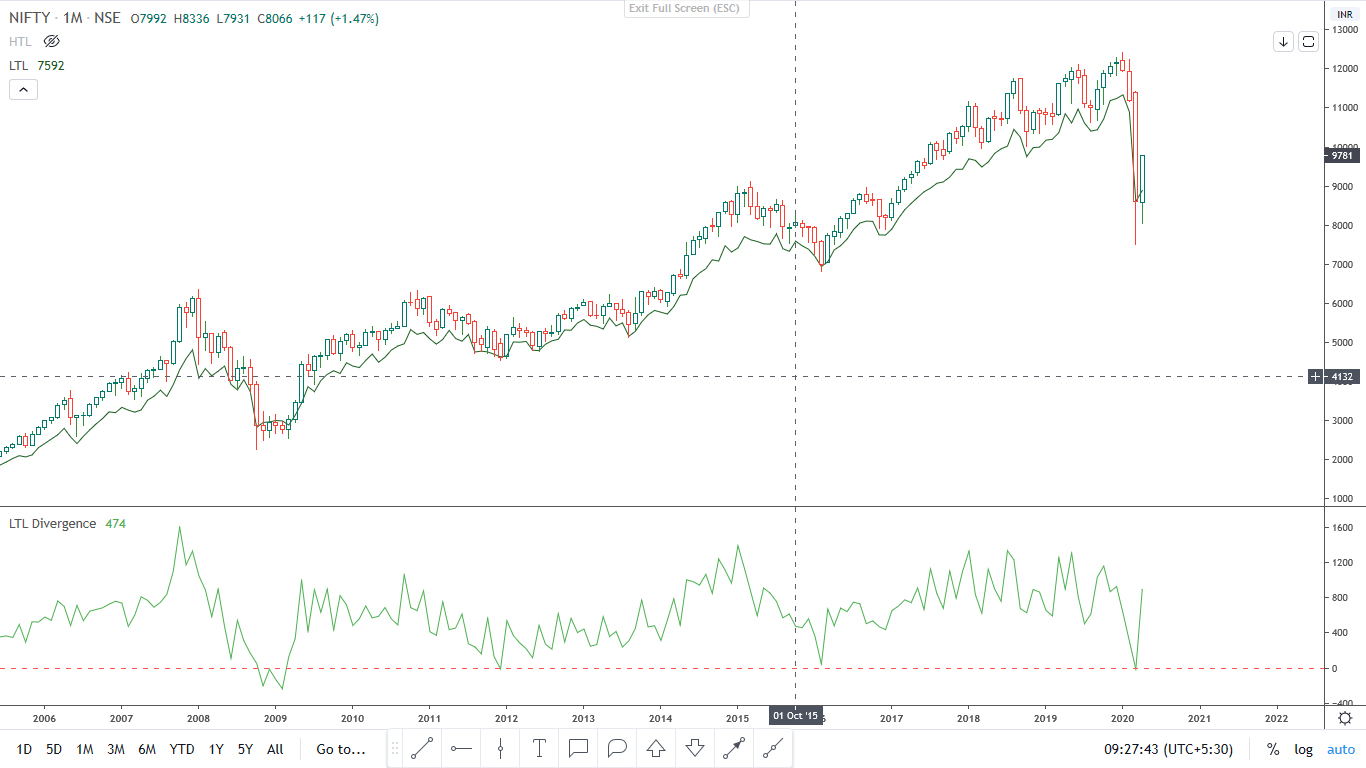
This is monthly chart of Nifty since 2008 crisis. In my view bottom is established at 7511 as today is 30-04-2020 Nifty can fall, bottom can be tested,etc but I don’t forsee a bigger downside beyond 7511 Those invested at 7511 are lucky
3 Likes
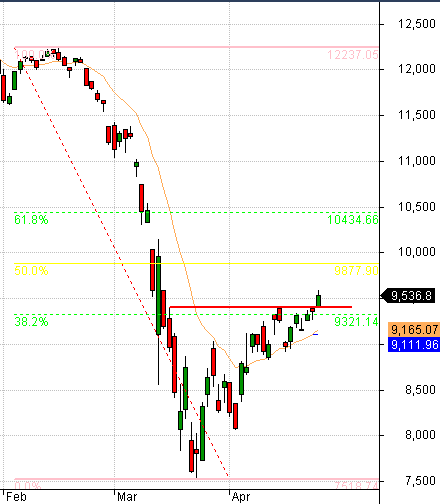
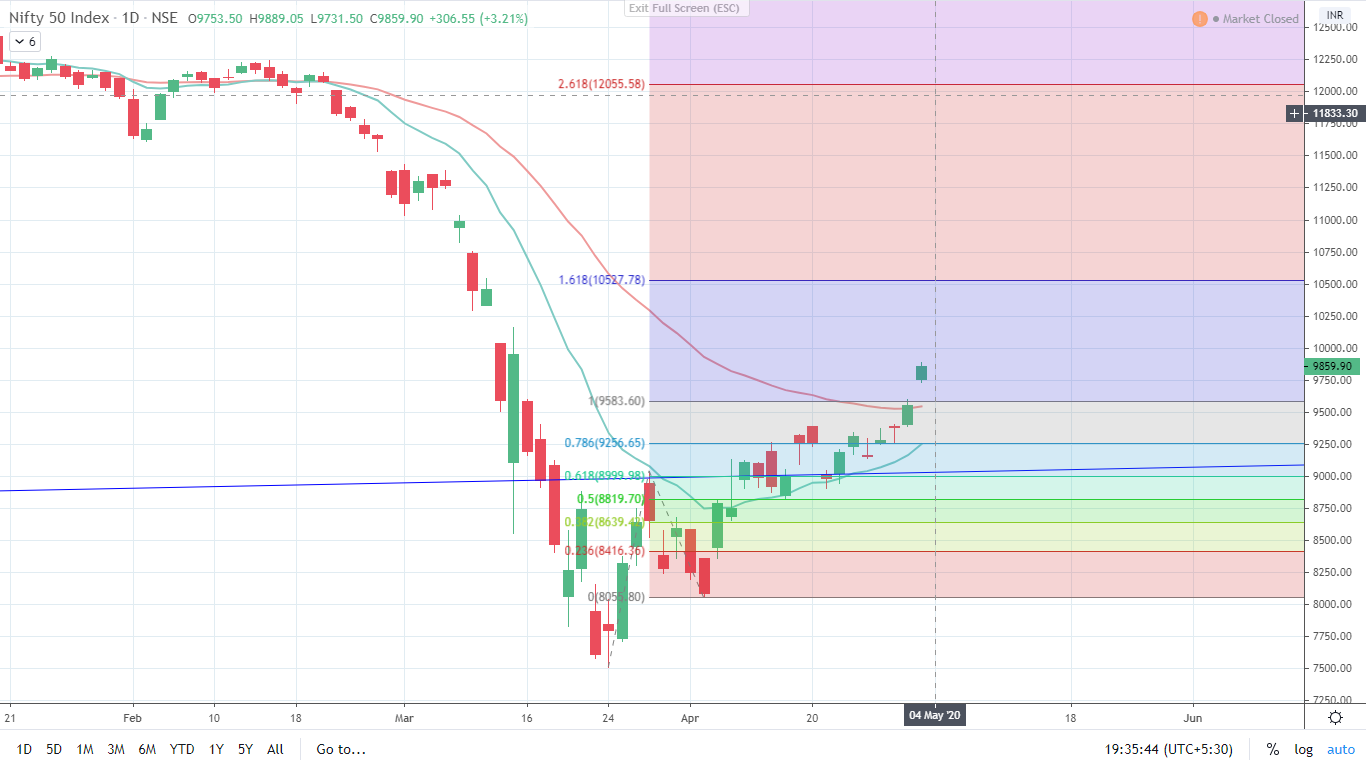
Its good to see the 9583 taken out in the ABC pattern when prices gapped up today. After the completion of this pattern we can expect a test of this level in the coming week. HDFC bank also closed at 1000 and has been displaying its usual strength in an unusual market and has been leading the charge with stellar balance sheet power. As mentioned before in an earlier post, for the market to go down HDFC twins also have to go down and the p/b ratio of hdfc bank at historic lows even at 1000 (and it had gone down to 750) it would have been a feat for the market to go down after the bank reported good nos.
The next stop seems to be 10500-10550 levels which are all 0.618 retarcements and 1.618 extensions.
5 Likes
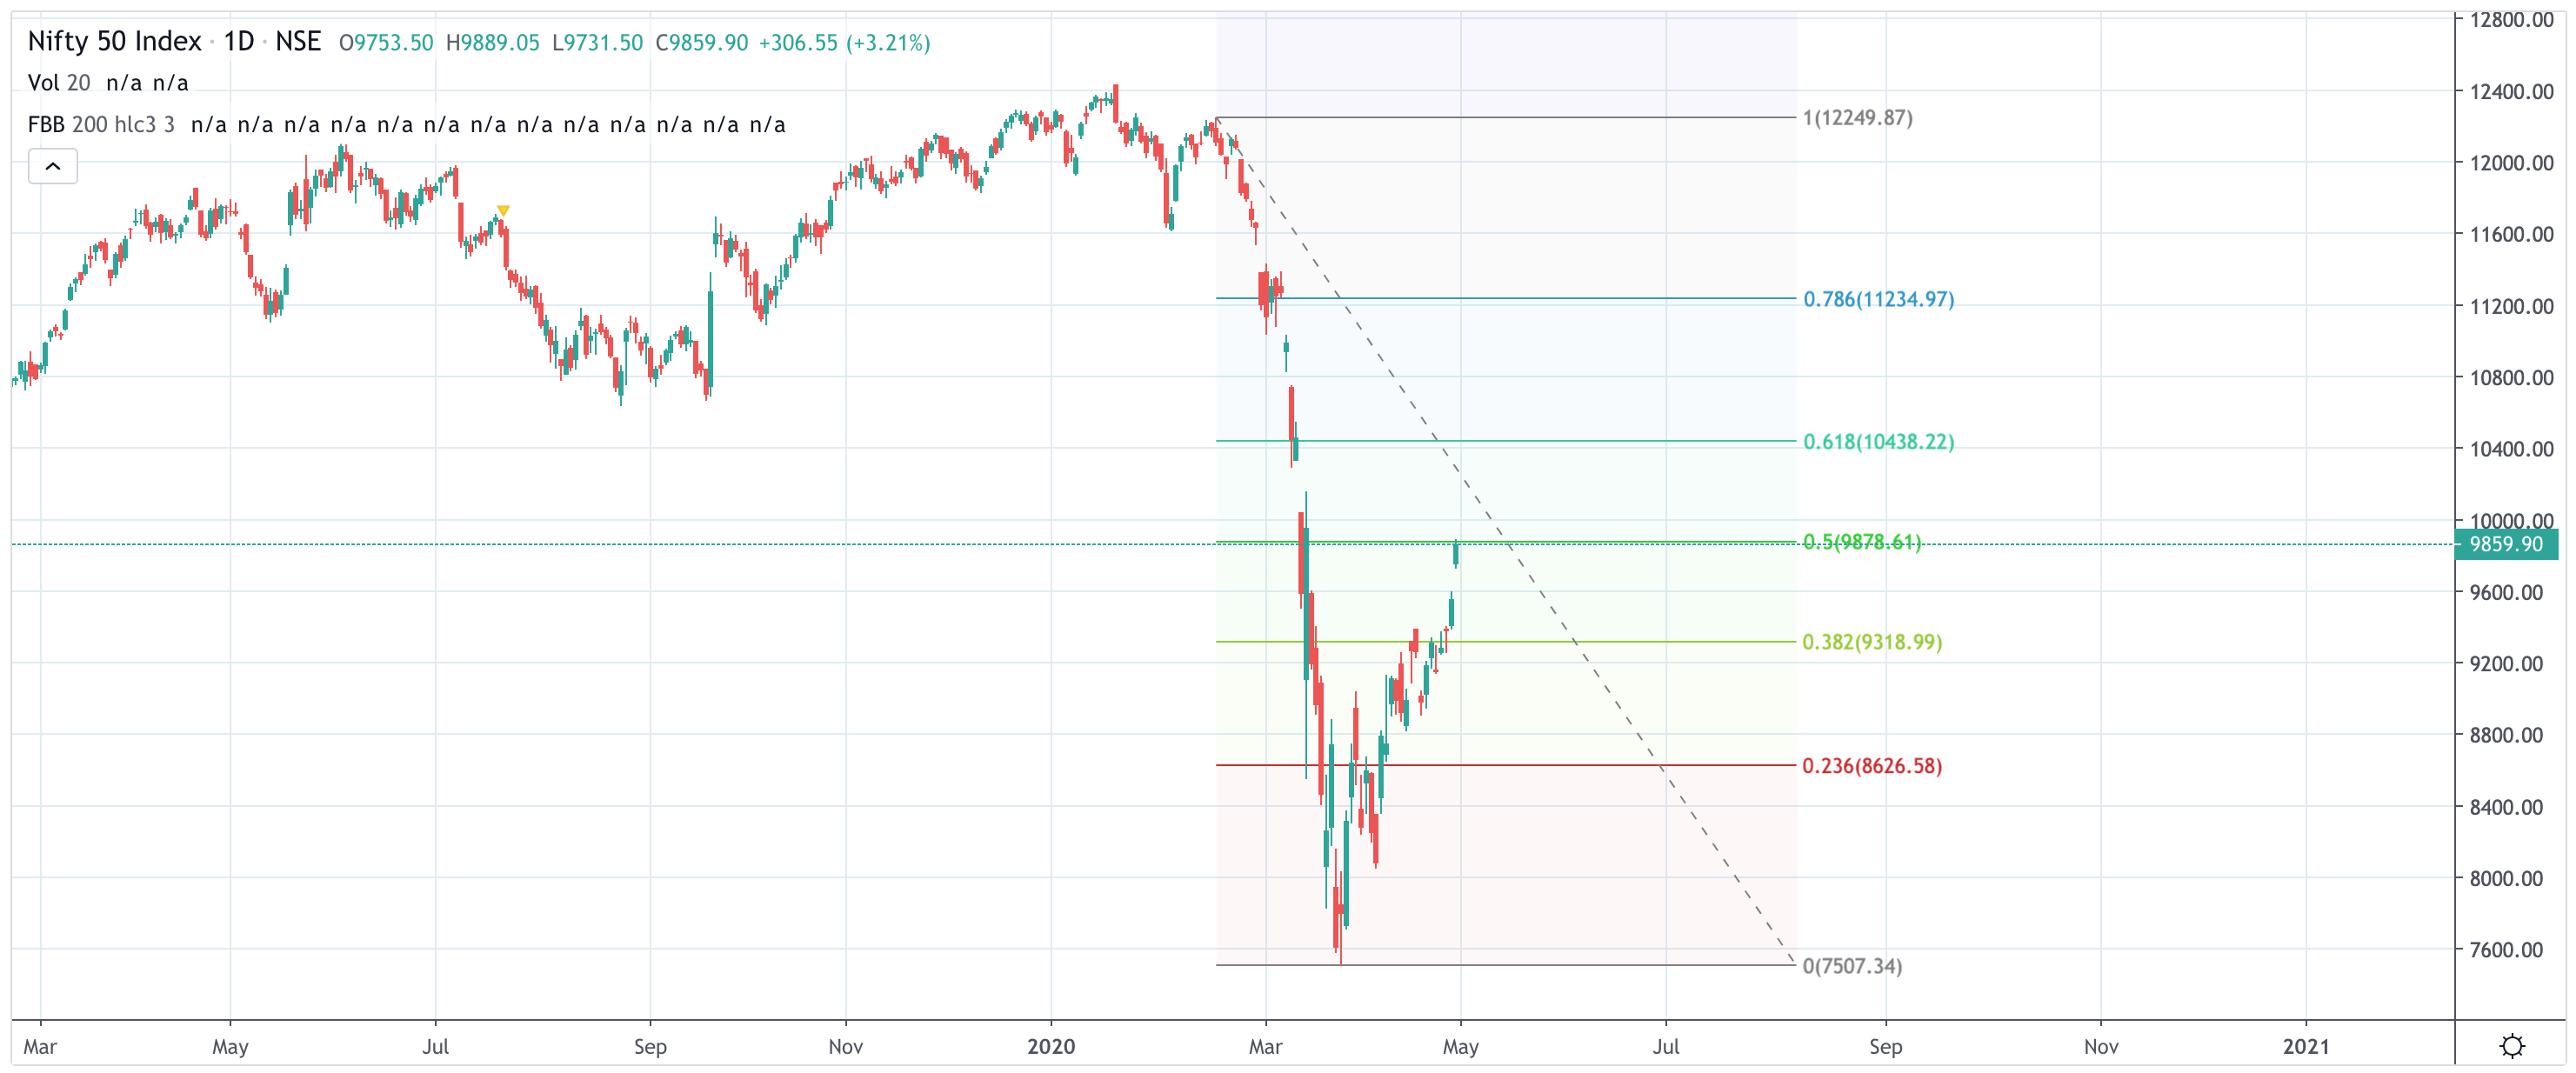
Well! taking broader perspective gives a different view. Seems like Nifty tested the 0.5 and closed below that.
4 Likes
It appears, BankNifty has clearly showed a breakout failure: A Doji, then a prompt reversal.
I was looking to get into Bajaj Finance, HDFC Bank, Kotak Bank, as all three of them are attractively valued (IMO). I use the short term charts to time entries… therefore, looking at the breakout failure and the strong possibility of weak couple of quarters ahead, I think the swing low is not too much to ask for.
3 Likes
hope bottom pickers have booked gains by this time, or this might be a good time to take april profits off the table…
with reference to my last post, there has been no show of demand in the market , the volume we saw in april, coming up, did not have a promising effect on overall market structure. hdfc bank failed to clear the 50% retracement, reliance and tcs failed to break out of the lonf term support trendline…
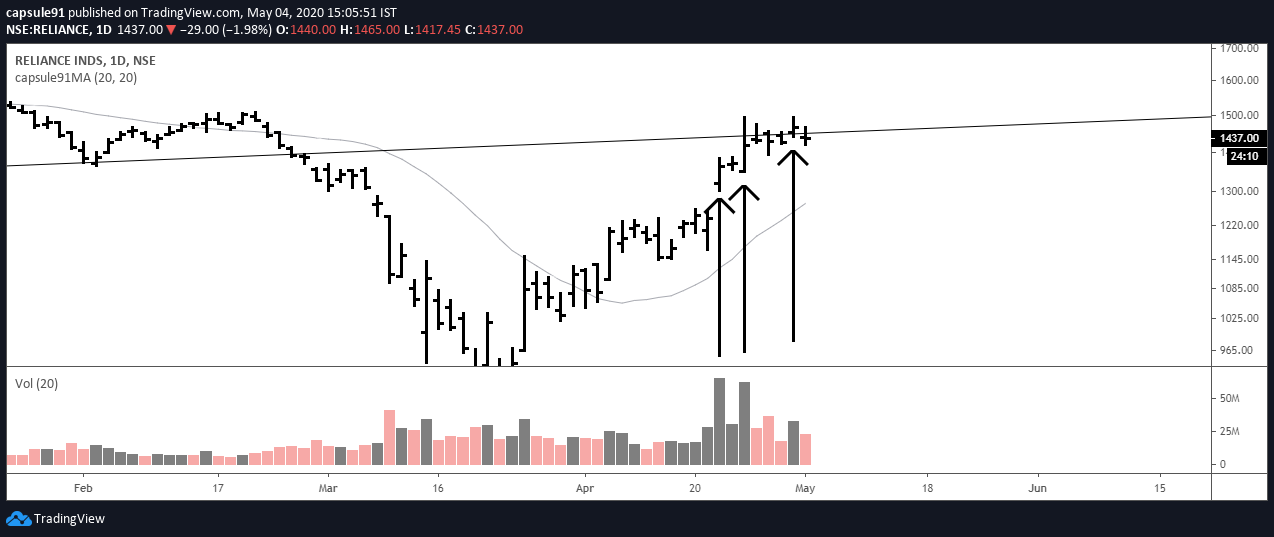
reliance in particular has been showing tremendous volume uptake , and failures to close above resistance last week.
today , nifty’s reaction, which on charts has formed an abandoned baby candle stick formation, marks the upthrust in the structure, and most probably marks the completion of phase c of redistribution by the composite group.
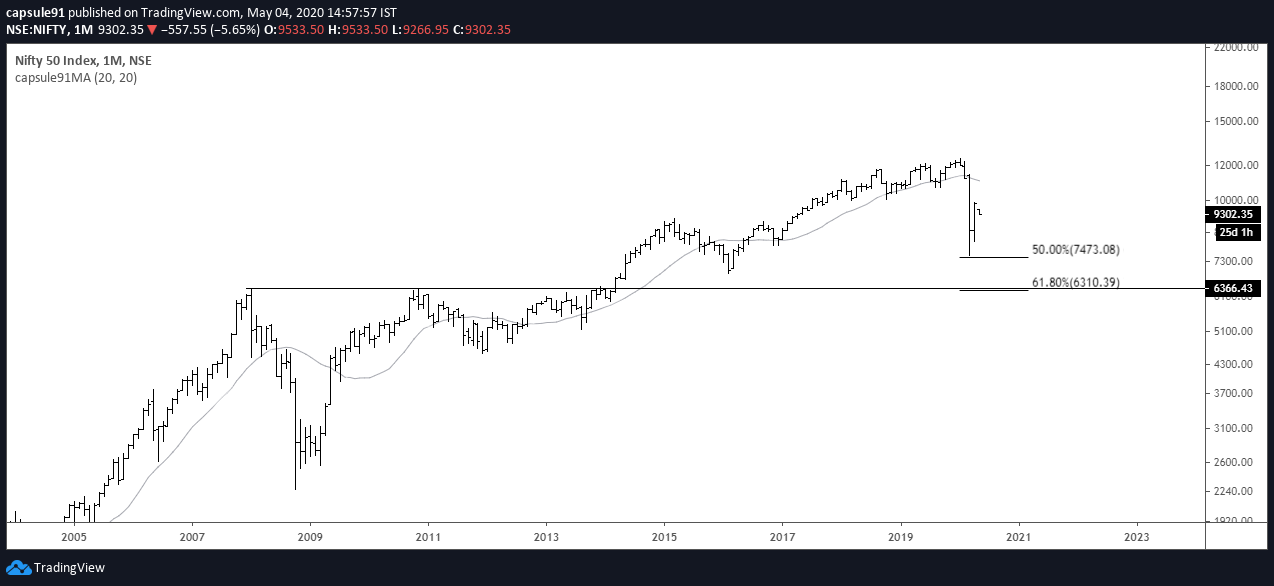
nifty concluded the first leg of correction at 50% fibonacci retracement , and is headed to test lower support at 6300ish.
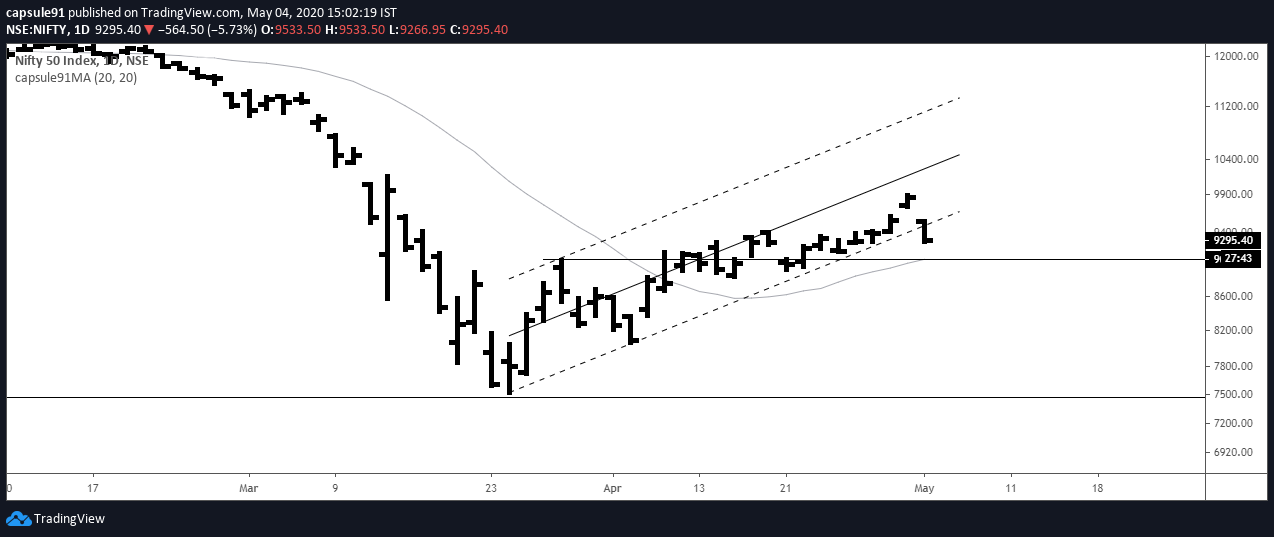
the poor closes in the daily chart, indicated a lack of momentum above the 20dma and a breakdown
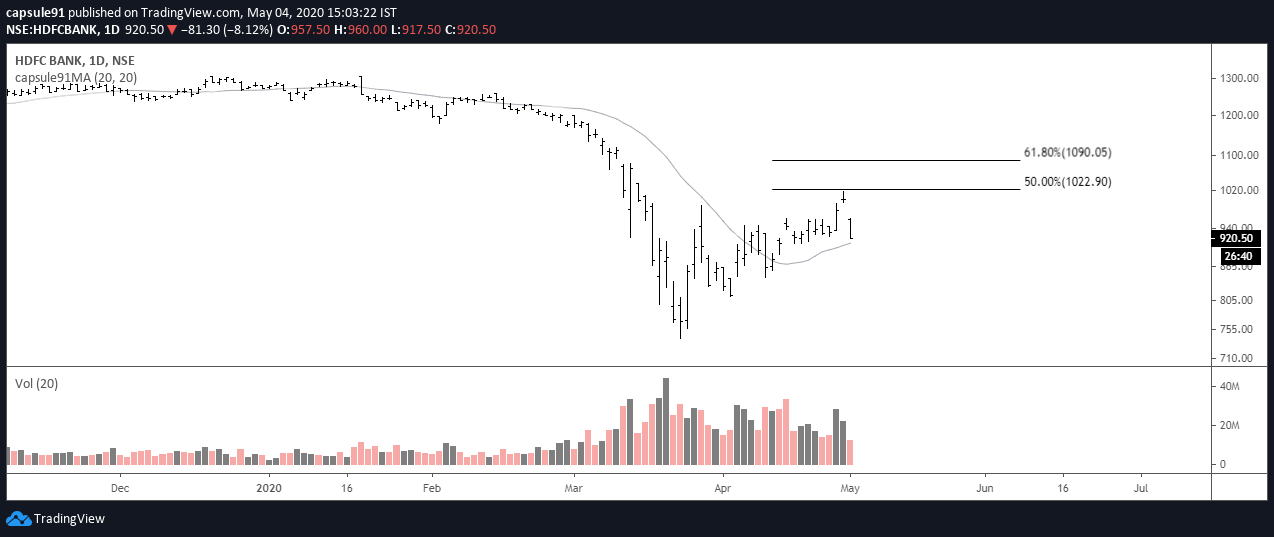
failure of hdfc bank to clear 50% mark, inspite of heavy volumes in the market
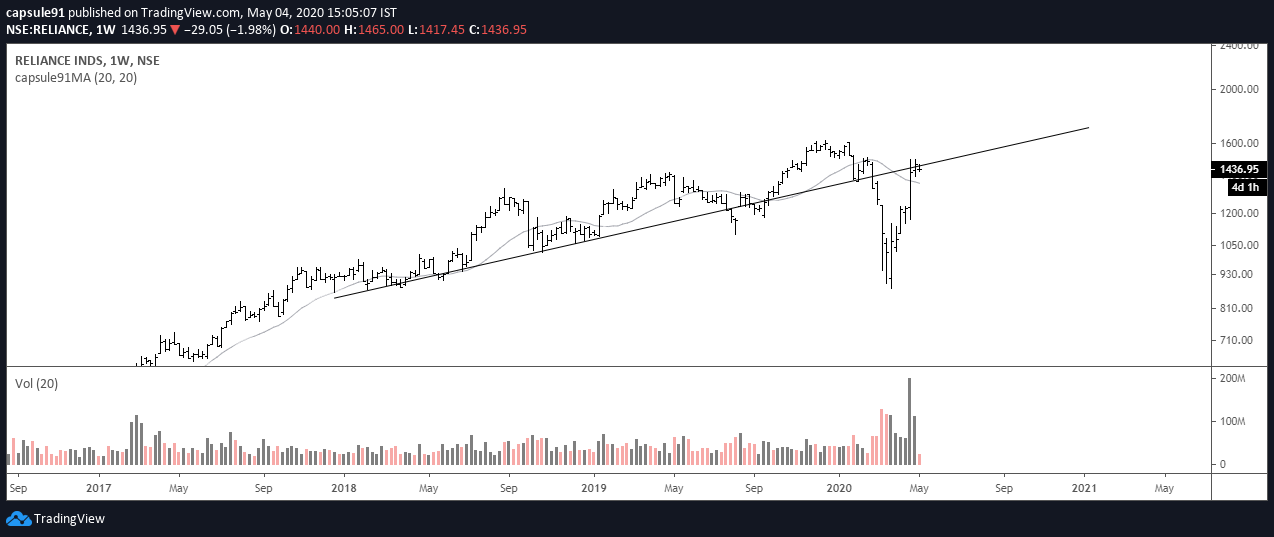
reliance bounced with a nice reaction, but does not show any sign of positive structure building up so far in the longer term perspective
the volumes that are being seen coming in the market, are screaming signs of larger operators offloading remaining stake.
its difficult to assume the nature of the oncoming correction, if it is a complex wave structure, unless us elections are done with and the covid19 pandemic cases curve tops out to a plateau, we might have a long grinding bear market for some time…
Long term investors should be happy with the valuations cooling down to throwaway levels, and for amatures like me, i feel this is an excellent time to learn and build up fundamental exercise and practise technical analysis via short term trading.
Stay safe fellow VPmembers…!
14 Likes
The Candlesticks are a little unclear on Nifty, but discernible on the Nasdaq and Dow Jones.
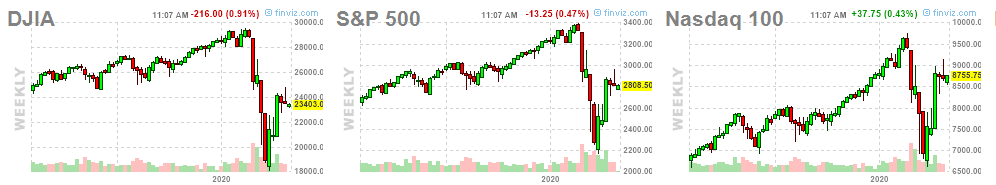
The weekly chart appears topped out, what remains to be seen is how deep the correction goes. If there is absence of momentum on its way down, the market might go sideways for an extended period.
The same sideways trend could apply to Nifty as well.
1 Like
Can you please point me to the source.
Hi @manivannan.g ,
As you correctly pointed out there prices have retraced by half. However, the trend is strong and in my view as long as prices make higher highs and higher lows the trend remains upward till it stops doing that. Even the long term trend since 2008 is intact - so betting against trend - however irrational the trend may appear - seems to me a case of what does the market know that I don’t ? Of course if some lower highs and lows are posted one will need to change one’s mind - but to me it’s too early to make any such decisive forecasts against the prevailing trend.
If you read gatesnotes, which contains up to date info on the race to make the vaccine - there is definite progress esp in the RNA/DNA method (which hasn’t been used before but takes less time). On top of this we have all these stimulus packages all over the world which are creating inflationary conditions in some capital markets and which are likely to continue.
I am not an expert though so one can take all this optimism with a giant pinch of salt
2 Likes
A vaccine is a strong hope, the only one.
It may be a while before it is tested, approved and the humogous task of distribution and administration over the world reaches completion.
The best case scenario is one year for the economy to pickup. Plenty of second and third order impacts will have unveiled by then. The prominent one being policy makers in the USA taking a tough stand against the Chinese, for what they have done to make matters worse for Crude prices, which is akin to launching a missle.
If this weekly top is made, I feel there is very little that will keep Nifty from touching it’s Swing Low of 7511.
1 Like
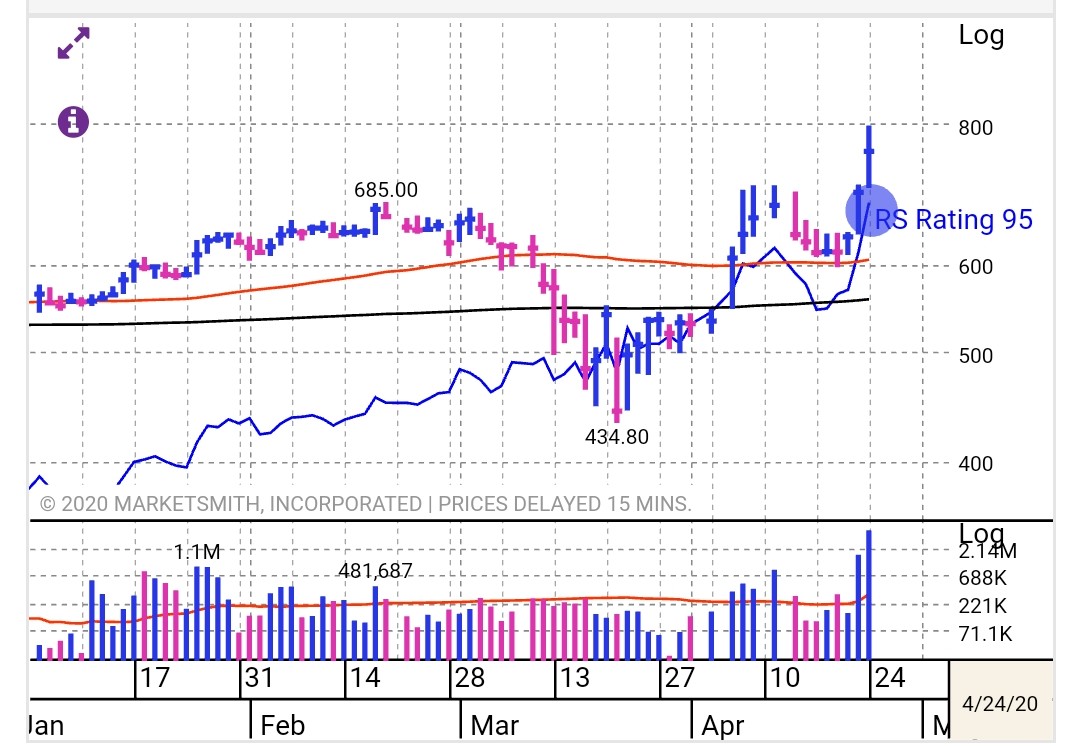
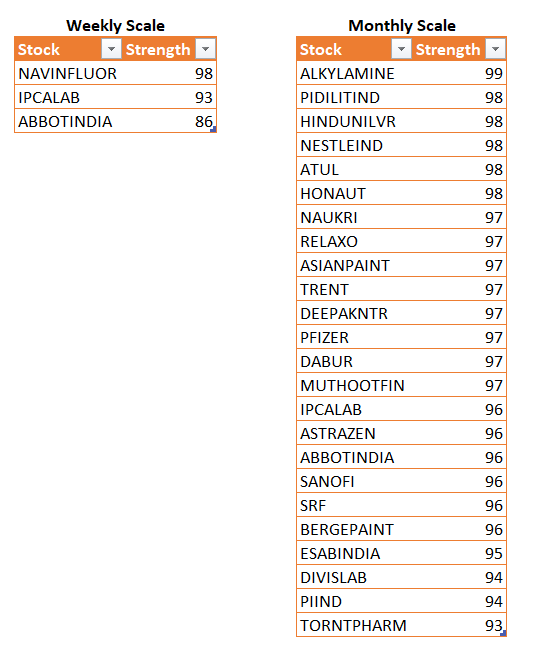
It is from a screen that i run which is loosely based on Mark Minervini’s Trend Template.
ok, thanks for the info. ![]()