
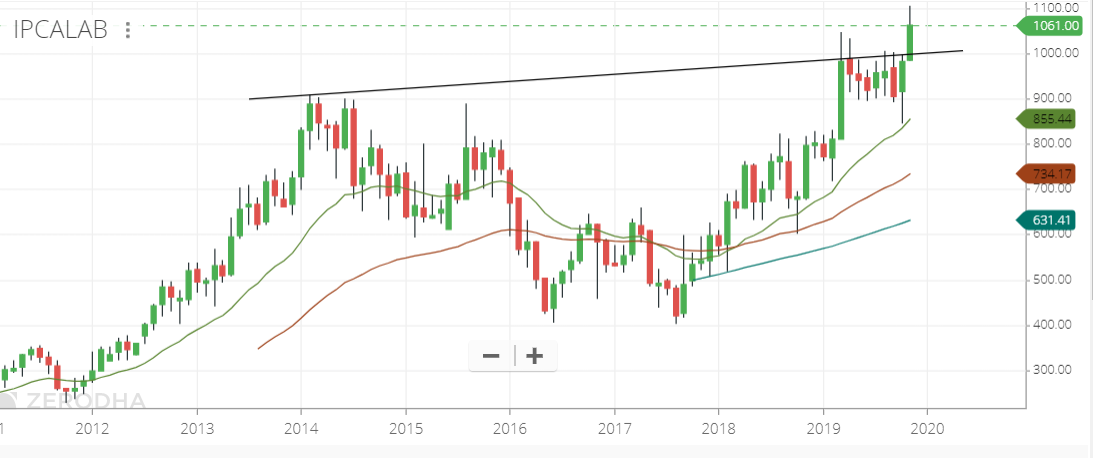
IPCA Monthly. Appears to have broken out of a long-term C&H pattern which has been forming for 6 years 2014 to current.
During the same period, from FY14 to FY19, the PAT has moved like this
477 → 256 → 93 → 188 → 233 → 455
Sort of similar to what has happened in the cup formation. Now TTM, with the good numbers today stands at about 590 Cr. So the earnings numbers have gotten ahead of the price going by historic valuations and the TTM P/E is about 23 levels from 8 Yr median of 27 levels (3 Yr and 5 Yr medians around 35+ levels). There is strong support on the price at 1000 levels now and probably about 20% upside at least in the near-term when the P/E goes back to 27 levels. The growth is fairly good quality, aided by both topline growth and a bit of margin expansion which augurs well. So fundamentally and technically both point to a 1:4 sort of risk:reward situation which is quite favorable.
Disc: Have a trading position