Fib levels can also be applied to stocks which have corrected heavily and one can try to get in at important fib points. Price movements are an important gauge of investor sentiment about a co and often sentiment goes to extreme levels so one needs to have some early signs of that and that’s where fib levels come into the picture to identify important extreme turning points.
Ofc blindly investing in price action rather than the underlying business often lands you in trouble - but it’s also true that knowledge about the underlying business can also prove useless if your logic is faulty and that is also equally disastrous. So the best way is to follow the management commentary, track price action in a more nuanced way and try and get a grip on the basic business variables driving the co growth.
Fib levels is one tool that can help you navigate your way
I’ll post more charts to further my understanding too
Thanks @bheeshma , for some of us who are relatively new in investing, these insights will help learn and hopefully protect capital. While there are pure fraud cases such as DHFL, Yes and so on where being an financial institution the underlying business itself is wiped out, there are possibly other set of companies which may not have quality promoter and governance but underlying business is sound.
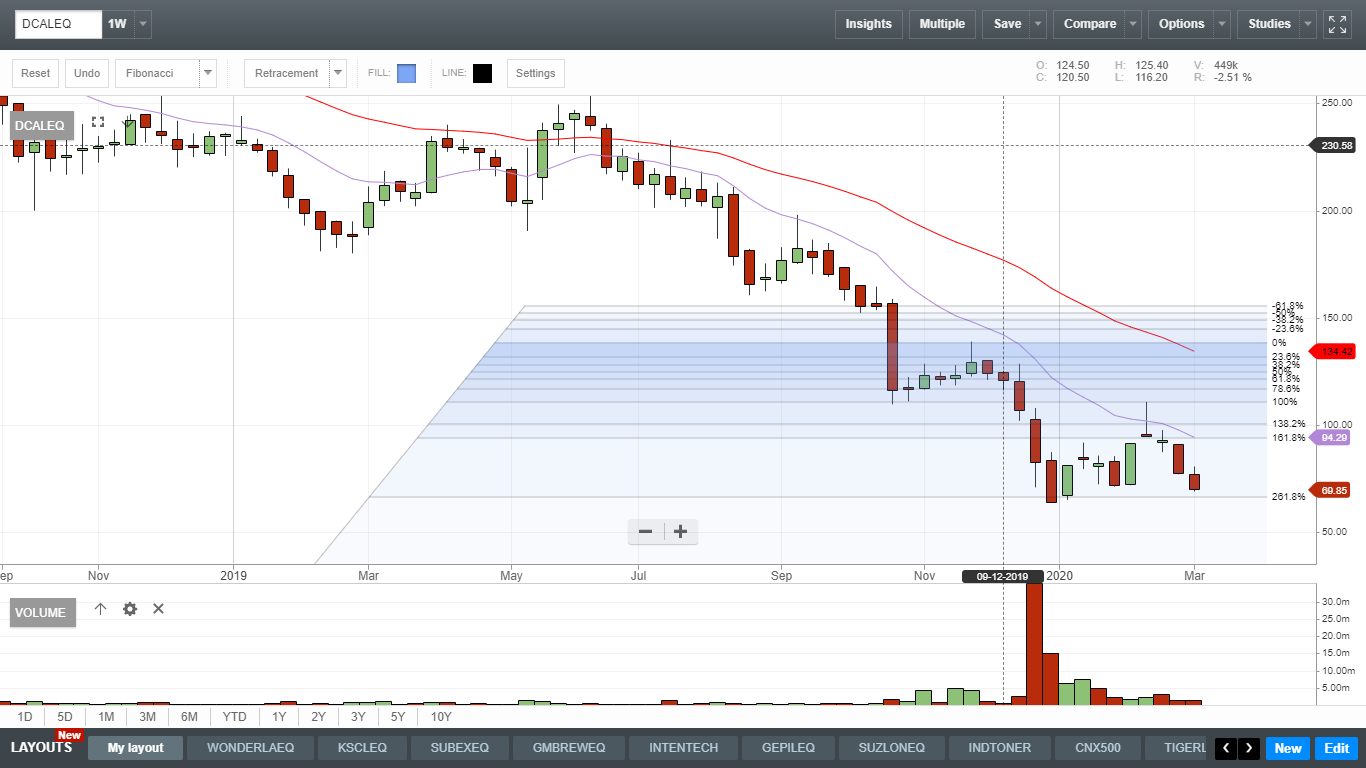
Would it be possible for you to take a look at chart of cases on this other spectrum - one example comes to mind is Dishman carbogen- there has been lot of price erosion after IT raids , however underlying business remains of CRAMS as industry is good and multiple supportive actions around buyback/ MF buying/ stable Qtrly results and so on. Appreciate your view from technical analysis.
Also on learning technical analysis- John Murphy’s- Technical analysis of fin mkt - is that a good reading to get started ? Any other sources you recommend?
Dishman has found support at the 261.8% fib extension. 64-65 is good support at this point. If that doesnt hold then the next stop is 22-23 (423.6%). Not following the co and know nothing about the financials. Looking at the chart suggests that there is something wrong with the co as these kind of downtrends portend more pain in the offing. Still if one wants to trade then i would wait to see how the price develops around the 64-65 and if broken then would go in aggressively around 22-23 because thats where the whole rig is headed in my view.
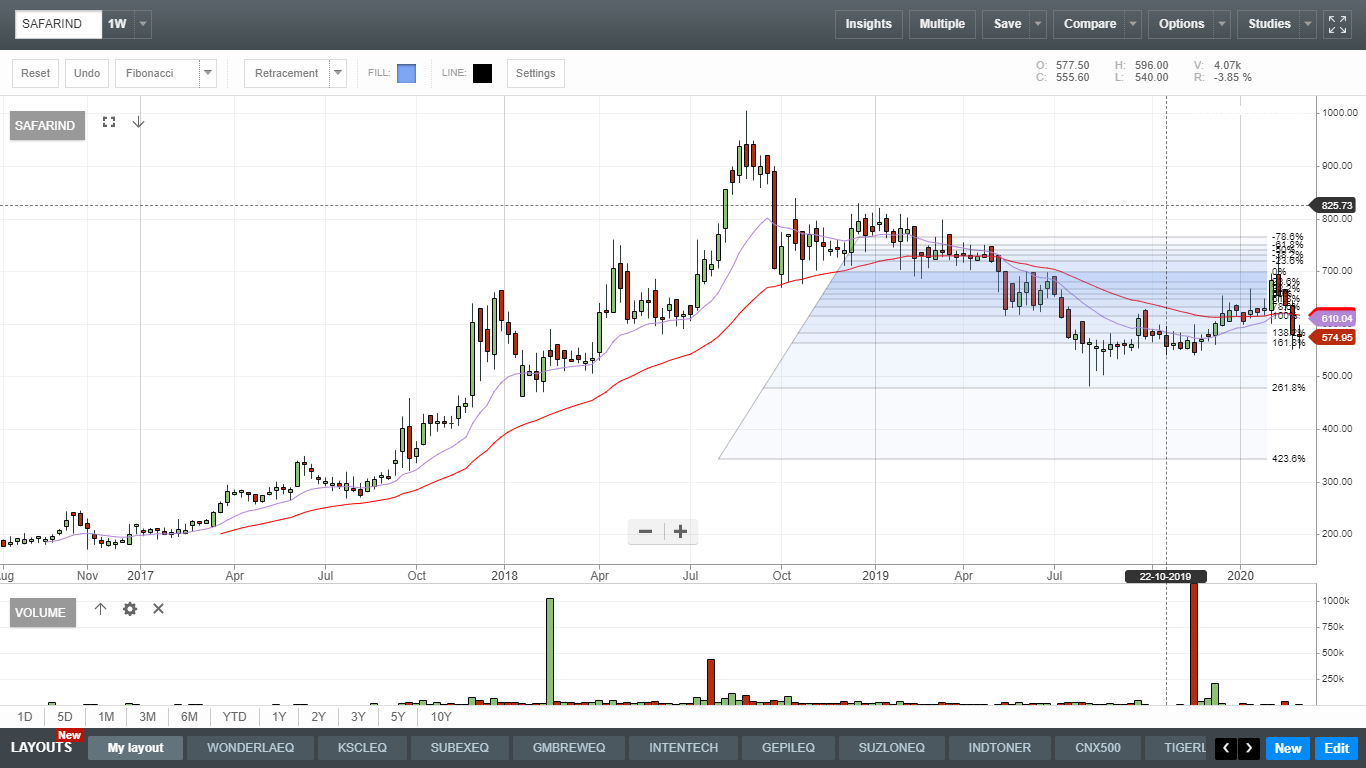
The prices tested the 261.8% level and immediately rebounded and are now consolidating around the 161.8% level since 7-8 months in the 550-700 range. The Dec’19 results have been great with ~2x increase in EBITDA ( 11cr to 20cr. The corona virus impact however remains to be seen
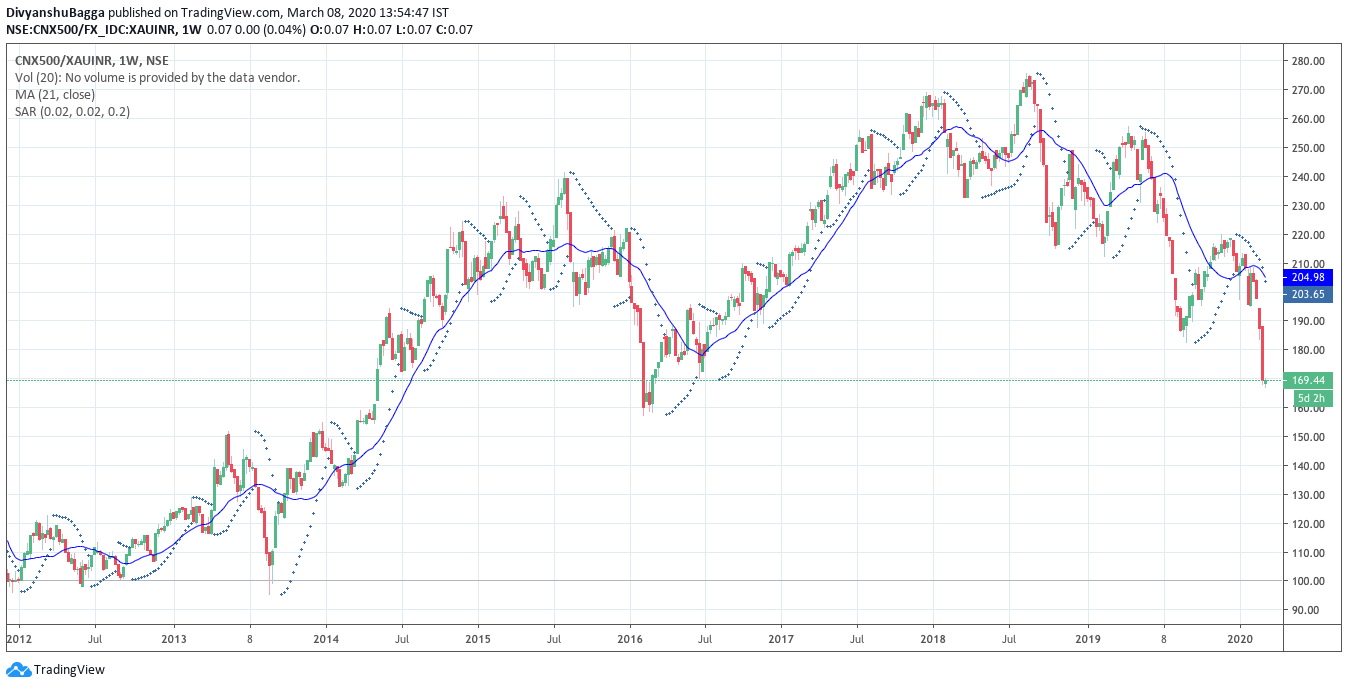
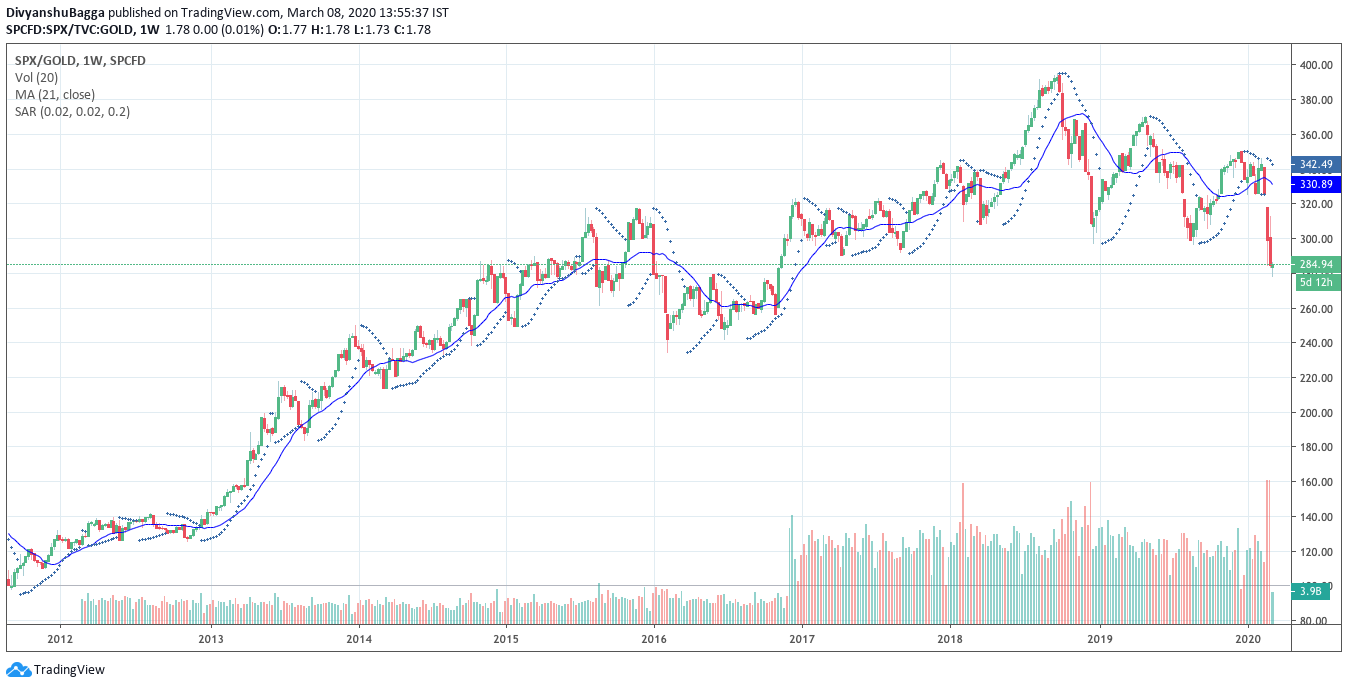
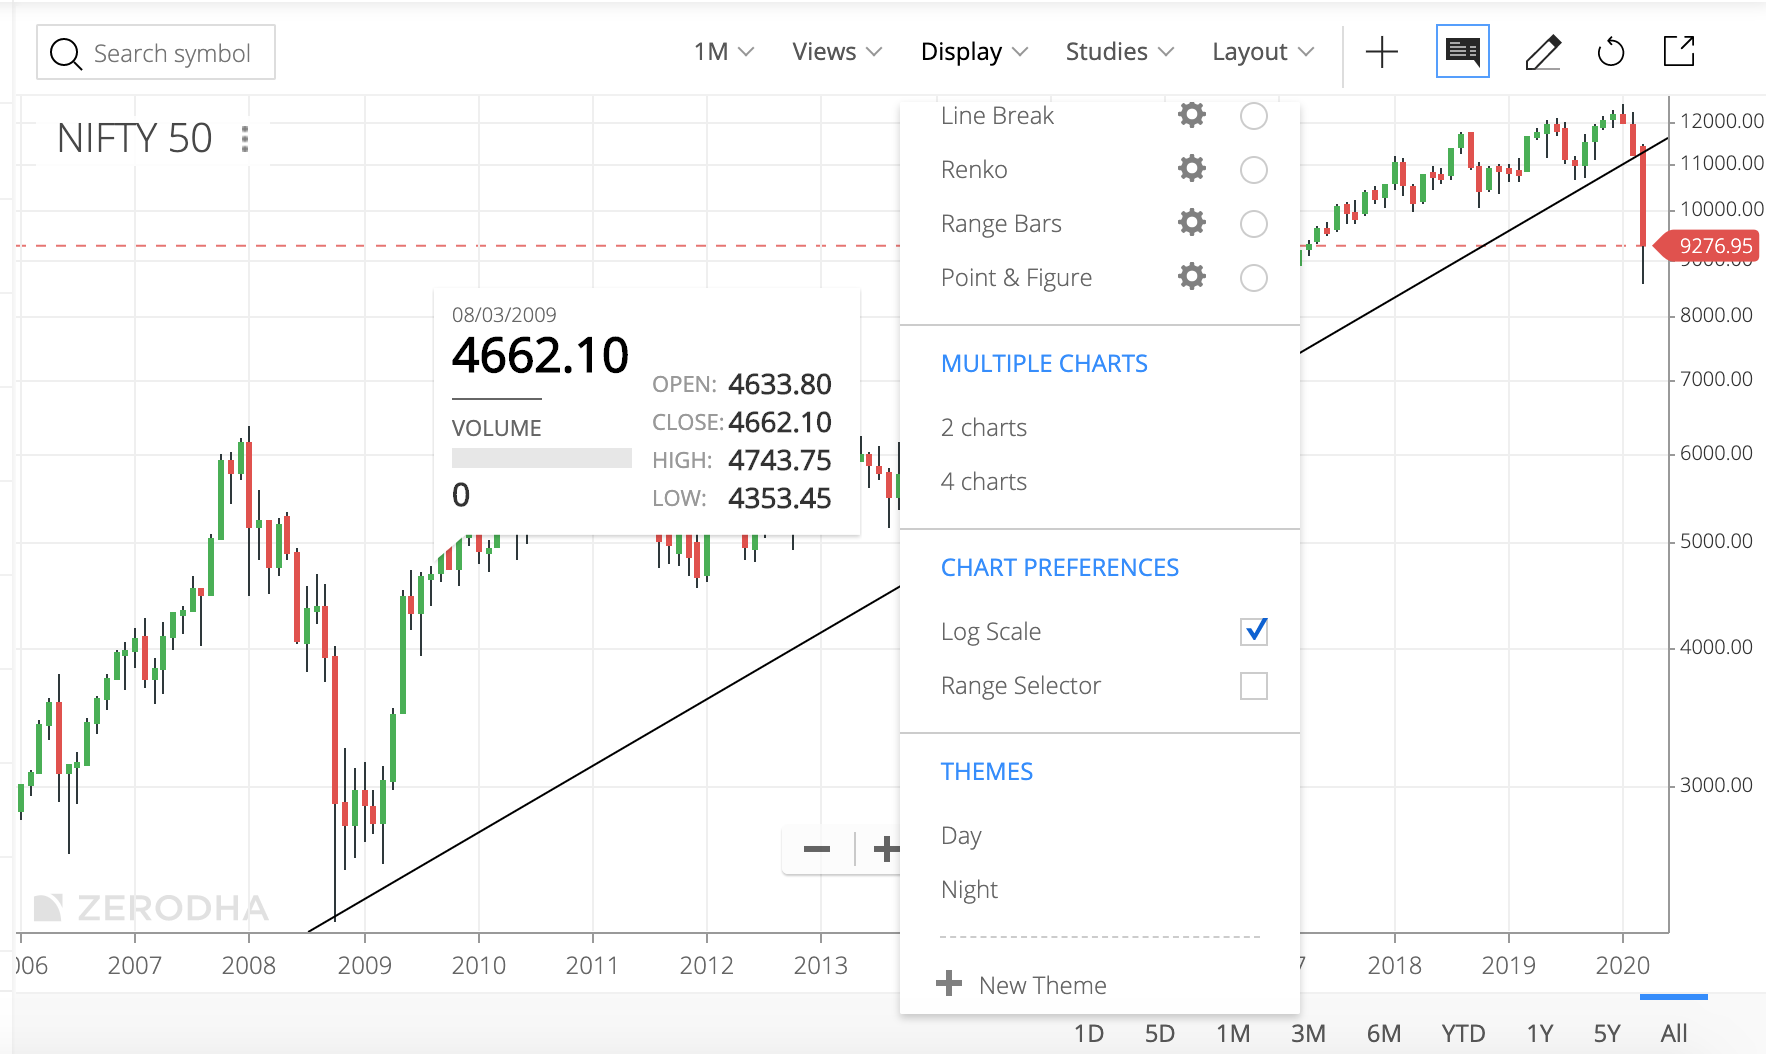
The future supply of fiat is highly unpredictable causing its value to fluctuate widely with news flow and economic outlook. Not to mention, the long term loss in value of fiat gives a deceptive view of gain for many assets. Therefore I decided to plot the market index in gold terms, to see how the markets are doing in terms of a currency with low and fixed inflation.
It becomes immediately apparent that the markets have been in bear phase (lower highs and lower lows) since 2018. The ATH made recently in fiat terms deceived many, including myself, into thinking that we have started a bull market but apparently that was not the case.
but if demand dosent show up in the next couple of months, the index will have a lot of trouble with a possible downside to 7k range, with a strong support at 6337 which besides being the highs of 2008 and 2010, is also the 62% fibonacci level of the entire trend so far…
since 2016 bulls have always tried to defend the median line of the channel, and recovered with a spring action, if such a response comes back or not is the scenario to monitor…
i had liquidated most of my portfolio in december, missed out the profits in midcaps in the last couple of months, and have been focusing on very short term trading the markets…
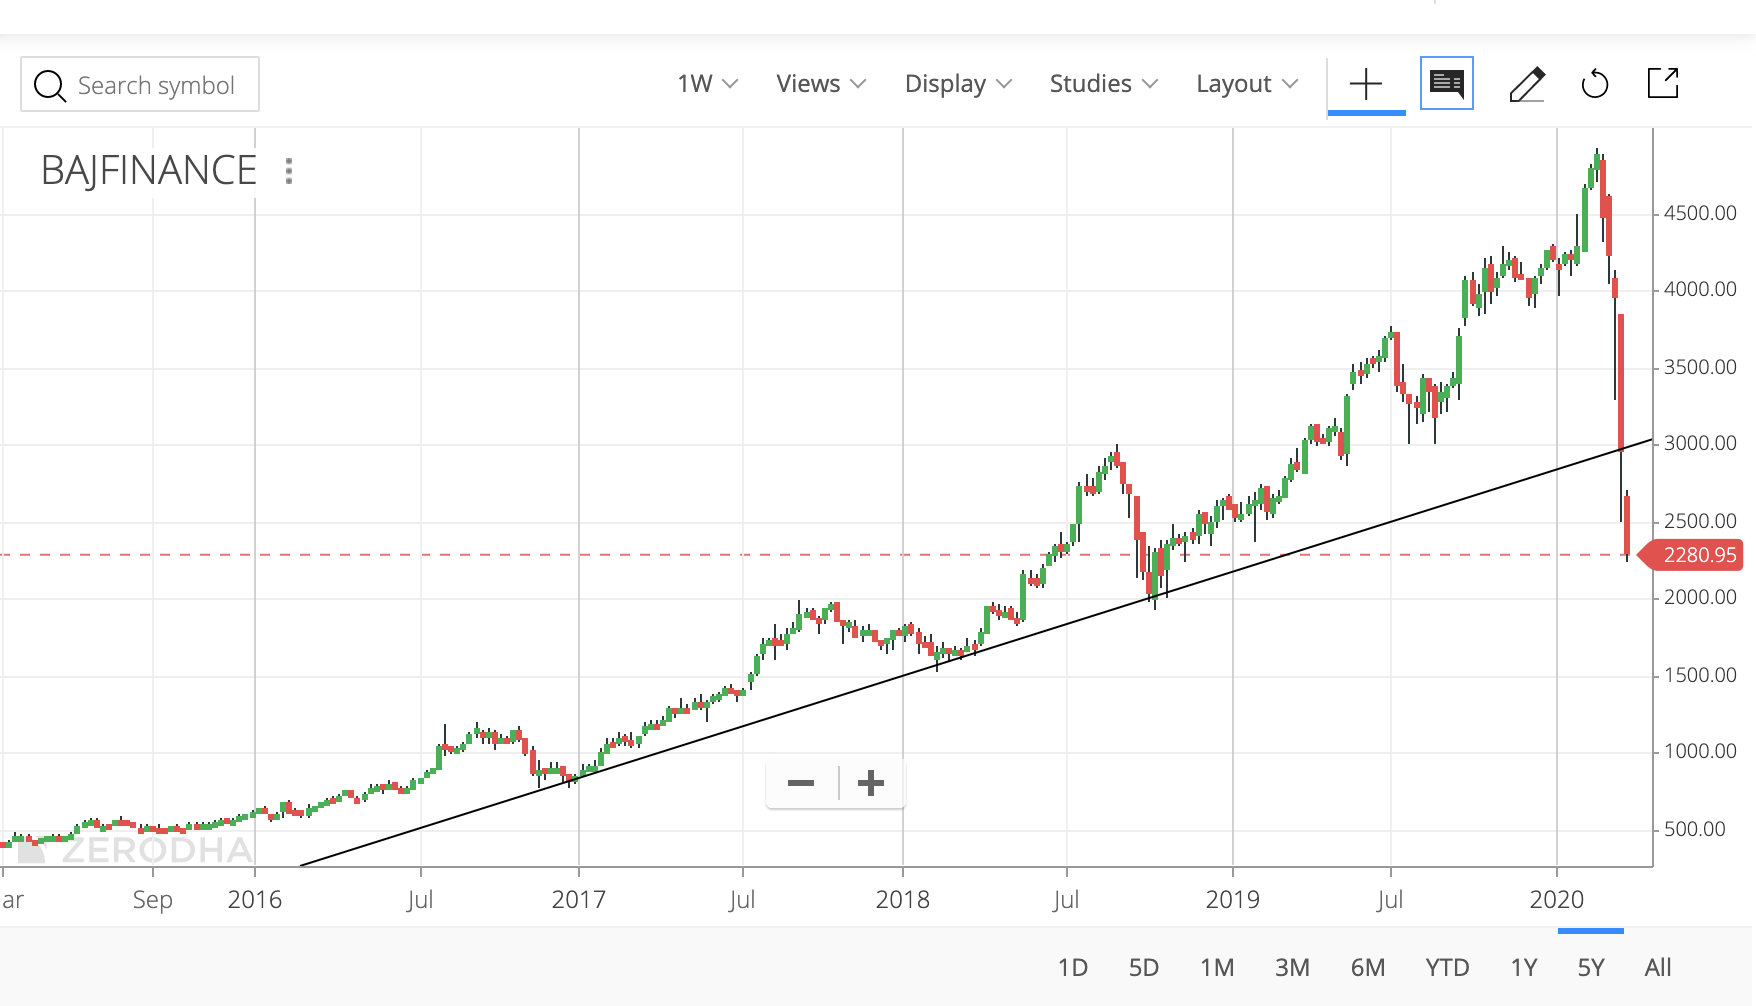
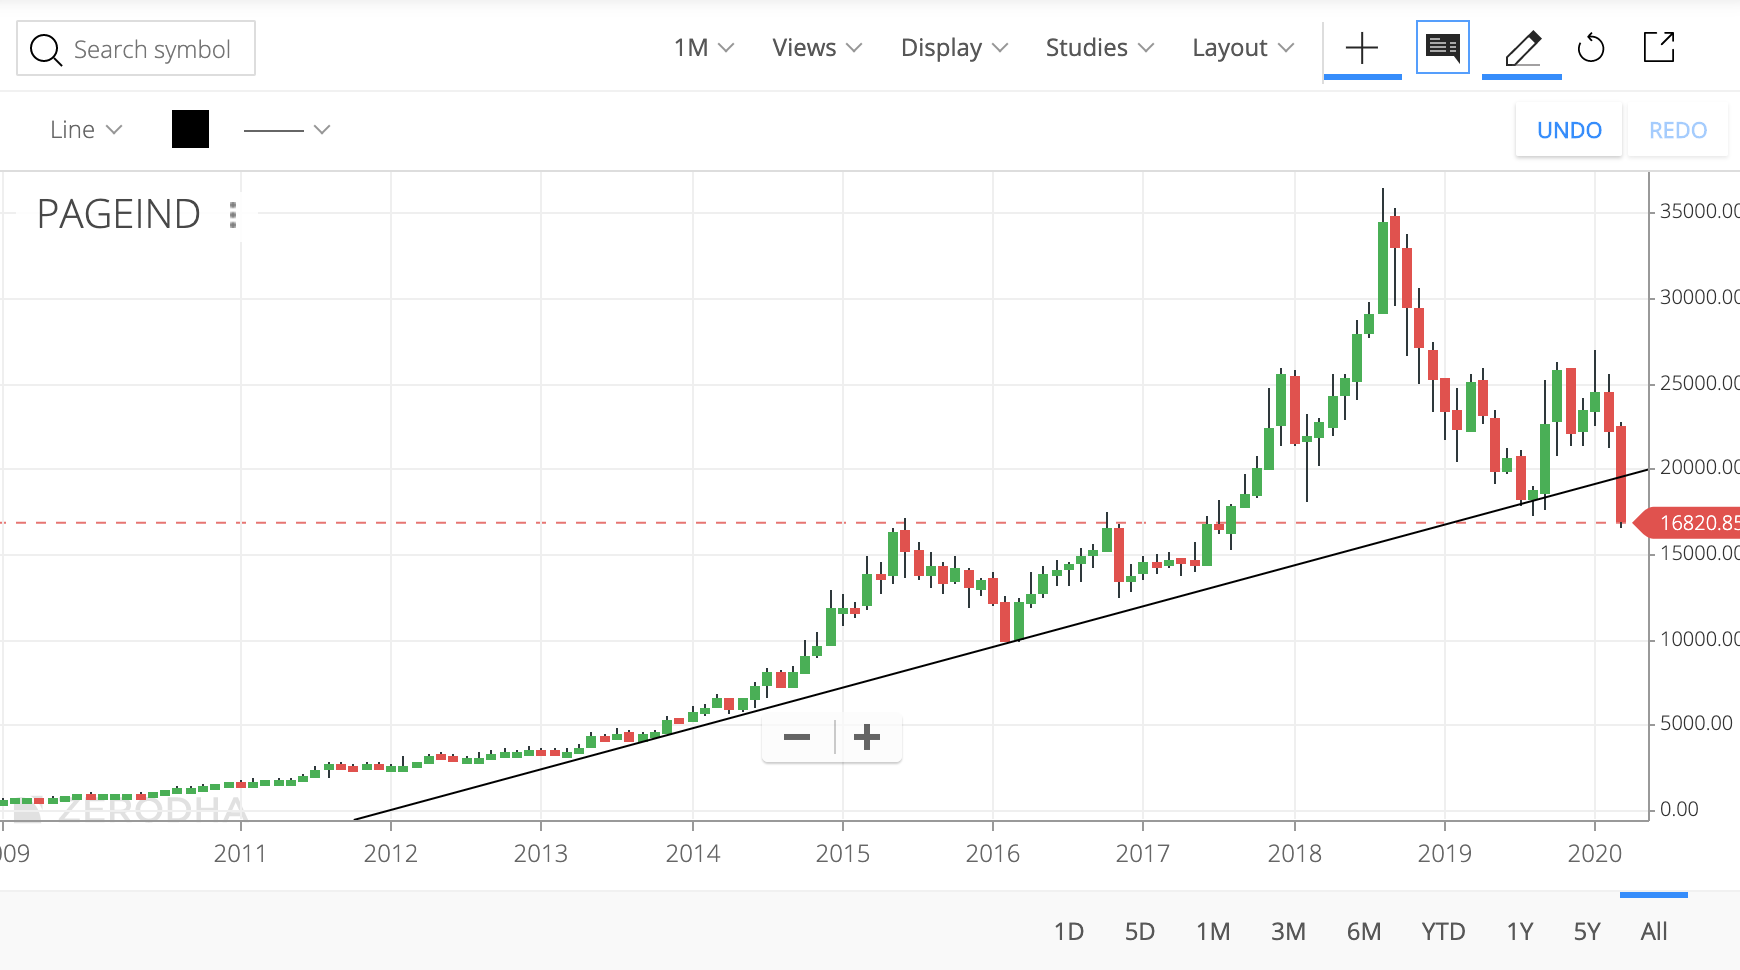
This is a trendline drawn on a log chart so when all the lows you have connected on the log chart are converted to a regular chart they would resemble a parabola and not a trendline.
Some chartists use a log chart and some use a regular chart. A log chart properly displays the extent of euphoria and pessimism as % moves are shown properly but when support and resistance are to be calculated as far as I know people veer towards regular price charts as people tend to remember prices and not percentages.
Coming to the trendlines - its a subjective art and not a precise science and there are no definitive books (though there are several resources) on drawing trendlines so in case anyone is interested they have to come up with their own methods.
The basic tenet which i have found useful is to find a price point where overhead resistance has acted as support and use that as a rudder to guide the drawing of trendlines. This creates a better trendline in my view.
Log chart gives earlier break than regular so I’ve been waiting for the break on regular monthly. Totally agree that trendlines are highly subjective, but in my (very limited) experience, a 10+ year trendline break on the monthly charts is followed by catastrophic falls.
Also if you observe the last 3 months, the market has sliced through all supports/previous resistances like paper. I feel this is one of those times when the strength of the trendline and the fury of the break (12 years, monthly chart, daily close below the line, failed pullback last Friday) is a dominating factor.
I dont take any calls on technicals except exiting on trendline breaks - I’m far from an expert. But it has served me well repeatedly in the last 3 years
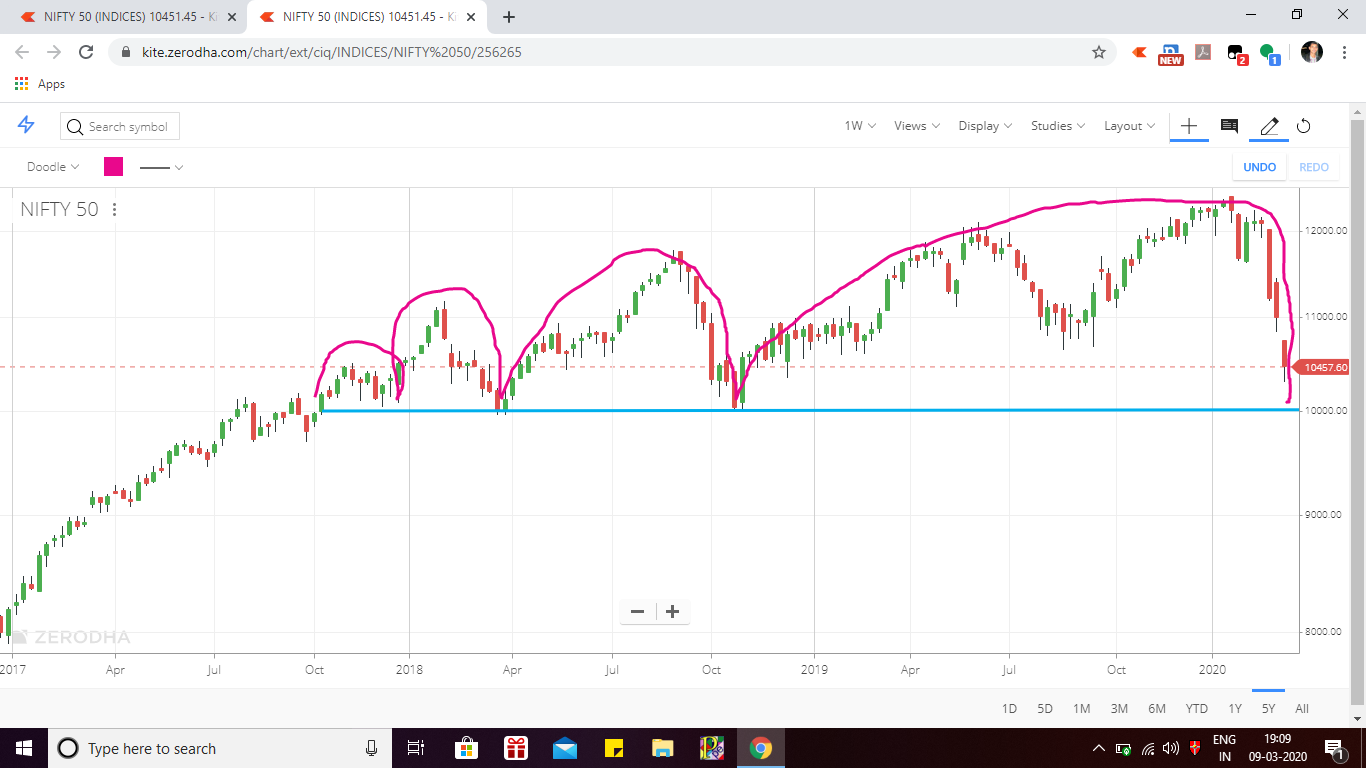
Thanks for throwing light on that. I am using the following channel (weekly) as my main operative one mainly because it has survived multiple scares and has been consistent in giving context to price moves. As mentioned earlier, I prefer drawing uptrends using the starting price point as a resistance that was broken turning into support & then connecting all the lows. So far the trend is intact as the prices recovered and snapped right back into the channel after trading curbs were lifted.
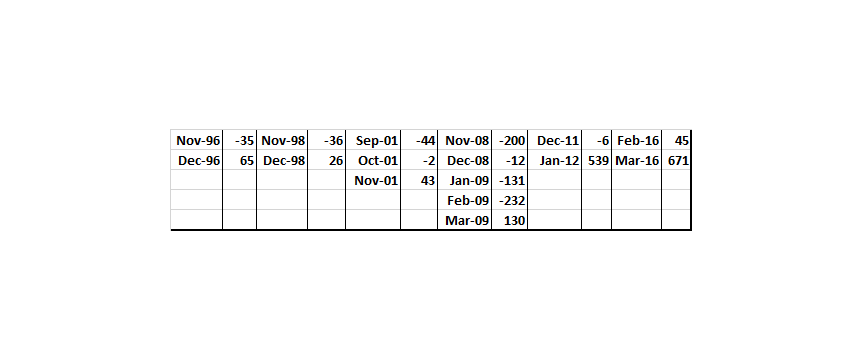
The long term PE ratio of the nifty is 20 and today nifty hit a p/e of 20.41. The long term p/b of the nifty is 3.54 and todays p/b is 2.52, however 41% of the nifty is financial cos so p/b may not be the right comparison while looking at historical trends.
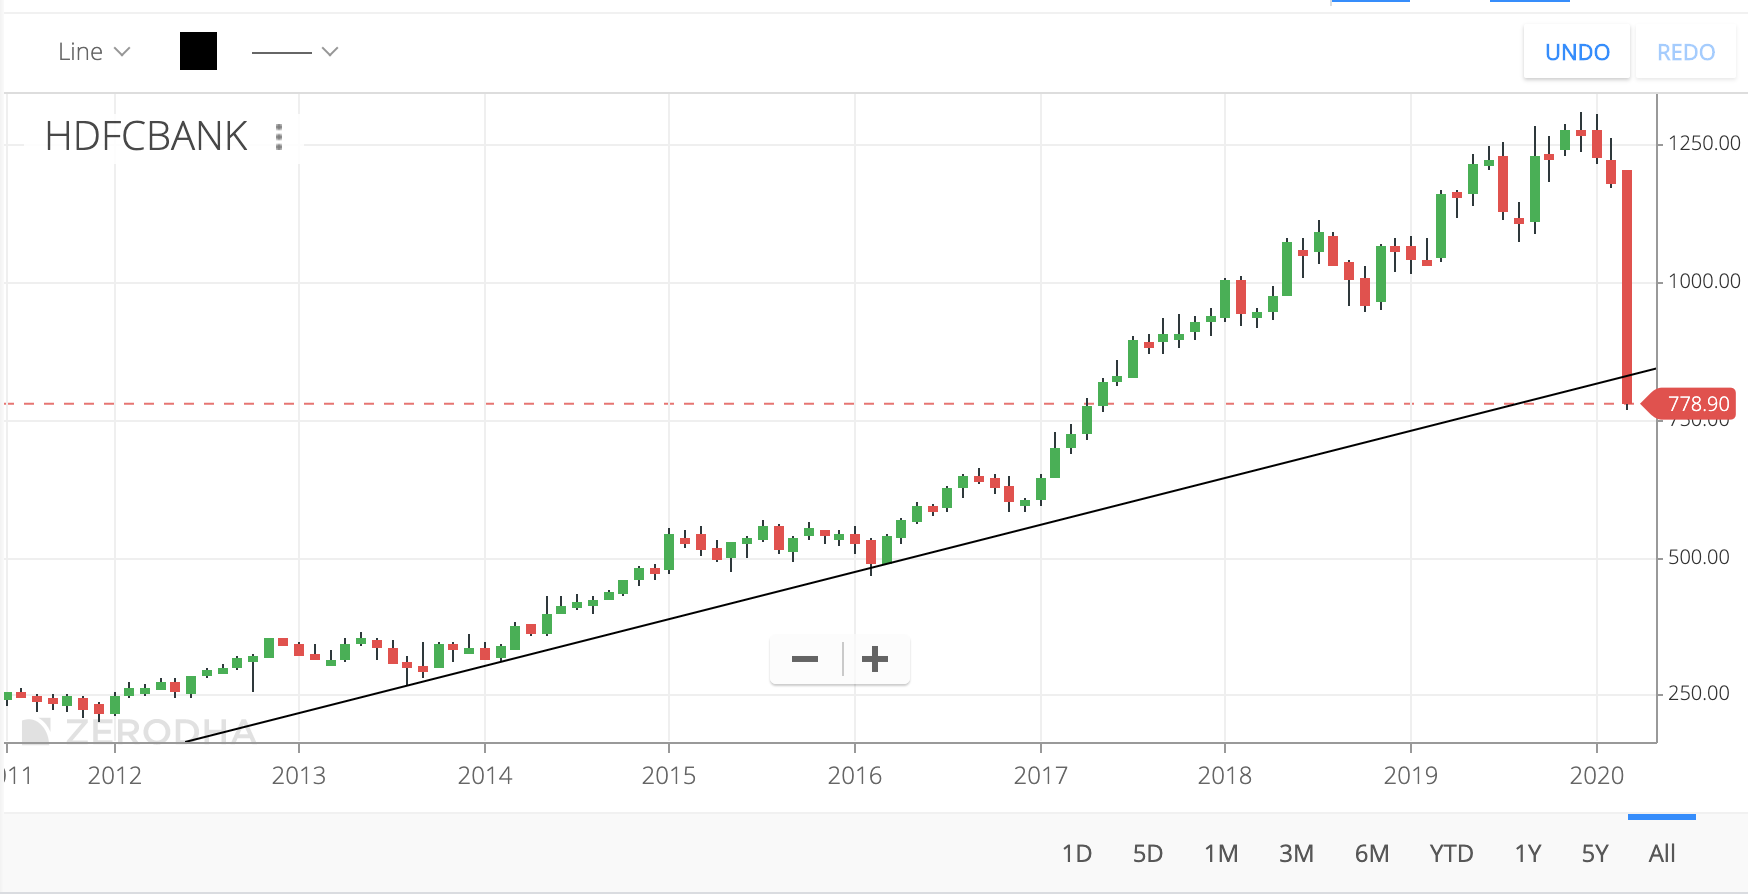
Instead one can look at the historical p/b of HDFC bank which has 11% weightage in the nifty ( HDFC & HDFC Bank together have ~20% weight). The median p/b of HDFC bank for the last 24 years i.e from 1996 to 2019 has been 4.11 and it closed today at 3.5. The least it’s been is 2.83 when the nifty tanked by 65% due to the financial crises in 2008. So its close to its all time fearful valuation support ( if HDFC Bank goes to 792 then it will be available at 2.83 p/b).
The confluence of these factors & the way prices are behaving at key support levels is interesting. HDFC bank is close to its valuation low, Market p/e is at its average level, prices are hugging the lower trendline and rebounding at key fib levels. I hope it all pans out on expected lines.
9200 last week to 7600 in almost vertical decline. I would venture a guess that it isn’t over yet because for a lot of stocks, long term trendlines just broke today, especially the big banks:
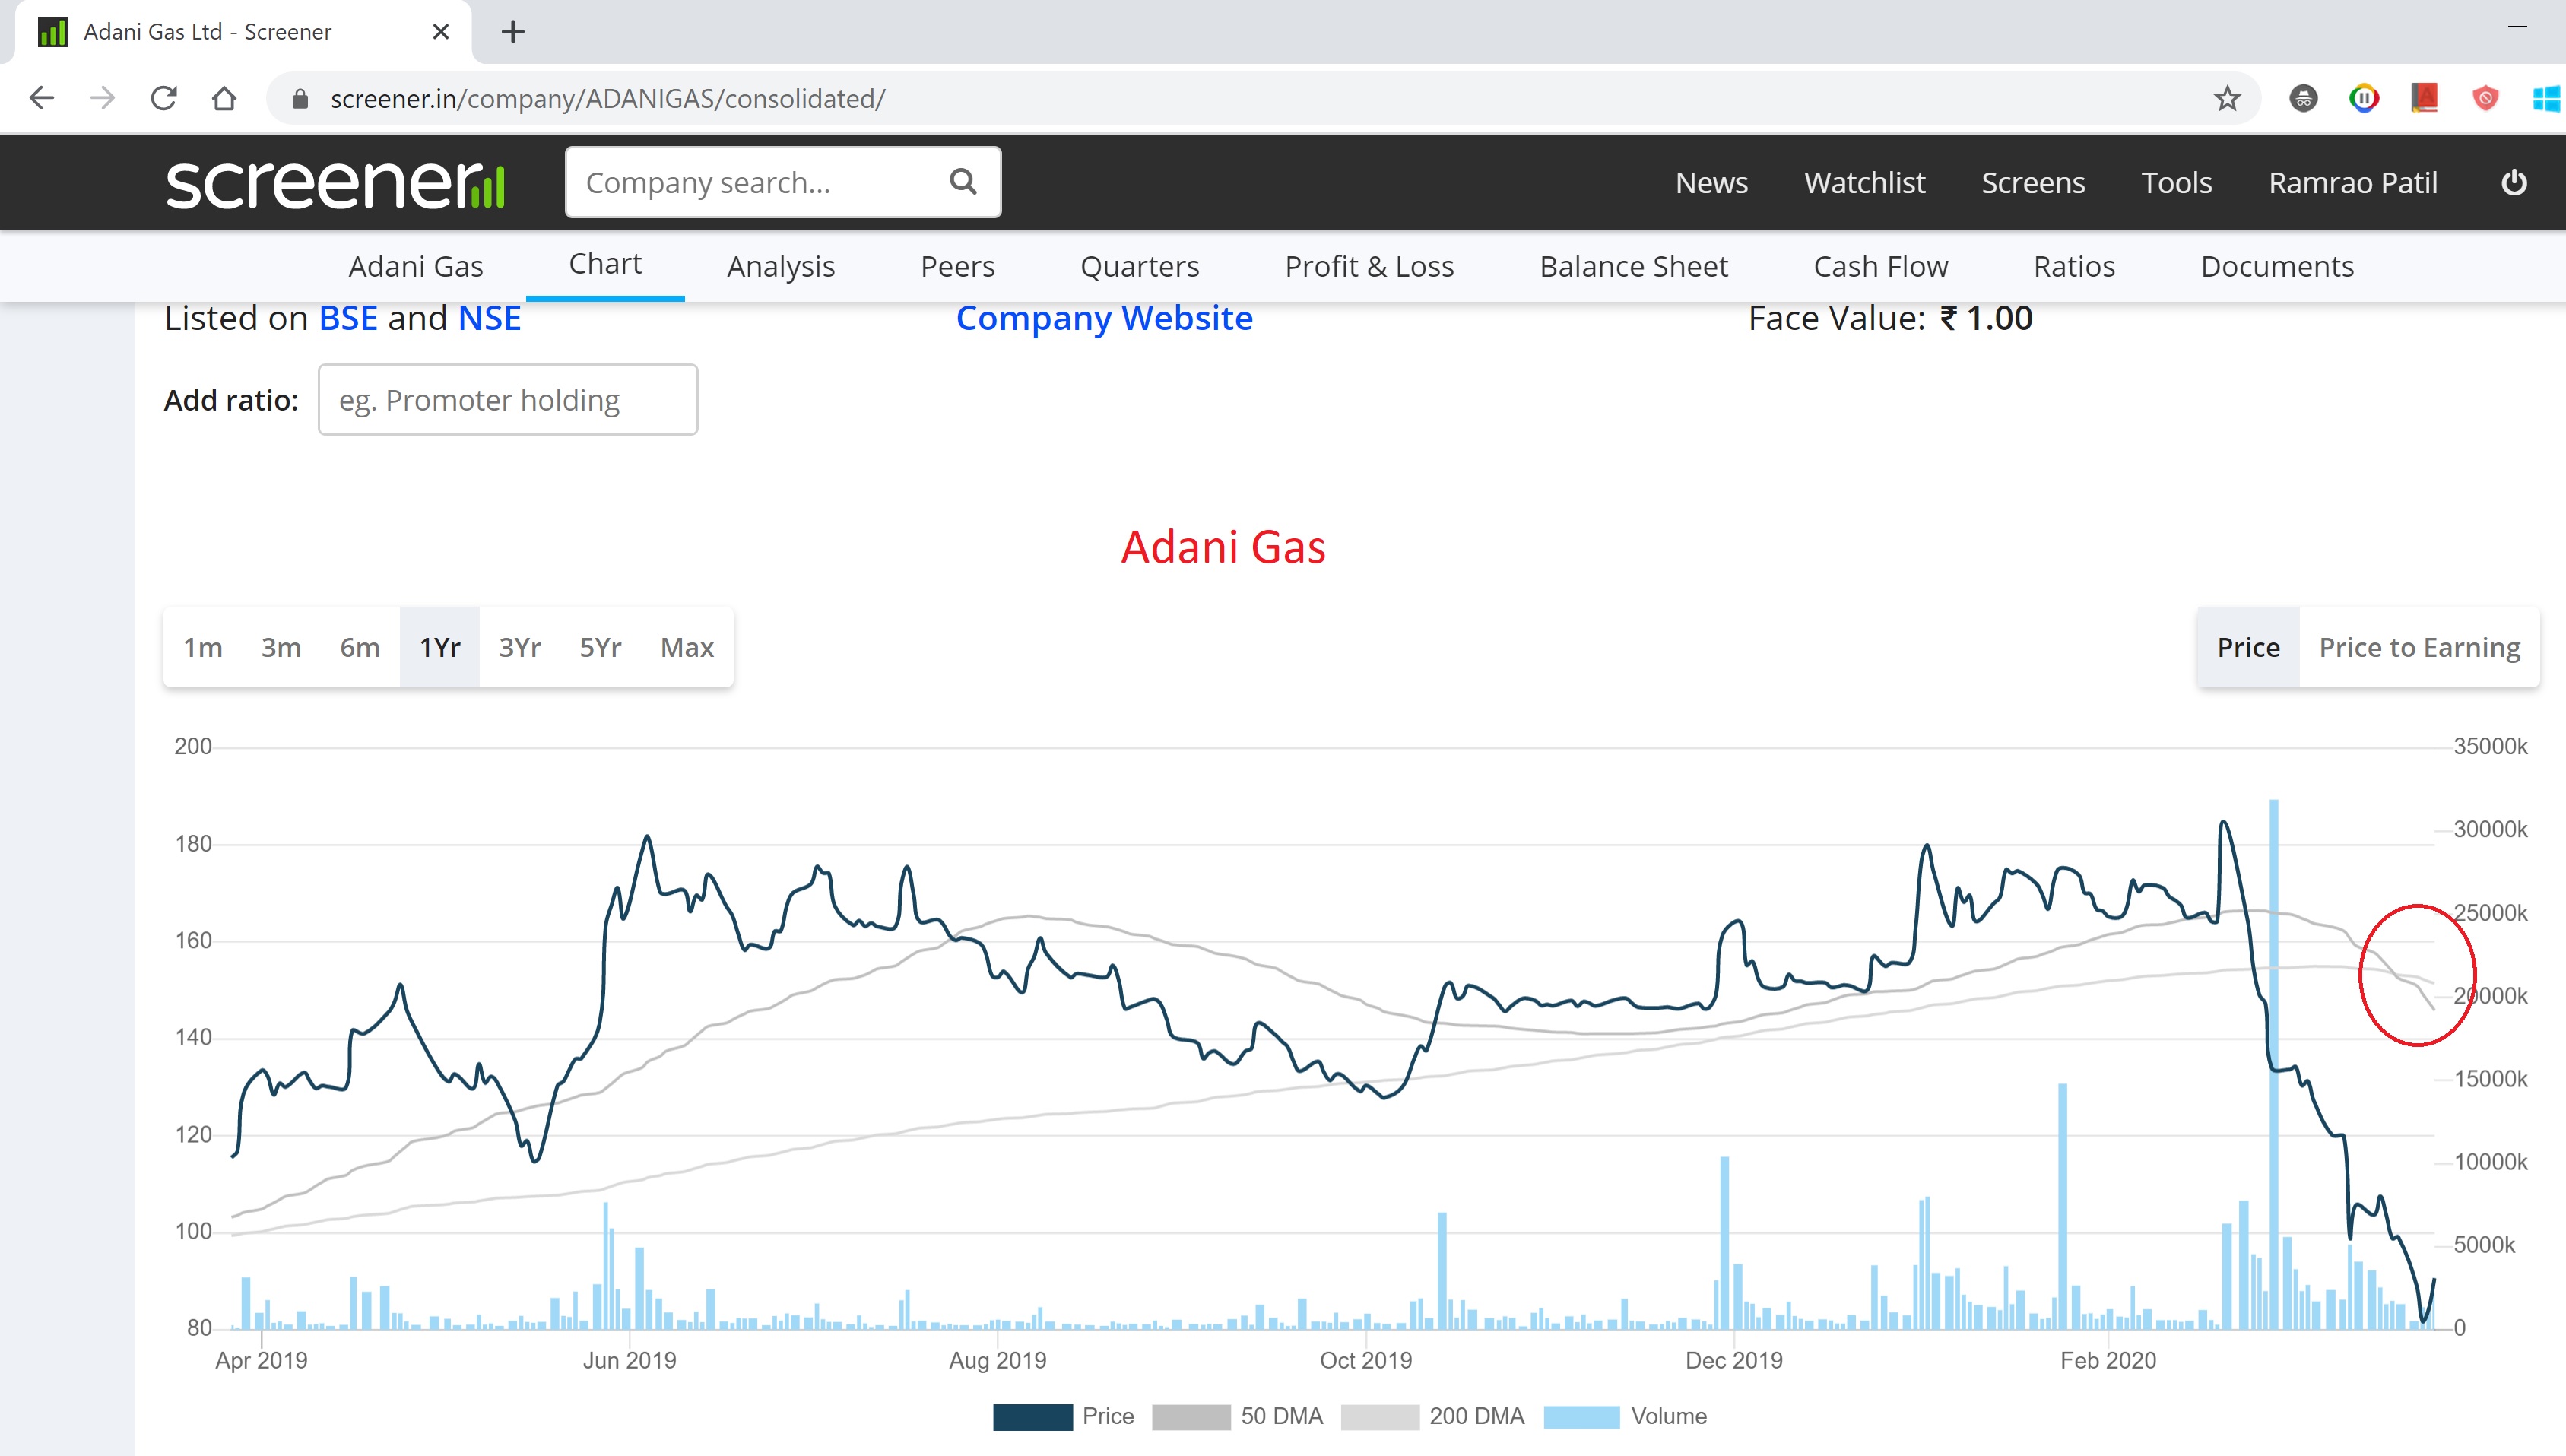
I am learning Technical analysis. Started with basics of 50DMA and 200DMA.
Here Adani Gas 200DMA crossing over 50DMA.
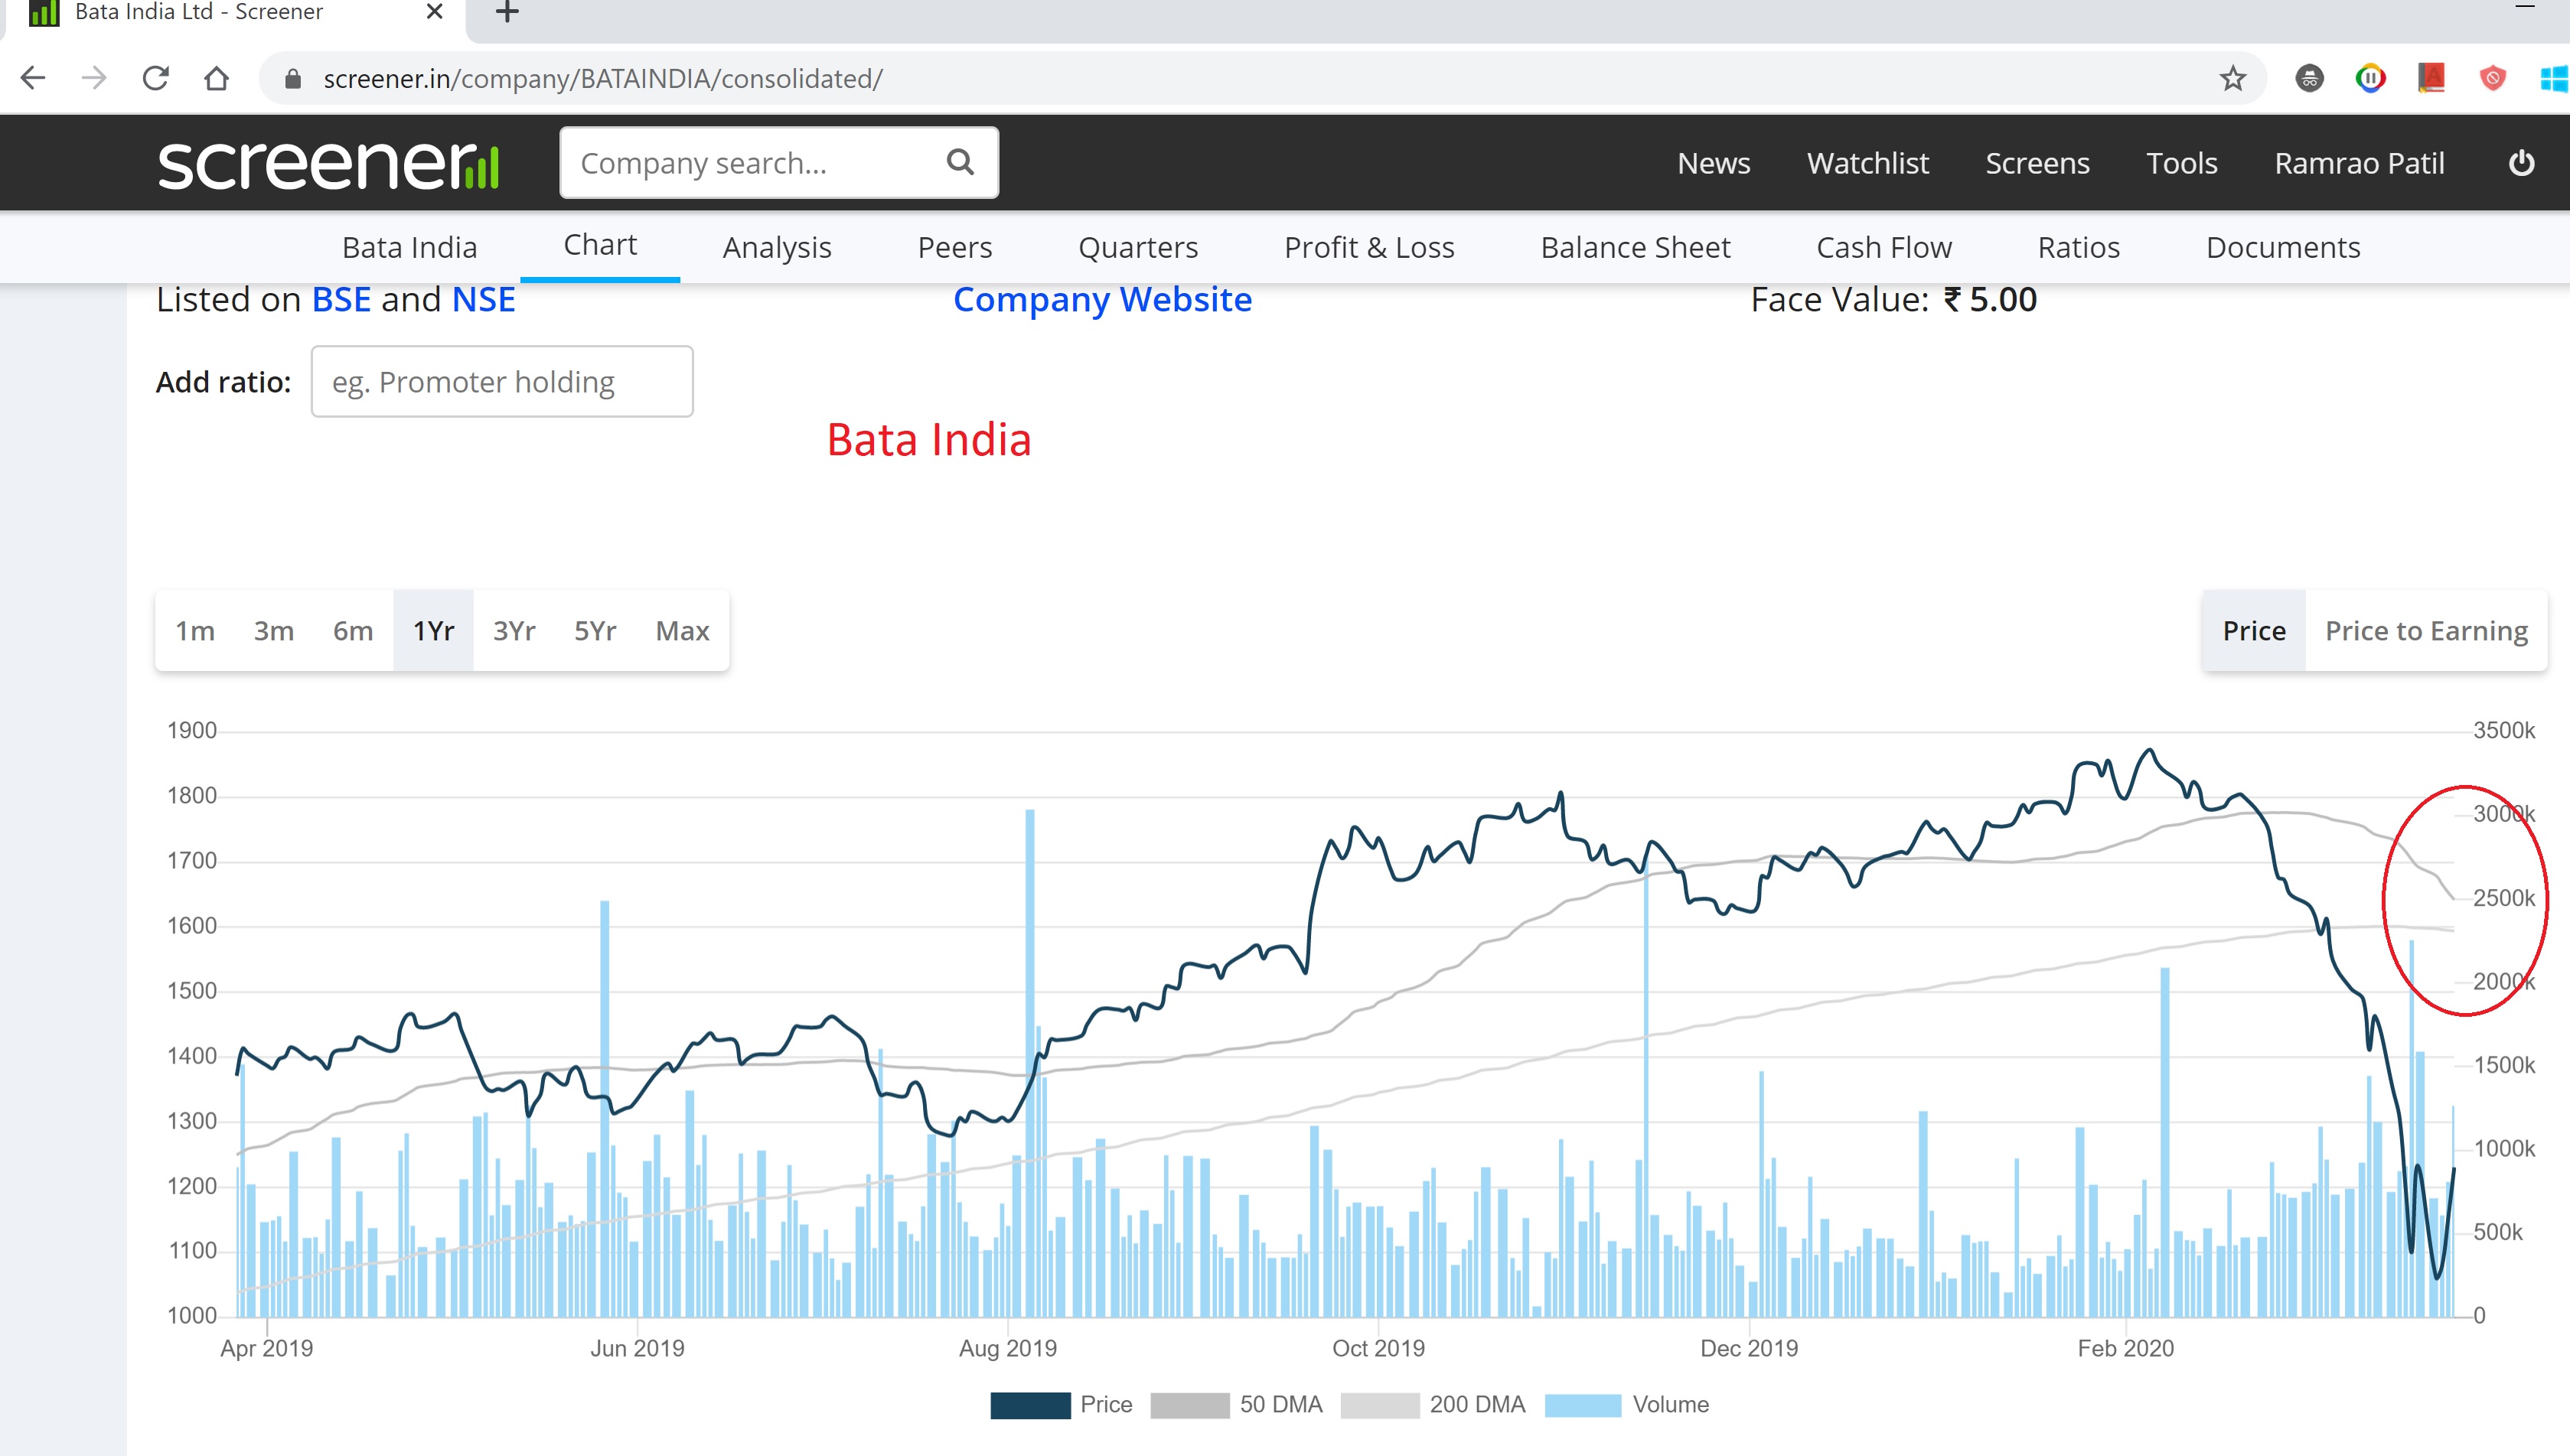
Bata looks like 200DMA may cross 50DMA
Technically, speaking the market has closed at an almost identical level week on week, despite all the gyrations and volatility. Nifty close for the week ending 20/03 was 8745.45 and nifty close for the week ending 27/03 was 8660.25 , ~1% lower. So one can say its a pause in the market as it assesses where to head next. Clearly, the price action next week will determine what the market mood is - so there is no point in second guessing.
While this may seem naive, but the fact is that for each share sold there is a buyer. A bull market is a sellers market where the seller can get any price he wants and a top is generally formed when there are no buyers for the sellers asking price. Clearly, strong good news is the fuel that drives the price up. Who would pay a premium if the news is bad?
At the other end a bear market is a buyers market where the buyers can get any price he wants. Its driven by bad news. Who would sell at a discount if the news is good? The bottom is formed when there are no sellers at the buyers bidding price.
Last week we saw HDFC bank hitting a p/b of 2.5 which it has never done in its long illustrious history - ofc prices rebounded back in a jiffy but for the market to go down further as many are fearing it stands to reason that hdfc bank will also need to go down further and unless one believes that the situation is so bad in india that HDFC bank is going to do the impossible - i think its ok to be cautiously hopeful.
Thinking about uptrends seems to be laughable so i have drawn a tentative down channel in which i will observe how prices behave. The earlier uptrending channel from the 2008 lows still remains and prices have broken downwards and there is a slim chance that it may be a false breakout.
Ultimately , if there is a bottom, it will be characterized by sellers refusing to give away freebies to buyers.
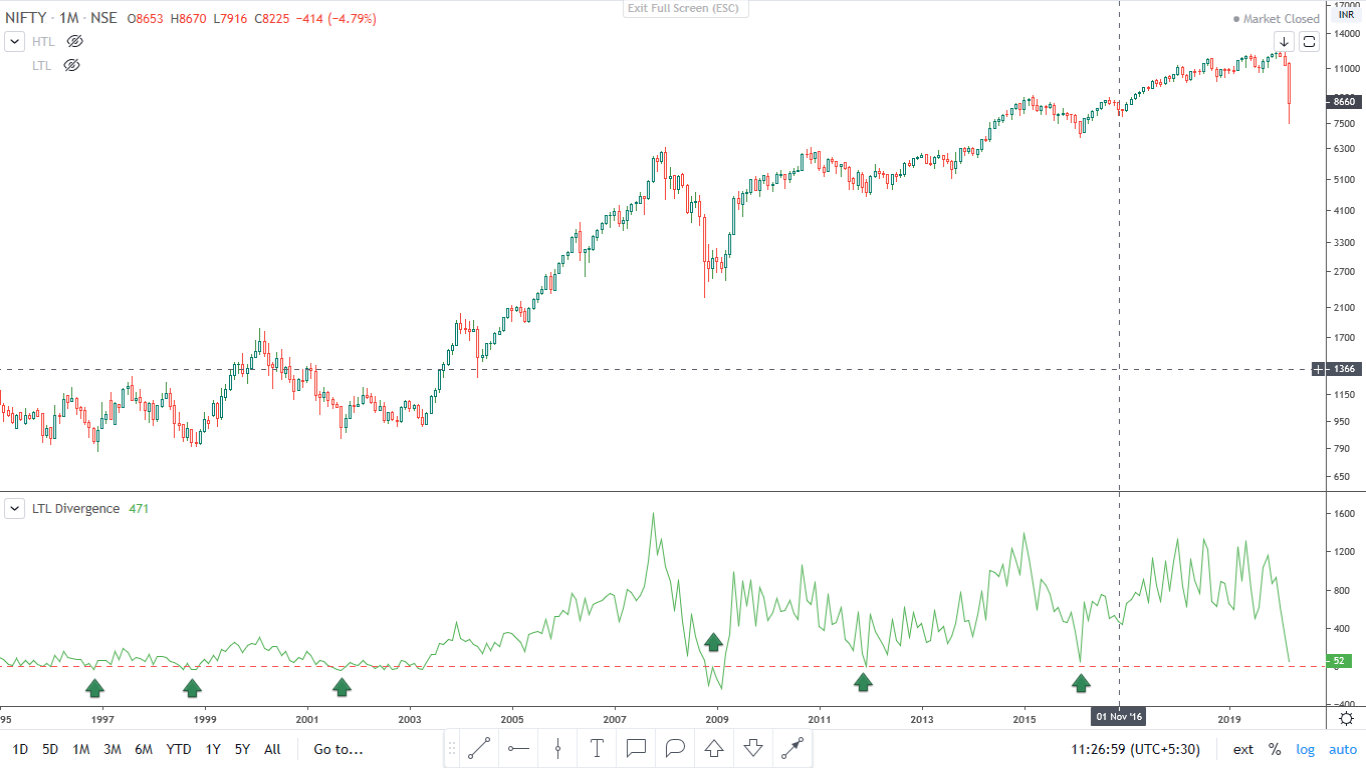
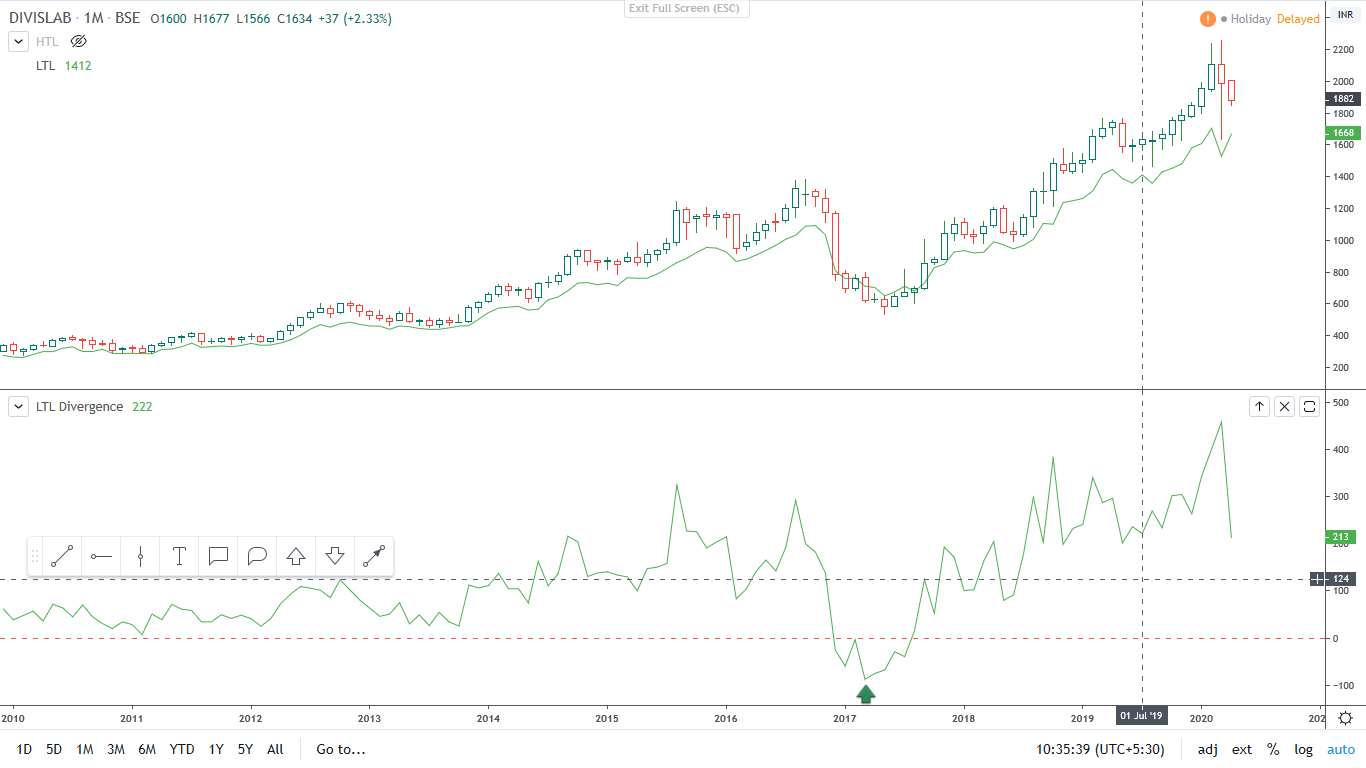
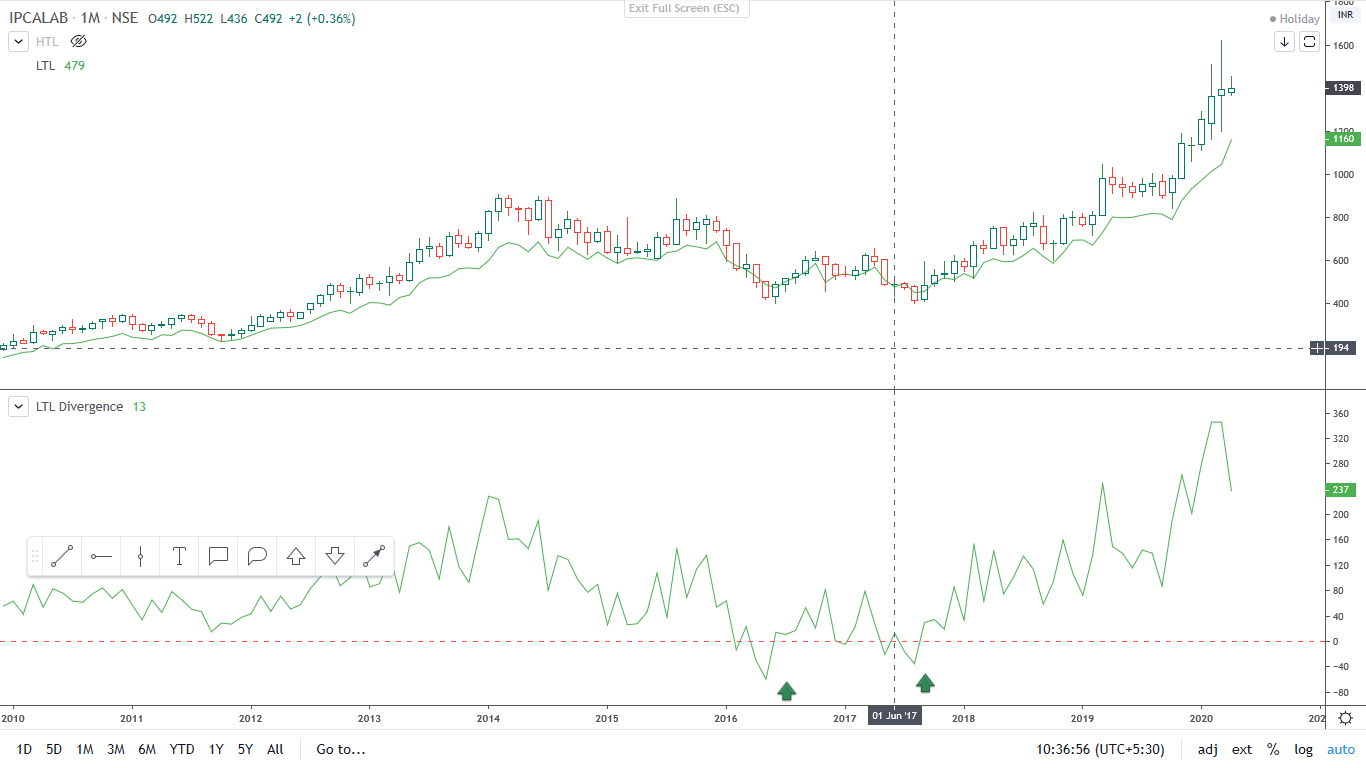
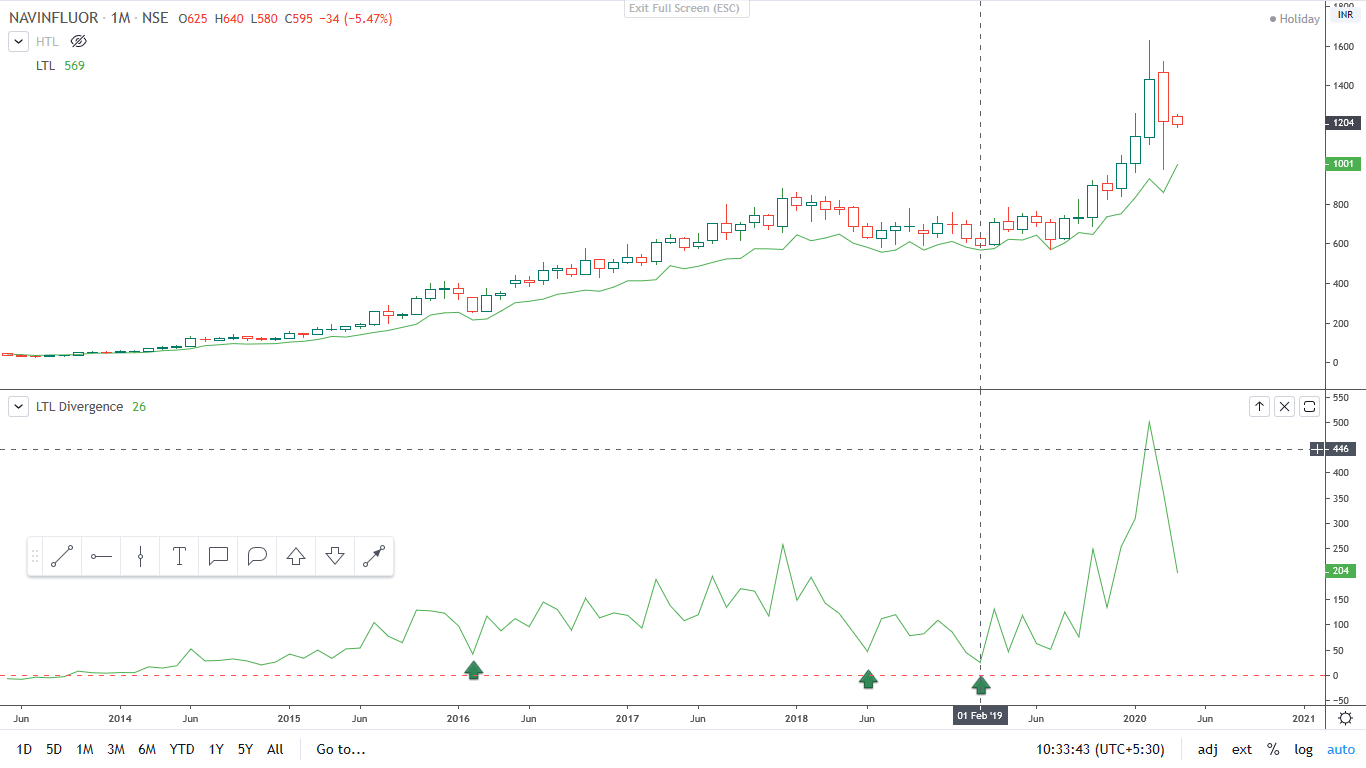
I pick my investments based on business moat, ROE and EBITDA and then I use my fundamental/technical screener to invest in them. From the charts, one can see the resilience of these stocks in this mayhem. I pick them near zero or when the indicator crosses zero from below. In this way, one cannot lose money. NO DCF, No valuation, no scuttlebutt, no gyan,etc . Identify
good businesses with moat , invest and relax. I was also the first to warn here about the fall but surprised at the pace and extent of the fall. That is Mr Market.
Hi That is my invention. Basically I am a trader as well as LT Investor. Mainly trade on indices and cash good stocks delivery based and invest for LT. It is an indicator for divergence with the price.