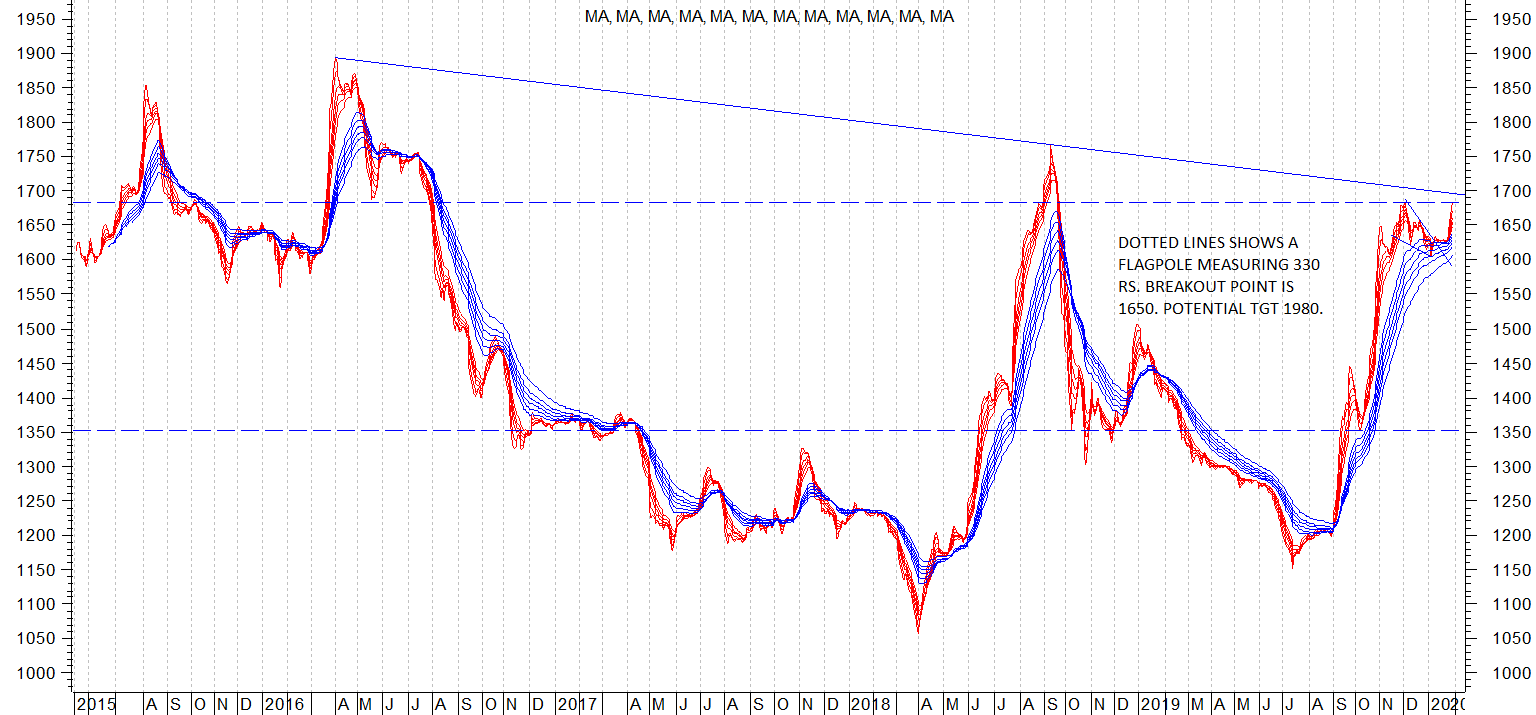
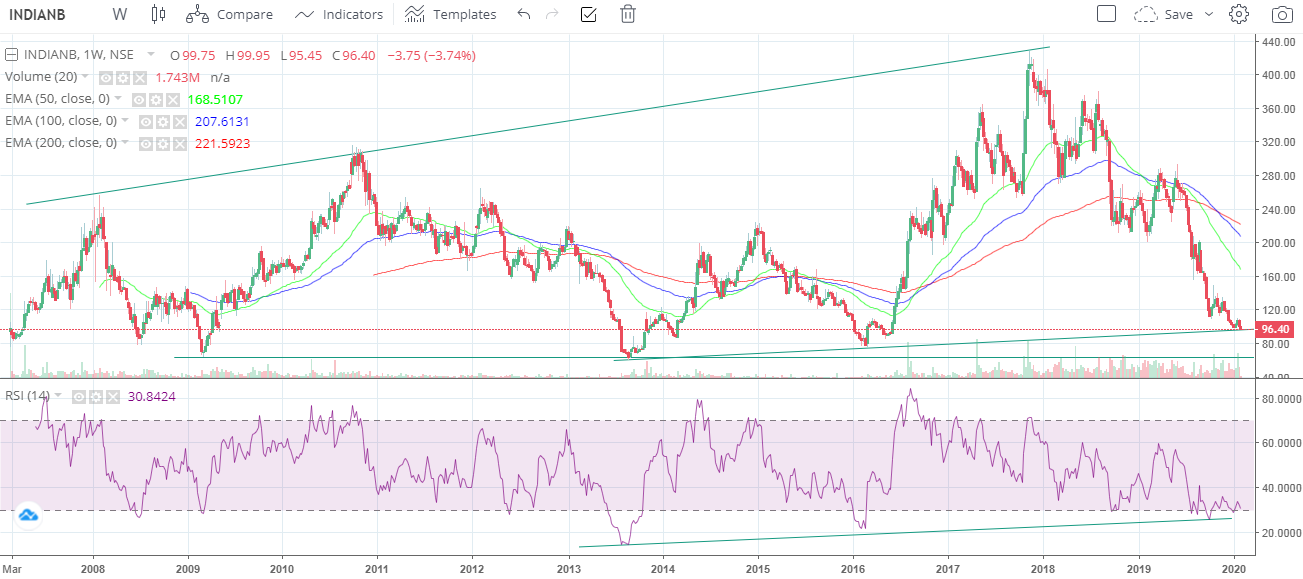
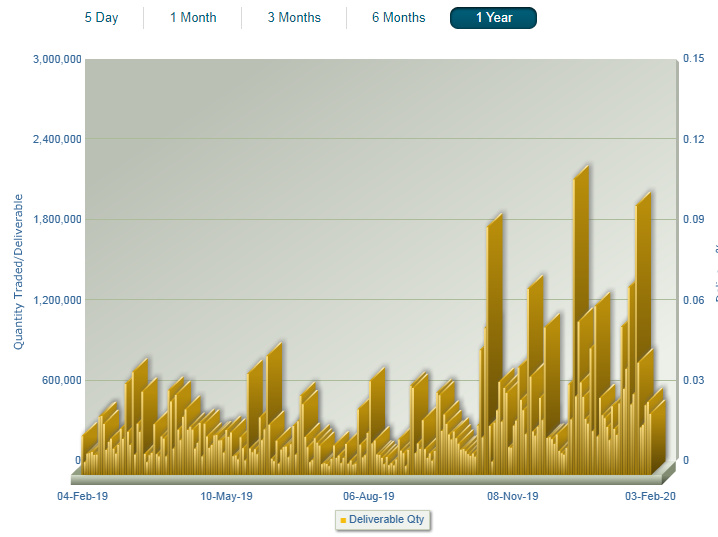
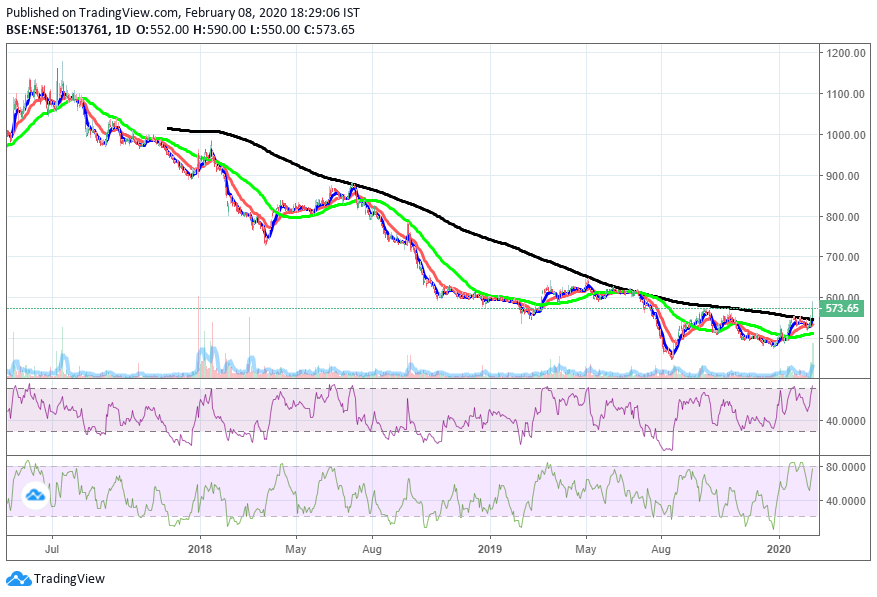
Glaxo Pharma has been consolidating below its long term breakout level of 1700-1750 (trendline resistance) in a very tight range. There has been heavy consolidation between 1590-1690 and now seems to be generating decent volumes and making an attempt at a breakout.
Company has put up a huge plant at Vemgal to reduce dependence on third party manufacturers. Plus it has a stated policy of focussing on power brands and trying to phase out tail end of portfolio. Because of this, revenues might show sedate growth but profitability should improve as more efforts are made to sweat the power brands.
Top brands include augmentin, calpol, betnovate, ceftum, zinetac, eltroxin, phexin, neosporin etc. Synflorix is second largest vaccine brand in India.
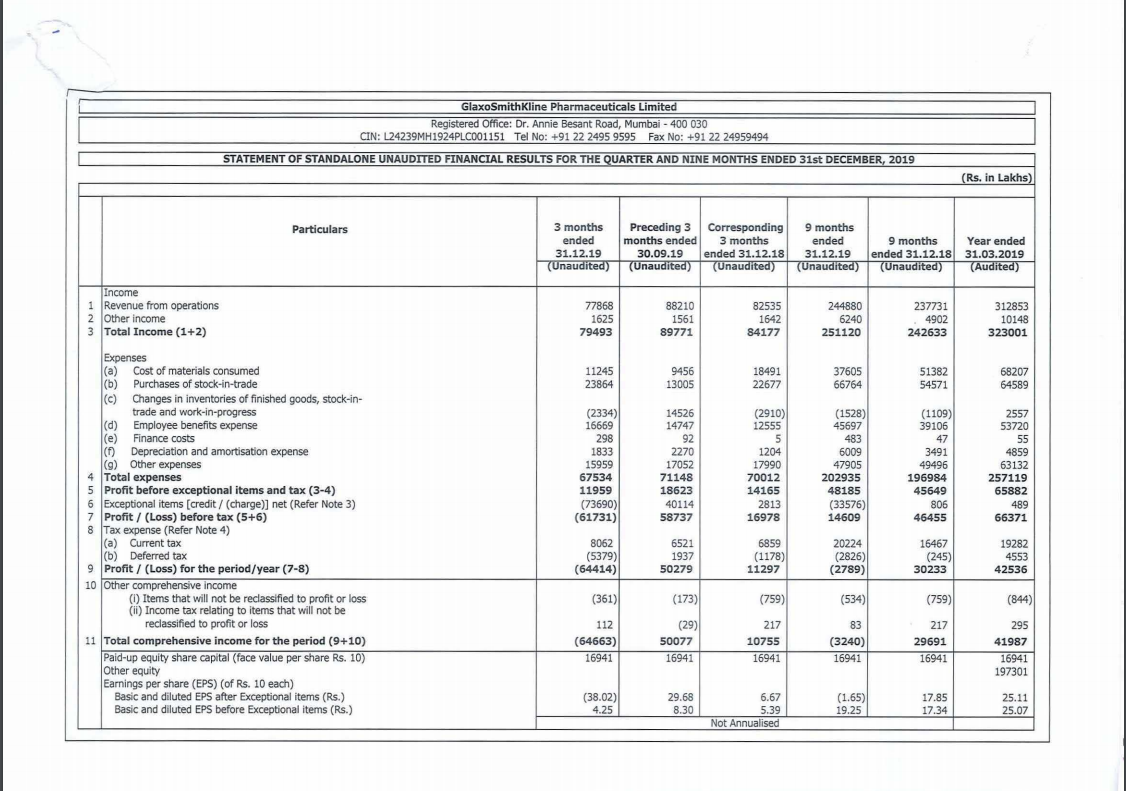
Company had written off channel inventory, stock returns etc of ranitidine during q2 fy 20 to the tune of 110 crores. This might be reverted jacking up net profits besides the usual growth in net profits. results on 3rd feb 2020
The charts look attractive but seems a confirmatory close above 1750 on weekly charts will be the trigger to invest for long term… till then it may keep on oscillating between 1590 - 1690. Its a good candidate to keep in watch list & monitor the movement for fresh entry. Traders may enjoy the range as well.
Glaxo results are a perfect example of the term “shit happens”. One would have thought that an MNC company putting up a huge plant would have done a lot of due diligence and then decided to go ahead with the plant construction. Here we have some problems with ranitidine and company is now reconsidering its stance.
While the conservatism of the company has to be applauded both on the counts of not re launching zinetac in a hurry and secondly providing for diminution in value of plant, it is bad news for shareholders. Stock price seems to be battling to hold on to its 200 dema around 1470-75 after a cut of 10-11% today.
I understand that company has booked Rs600 cr as impairment .Does it mean that they have booked the whole cost of plant as loss and on selling the same ,some write back would be there like provisions write back in a finance company. Since you are from medicine background, could you throw some light as to how is the company products placed in the market and it’s possibility of recovery?can it be like Nestle recovery or different?
Thanks in advance
I think there will be some writeback once the company sells the plant to some other suitor. Regarding products of the company they are top notch and usually Glaxo sets the standard in product quality. No worry on that front. The company has been a leader in some segments since decades and likely to remain so.
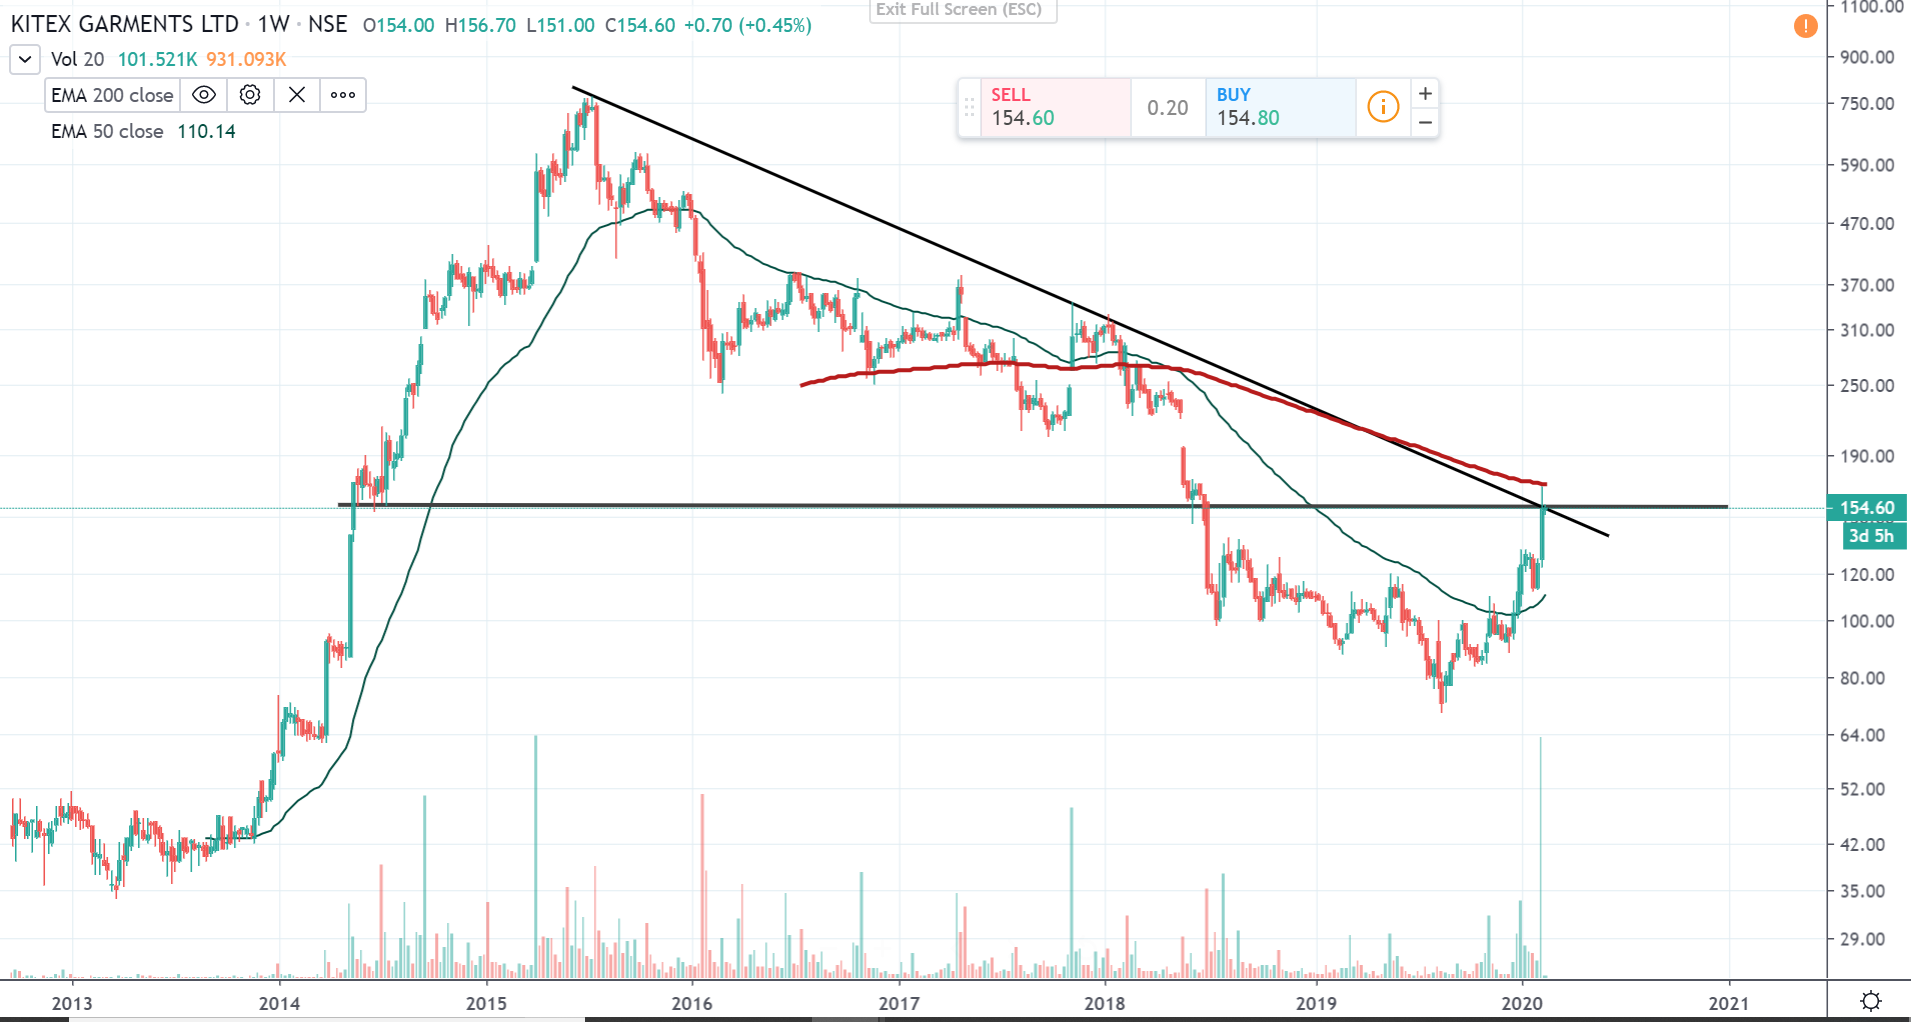
I have started learning technical analysis .Can someone confirm if i have drawn the correct trendline .Looks like Kitex has given breakout with high volume .
Yes …the volumes are extraordinarily high …and this might qualify for a breakout …another filter you may apply is wait for the stock to consolidate after breaking out and then see where does it head. Say it makes a higher low and subsequently a higher high, then the breakout is doubly confirmed.
This all is strictly as per charts and purely observational.
Regards
Divyansh
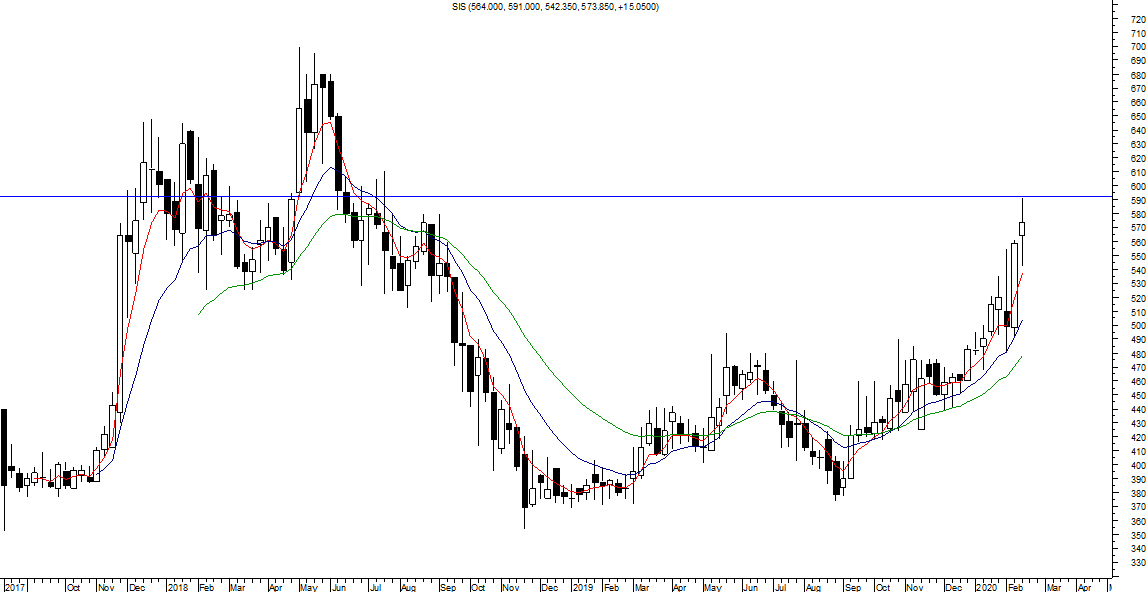
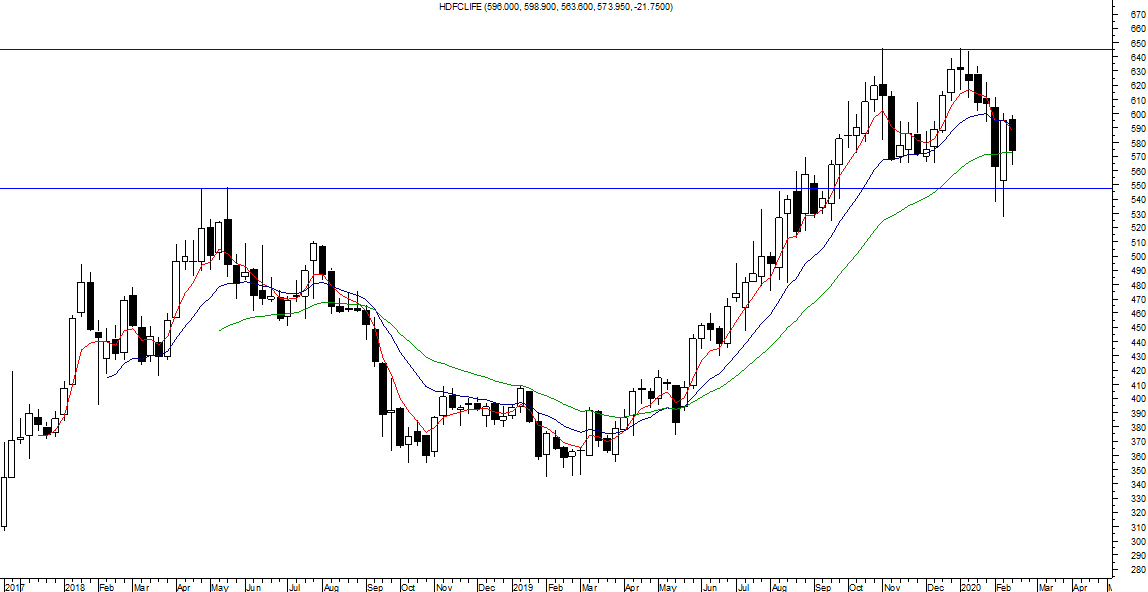
Thanks, my estimate worked out well. SIS broke out while HDFC life is consolidating. I think HDFc life will have to go down some more for it to be attractive again for me. I also suspect that the sector trend could be broken after the budget proposals amid very high valuation.
it looks like pharma is back in vogue after a very long time . Since the consolidation has lasted for many years and these stocks haven’t gone anywhere for a long time .With earnings growth emerging , sector looks set for a very good run indeed. stocks like Alkem,FDC,jbchem ,torrent,IPCA which have a good mix of domestic vs international business have already gone up a bit after breakout ,but these kind of sectoral breakouts are powerful and don’t fade out easily.
Disc: Invested in Alkem,torrent,granules,Alembic .Please do your own due diligence,risk management etc
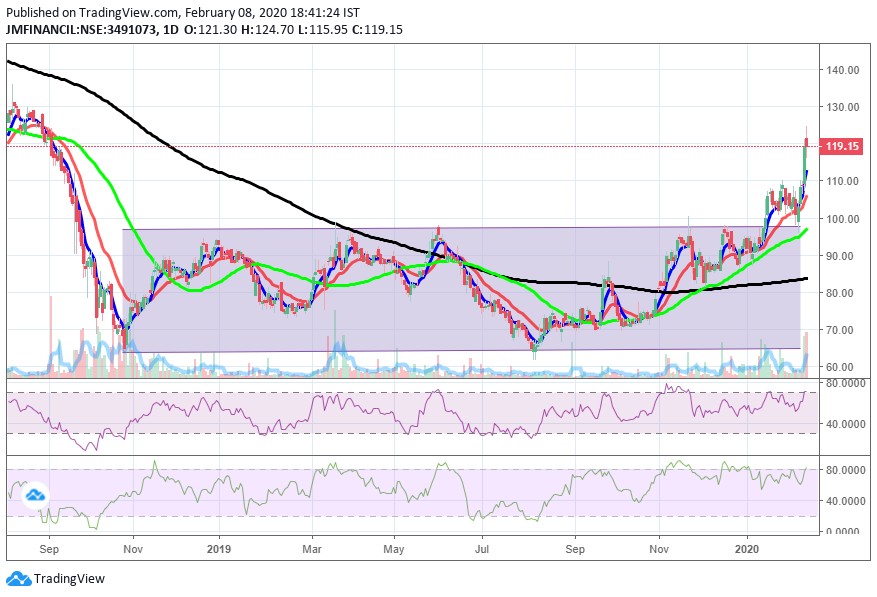
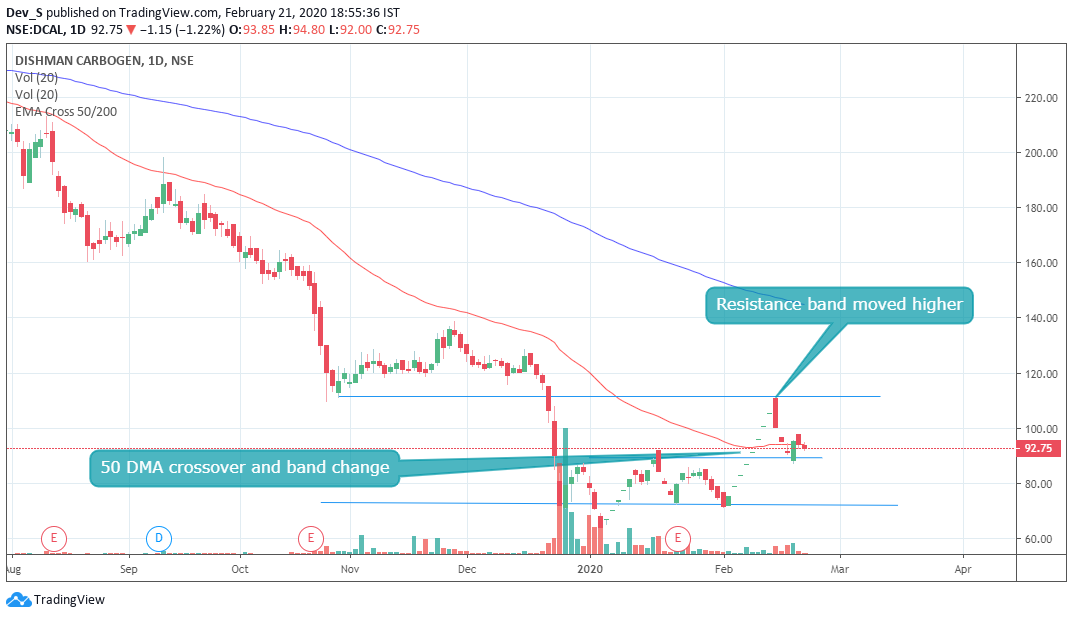
After stupendous fall(IT raids issues) Dishman carbogen has made first double bottom around 75 and moving to upper band now where support is 90 and resistance is 110. if 90 is not broken, likely to move back to 110…
first attempt at technicals…pl comment if there are better ways to look at it…thx
additional notes - MF and FPI holding has increased in Dec Qtr, currently buy back is going on
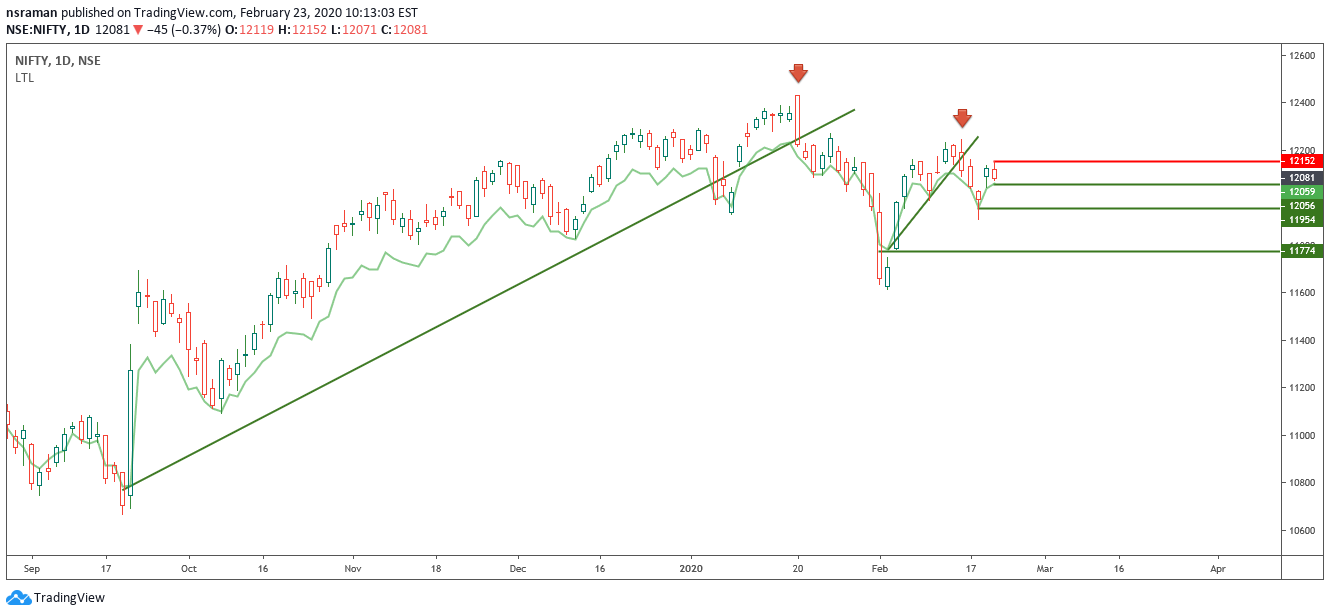
The entire uptrend from the Tax cut day is in jeopardy. My system draws trend lines in a different way. it is low and high of the Green trend Line. I have marked critical supports and resistances
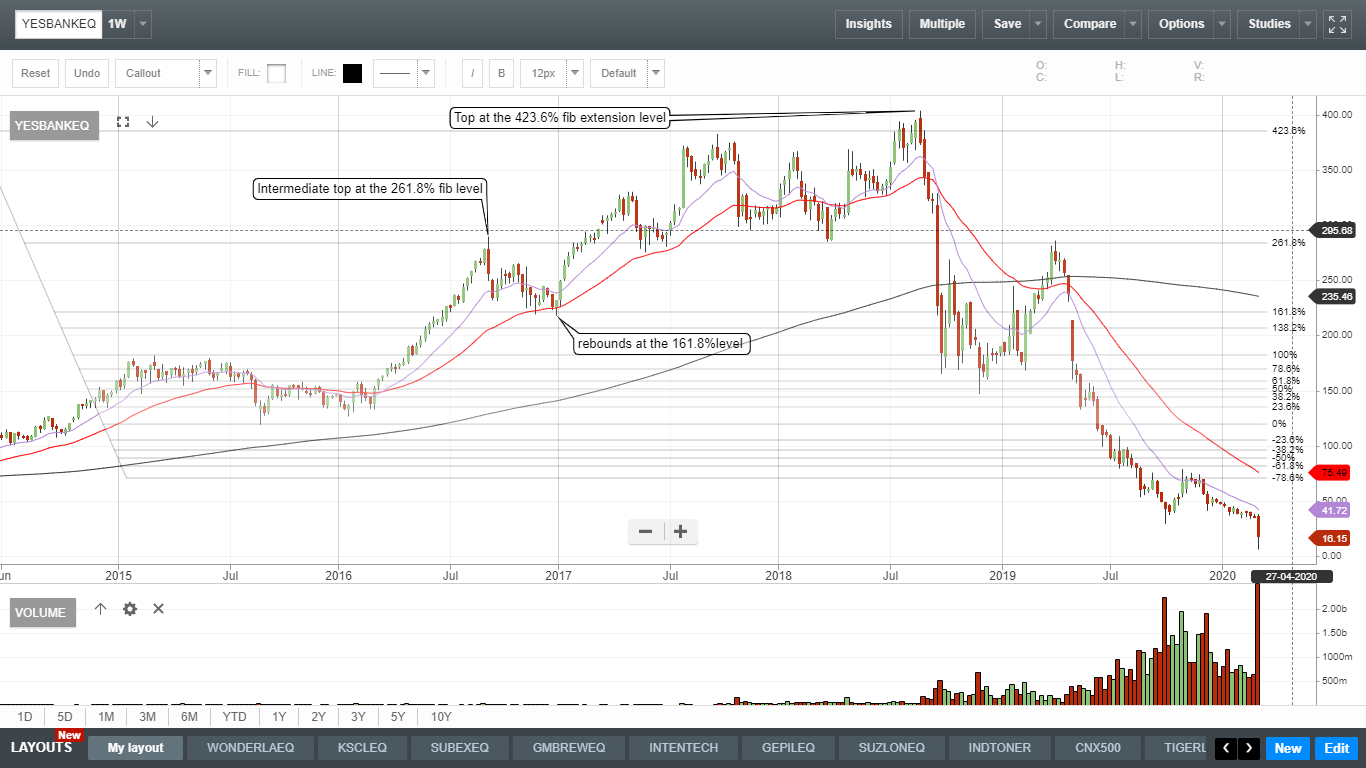
Here is a chart of Yes Bank with the absolute top at the 423.6% fib extension level. All this is in hindsight ofc and holds limited utility but still when invested in stocks that are surging ahead in terms of stock prices - putting up fib levels and extensions could in the least put a context to the price action.
Hey bheeshma
Can you explain a bit more about the above post of yours with more examples. I am of the opinion that what happened with yes bank was more cause of bad business practise and dishonest promoters. price action can at best show that the price has run up too much in the time being or it has broken down to a extent that both situation warrant a double check before committing any money. Can the reverse of fib levels be applied to stock price charts which have corrected heavily ( keeping fundamentals aside) and then trying to invest in them.
These is all for info and curiosity sake. Have always enjoyed reading your posts.
Regards
Divyansh