
nifty50
a dissection into the half day chart
bearish view…
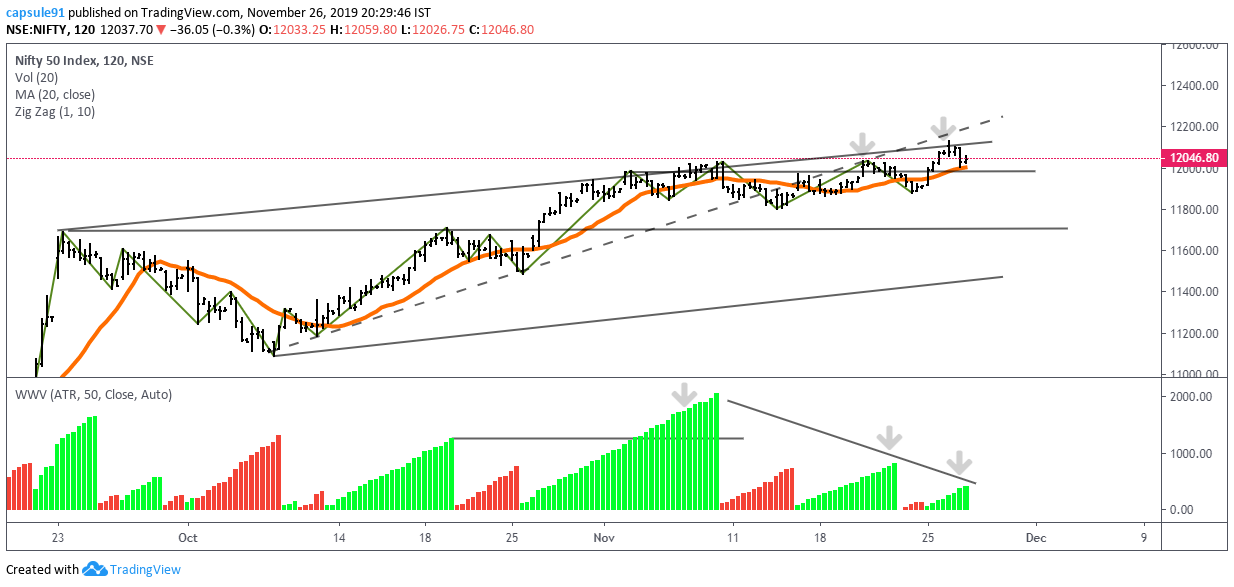
the bottom indicator is just the weis wave which calculates the swing volume and plots the histogram
-
price has barely progressed in November series so far, the action has stuck to the supply line thoughout, making just 3% odd gains , without testing the supply …
lack of upward movement, at the same time no interest in supply check [secondary test]…
very suspicious what the composite operators are building the cause for -
a demand line can be drawn across the lows, as mentioned in dotted…
last 2 upswings failed to maintain above it, rather has started taking supply from it…
evidence of trend exhuastion -
looking at the weis wave panel, novement early, so a good momentum from the price… it was the highest upswing effort the price action displayed in last 2 months…
but although it has started to make highers lows and highers highs after that, can be called a trend, but i am not convinced looking at the result of the upswing…
this is a judgmental statement, i definitely see an effort vs reward mismatch in movement -
point 3 get reinforced, because the 2 upswings after that had very poor quality of demand… specially compared to October and early November rally…
conclusion…
- momentum exhaustion
- poor market breadth
- suspicion of the composite group selling into this trend
- excitement regarding q2 earnings [ have been a engineered upswing in market mood via media by the composite group] and the numbers thereafter failing to excite the institutions?..
- poor risk reward
bullish view [short term]
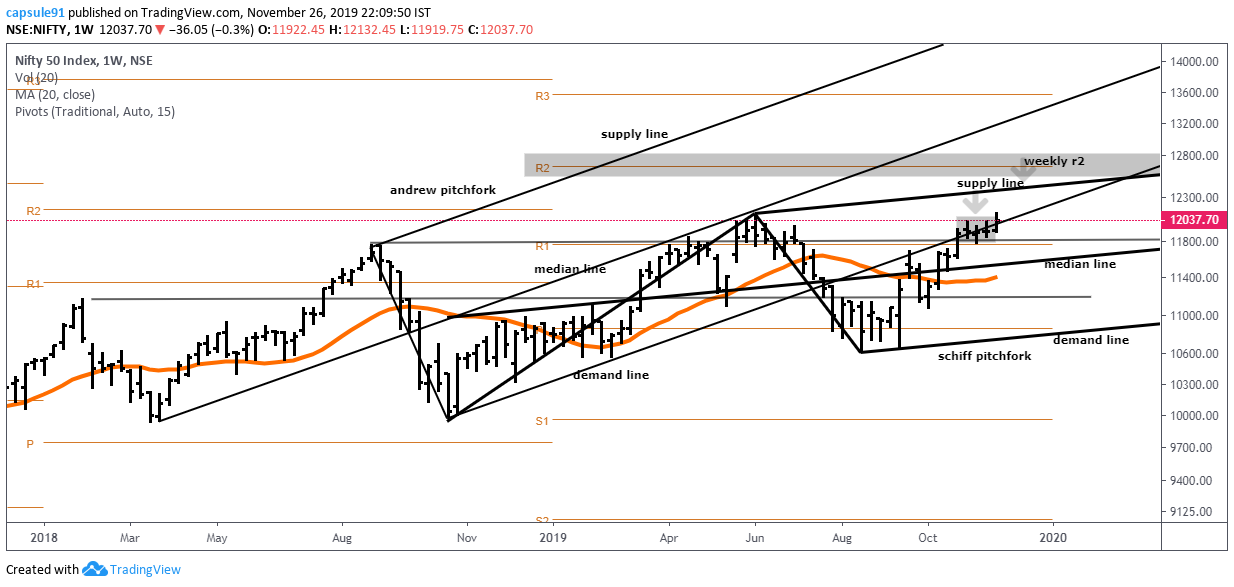
the contra view to the above picture would be …
pitchfork used because , the market is volatile, not trending in the weekly chart, relative strength in between swings can be well analysed
andrew pitchfork is used on a older swing
schiff pitchfork is used on a more recent swing
- the present action broke took resistance from the median line of the andrew’s pf, and broke below the demand line, and is currently retesting it… no upward action has been seen yet but the positive build in this is the fact the last 3 week’s bar had poor close, maintained above the 18’ august high and r1 resistance, some local absorption of supply might be there
2.the supply line of the schiff pitchfork has higher than the current price action, near the r2 resistance which is roughly at 12600
so there might be some more headroom for over extension of the current move…
the price action in the last 24 months havent sustained beyond 8% deviation from the 20 weekly moving average, it is present 6% above it…
disclaimer… i am bullish on the longer term picture on the index, yet, expecting short term weakness… indices around the world has topped out, and i am very interested to see how much supply comes in and the quality of it, in terms of effect on price action…